ALB Gap Fill on Earnings?ALB gapped down today, went long on earnings since they usually beat. Only 100 shares for kicks and giggles.
Trade ideas
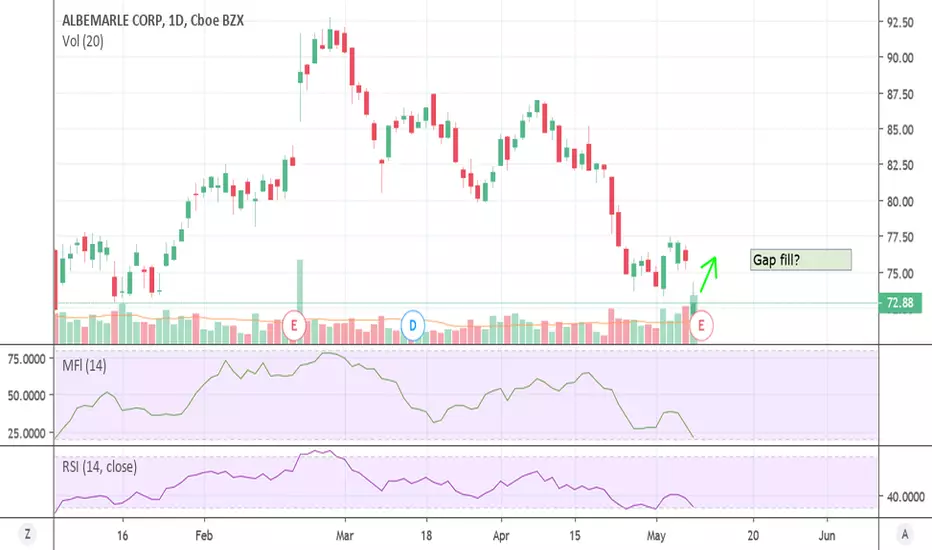
$ALB Bullish after earnings surprise . ALB produced a excellent and surprising set of results yesterday and upbeat guidance. The only disappointment was a decline in revenue from Lithium sales but that was as a result of factors outside the companies control. ALB has already tested this $73 range once before and bounced, hopefully we see the same and a move towards $93 will ensue. The average price target on the stock is $106 but until world trade disputes are resolved this will probably not be reached for some time.
Company Description
Albemarle Corp. is a specialty company, which engages in developing, manufacturing, and marketing of chemicals for consumer electronics, petroleum refining, utilities, packaging, construction, transportation, pharmaceuticals, crop production, food-safety, and custom chemistry services. It operates through the following segments: Lithium and Advanced Materials, Bromine Specialties, and Refining Solutions. The Lithium and Advanced Materials segment include two product categories: Lithium and PCS. The Lithium business develops and manufactures a broad range of basic lithium compounds. The Performance Catalyst Solutions division operates in three product lines: organometallics, polymer catalysts and Curatives. The Bromine Specialties segment consists of bromine and bromine-based business includes products used in fire safety solutions and other specialty chemicals applications. The Refining Solutions segment contain two product lines: clean fuels technologies, which is primarily composed of hydro processing catalysts, and heavy oil upgrading that comprises of fluidized catalytic cracking catalysts and additives.

ALB EarningsEarnings are a crap shoot, but this one looks good financially. Hammered down for no reason....
As usual if we get a pre-earnings pop tomorrow, I'm taking the easy money and running. Report tomorrow after close.

ALB resistence bounceI decided to do my first drawing, expecting a bounce in ALB from resistance around 75.

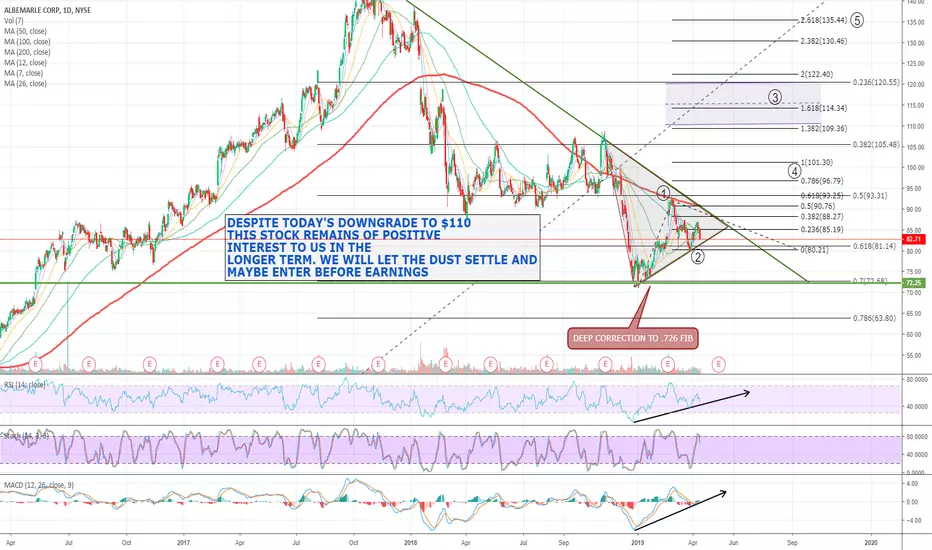
$ALB ALBEMARLE CORP, looks appealing at this level.Like many of the miners, things have not been easy recently. Global unrest and trade disputes have made it very difficult for investors to have confidence in future prospects. We believe the skepticism is overdone and ALB is on our long list after the dust settles from today's downgrade to a price which is actually 33% above current levels.
ALB Cup and Handle Rally $97 after EarningsFibonocci @ $140 and $50
Cup and Handle
Convergence of moving averages

Albemarle CorporationDAILY
short term uptrend
price above 20 MA
initial support at 85.92
possible trendline support
resistance at 93.14
supply zone at 98.50 to 96

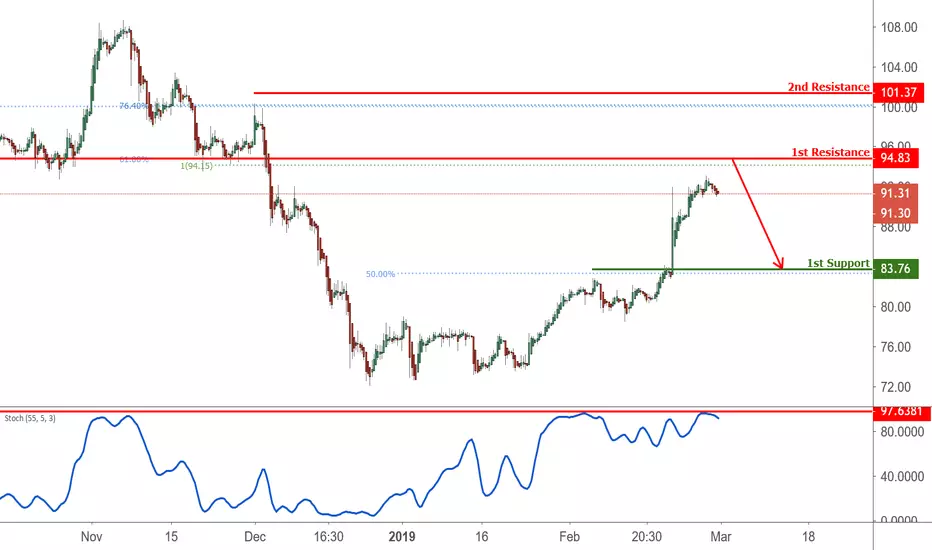
ALB approaching resistance, potential drop! ALB is approaching our first resistance at 94.83 (horizontal overlap resistance, 100% extension, 61.8% fibonacci retracement) where a strong drop might occur below this level pushing price down to our major support at 83.76 (horizontal pullback support, 50% fibonacci retracement).
Stochastic (55,5,3) is also approaching resistance where we might see a corresponding drop in price.
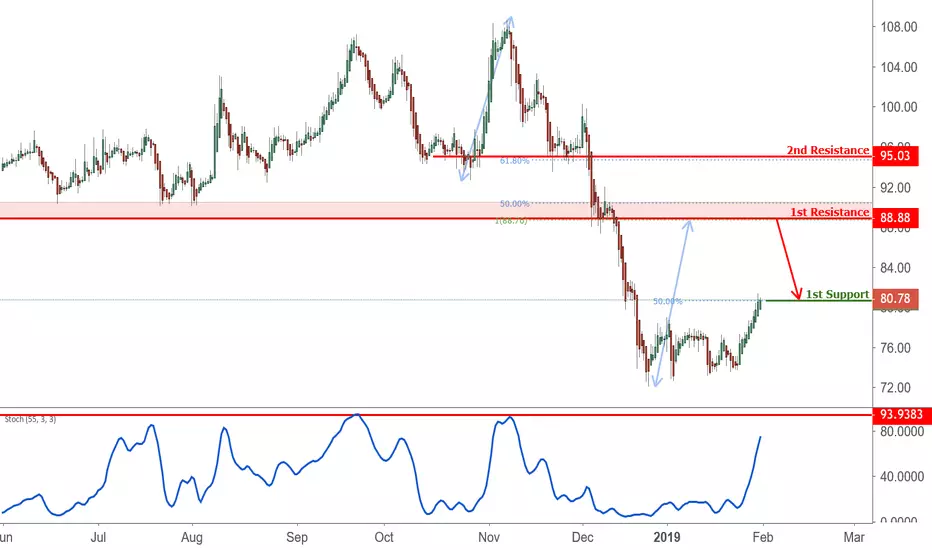
ALB approaching resistance, potential drop! ALB is approaching our first resistance at 88.88 (horizontal pullback resistance, 50% fibonacci retracement, 100% Fiboancci extension) where a strong drop might occur below this level pushing price down to our major support at 80.67 (50% Fibonacci retracement).
Stochastic (55,5,3) is also approaching resistance where we might see a corresponding drop in price.
ALB - ABLEMARLE Lithium Play - Bottoms Q2 2020 ~ brschultzJust finished my piece on ALB monthly and daily models (eue.tu.ub)
Both Daily & Monthly Models point to a low - optimal buy point - in Q2 2020
brschultz

ALB Approaching Support, Potential Bounce!ALB is approaching our first support at 72.81 (horizontal pullback support, 50% fiboancci retracement, 61.8% fibonacci extnesion) where a strong bounce might occur above this level pushing price up to our major resistance at 90.30 (horizontal pullback resistance, 23.6% fiboancci retracement).
Stochastic (89,5,3) is also approaching support and seeing a bullish divergence where we might see a corresponding bounce in price.

Time to charge the batteries So let’s see Tesla is making more cars we all use battery powered everything, so why are you selling?

ALBWeak fundamental score 56
Top 3 picks for shorting
1. CHTR
2. JNPR
3. ALB
Get short.
divergence.. overbought stochastics

ALB Tech Analysis Prediction that if ALB beats the support line it will jump maybe 40 cents past that line, definetley selling there, if it doesnt then i will be selling around $106.40's. any suggestions for a good target on the sale price also any suggestions or analysis in general?

Time for this stock to give my portfolio a chargeBatteries Batteries Batteries thats about all you really need to understand

ALB breakout of established baseALB brokeout of its established base today on very large volume. Could this thing push all the way to fill the gap from January?

ALB Detected possible increase in guidance!!!ALB: albemarle corp
2018-08-07 16:15:28
Detected possible increase in guidance


Dow drops once again #25 (ALB)Technical Concept: Support broken becomes Resistance (Red Arrows= Resistance) (Blue Arrows= Support)
I not use sophisticated Technical jargon in an attempt to persuade and impress the reader because I not a Charlatan
I do not use fancy Charts plenty of Indicators, Oscillators, and other stuff, all in a stock chart in an attempt to impress
the reader with my knowledge because I not a Tutor or Mentor.
I am not either a Business man, Engineer, Doctor, Inventor or Innovator; this requires different skills and personalities
Who I am?
I am End of Day Analyst and Stock Picker, I support myself in Charts, but I not self-proclaimed Technical Analyst Expert
I do not fall into the mistake of comparing and affirm that Technical Analysis is better than Fundamental Analysis .
I am a person without Higher education, and not have math skills.
I am a right brain oriented person and I focus in my strengths, for this reason I use Charts and
I no try to become a Quantitative Trader, since it is a lost cause, in my case.
I dedicated 10 lonely years of deliberate practice and in this process, I eliminated all kind of thoughts.
I open and reset a lot of Demo Accounts for this purpose
I tried and practice with different Markets (Forex, Options and Stocks) with different Time Frames (Intraday, Scalping, Swing/Position).
I tried Mechanical Trading too, But definitely I am Discretionary Analyst or Qualitative, It took me years to know it, and a lot of books.
I've learned by myself, but I do not think I'm smarter than the others, “Ego is a sin”
What I do?
I pick Stocks manually I watch one by one without the use of a Stock Screener
I follow approximately 1300 to 1400 Stocks , with different market cap
I have no preference for a particular industry I follow 10 Industries even Public Utilities
I do not follow Penny Stocks and Over-The-Counter stocks
I not follow Stocks with an Avg_Volume bellow 100,000 with (Low Liquidity)
I use a simple method based in Support and Resistance , accompanied with moving averages, and I do a Top down Analysis with multiple time frames
My first view of a Stock is a 10 year Weekly Chart, Then I do a zoom in and I focus in the action of the last 2 or 4 Years, I look my Daily Chart and 4-Hrs Chart too
I understand the concept of Short Selling and spend hours searching this kind of patterns including the weekends.
What I can do for you?
I can put ideas in the desk of Professional Traders, the ideas are based in Price Patterns + Price Action,
and they can trade with your own system or set up
My ideas are not influenced by the media or my neighbors,
This was my Resume and Cover letter
Sincerely
Alex_Quiroga

Resistance found on 68.1 Fib RetracementResistance found on 68.1 Fib Retracement and end of 5 wave Elliott Impulse. ALB is off now to find a different trend and to test the %50 Fib Retracement bear resistance


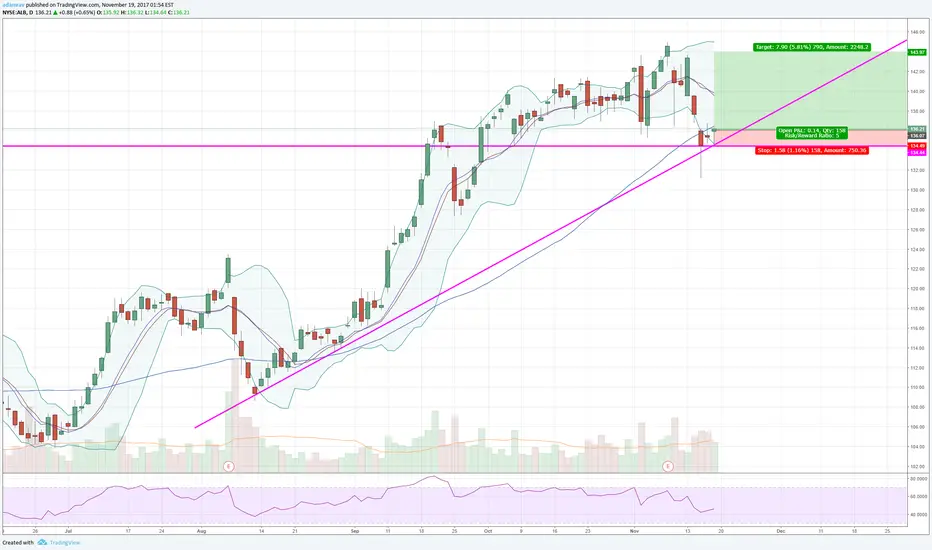
Oversold reversal. Large hammer indicating bottom is inEntry $136.10, Stop 134.49, Target 143.97 $ALB $LIT $TSLA $SQM
ALB: Albamarle Cup and Handle PatternAlbamarle seems to have formed a cup and handle pattern. Trading with a target of $147.43 upon break of $137.75. Both the RSI and MACD are stretched so I am suspecting that the move towards the target will be at a gradual pace I am keeping a tight stop at 133.90.
