Circle - Opportunity to Accumulate AheadI like to think this interesting stock is in its final Elliott Wave leg, which makes things pretty intriguing right now.
For me, this sets up an opportunity to start looking at accumulation heading into mid 4Q25.
Looking out for indiscriminate selling pressure around certain catalysts.
Key events to watch: the 3Q earnings release (likely mid-Oct to Nov 2025, though the date isn’t confirmed yet) and the standard 180-day IPO unlock. Based on the timeline, that could either hit right after earnings or on December 2, 2025, depending on when the restrictions technically roll off. There might also be a secondary unlock post-earnings, which adds another layer of potential supply.
From a technical standpoint, the upcoming increase in float means liquidity could flood the market. That usually opens the door to more downside pressure, which in this case could complete the final leg of the Elliott Wave correction. I’m eyeing the 90–100 range as a potential accumulation zone once the dust settles.
On the macro side, it’s hard to ignore the broader risk backdrop. Crypto is flashing some warning signs—BTC sitting around 112k while ETH is at 4.2k, and we just saw ETH break its support level right after the Fed’s rate cut. Feels very much like a “sell the news” setup, which makes me think we could be staring down the start of a crypto winter.
All in all, this stock remains fascinating, but timing will be key. Let’s see how it plays out once supply flows in and the final wave structure completes.
Stay sane out there, and may the odds be in your favor. Good luck.
A417ZL trade ideas

Analysis on circle using tpo and regular chart longs and shortMust watch video giving 2 really nice Risk reward entries on the Newley listed stock Circle
In this video I highlight a region using limited data of where to get filled if you missed the IPO and want to buy some circle .
We are currently in a no trade zone for buyers as I anticipate that price will gravitate down to the .786/.886 level over time .
In this video I also use the TPO chart "Time price opportunity" and demonstrate what i am looking for from using this type of chart to add to my confluences for a high probability trade .
Also identified in the chart is a short trade off of the weekly pivots and the value area high of the range .
Thankyou for watching and i welcome any questions

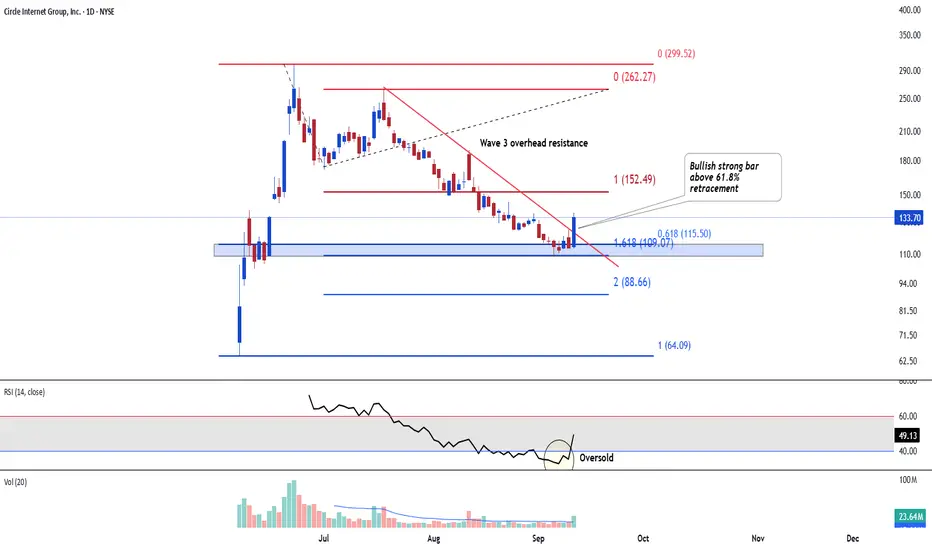
CRCL - Buying pressure is inNYSE:CRCL is looking at ending its bearish correction after a strong bullish rebound at 61.8% retracement level. RSI has confirmed its oversold signal. We are looking at a near-term target at 173.51 and 189
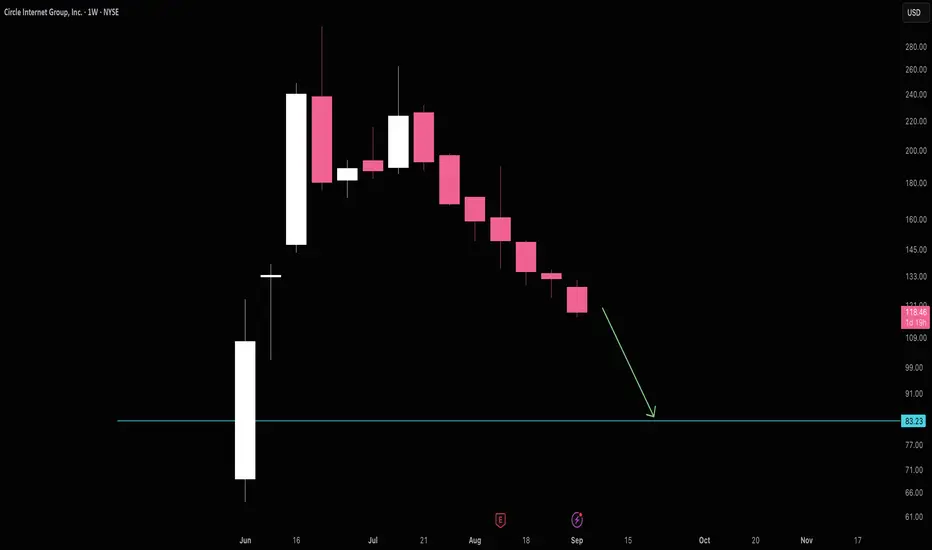
Circle appears to be heading to $83Circle seems to be in a steady decline towards $83. It's hard to say if it will hold there and find true support, but it's a good place to close shorts.
Good luck!
CRCL - Long Feels inevitable. Price consolidating in previous volume gap & price gap. Divergences on just about everything . Looking for pushes into the volume pockets above

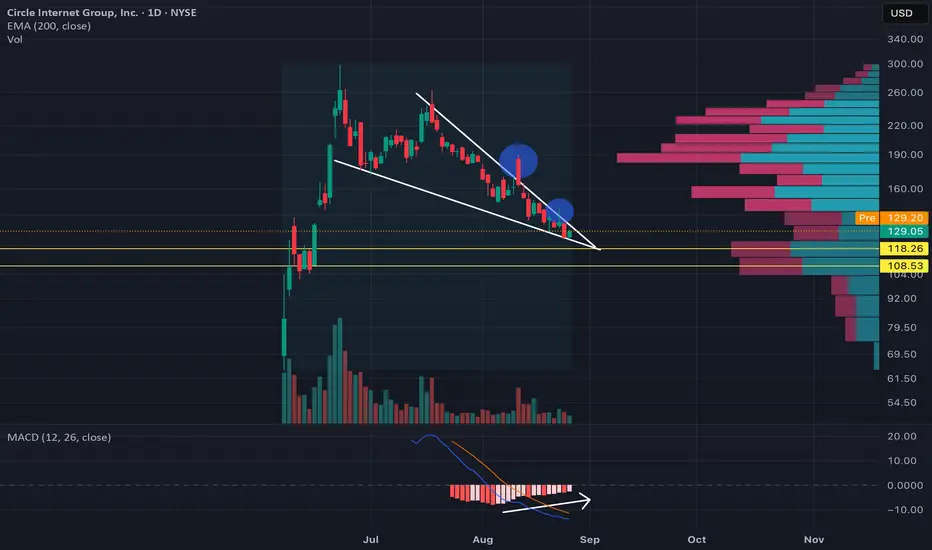
CRCL falling wedge breakout soon?We've seen two head fakes on this daily falling wedge so far, but looking at the MACD, we could see an actual reversal play out sometime over the next few weeks.
With the US passing positive stablecoin regulation, Circle looks well positioned (in my unprofessional opinion) to capitalize on this important policy change.
NFA, DYOR
You continue to ask "how did he know Circle would do that"?I keep stats on my predicitons and so should you. How else would you know who to follow?
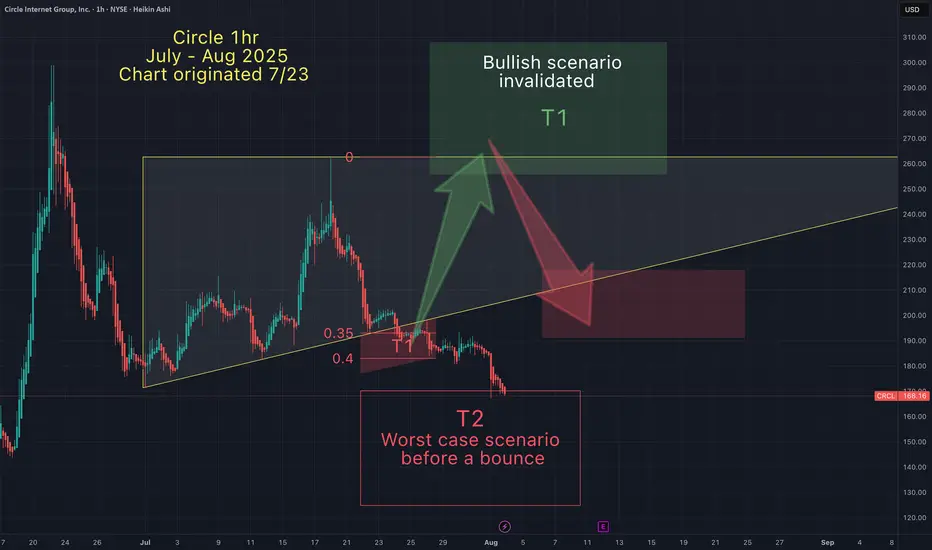
July 23rd- I suggested that Circle was approaching an inflection point at my bearish target T1.
Aug 2nd - The bullish scenanrio was quickly invalidated as Circle broke below my T1 red box & entered my bearish T2. At that point I suggested Circle would go lower before a bounce.
Aug 12th- Circle did drop lower into T2 as predicted, followed by my anticipated bounce (+25%)
Aug 12th I also wrote, "But is Circle going lower? If/when Circle breaks below this recent low I will post my T3 targets".
If you want me to post T3 targets leave a comment.
May the trends be with you.
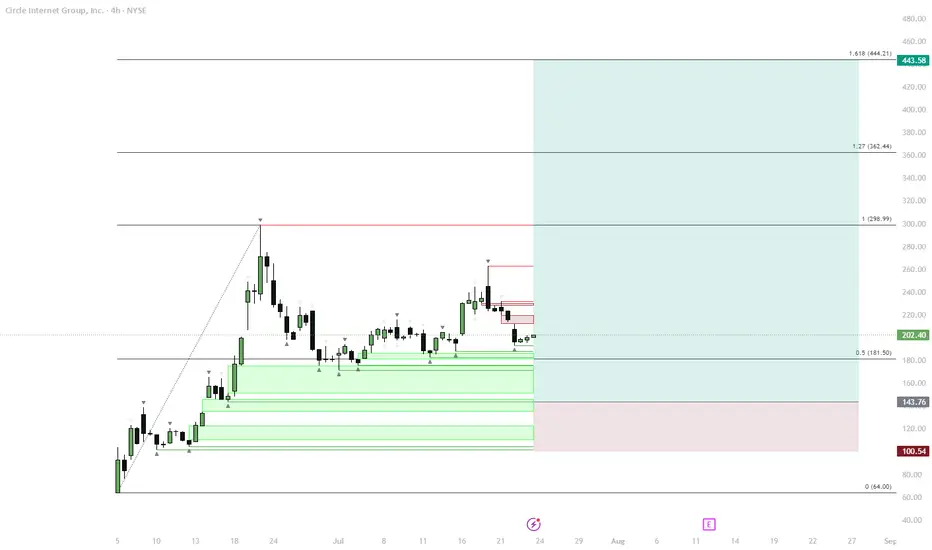
CRCL – Classic Crypto IPO Fractal in Play?Initial Pump:
Price launched rapidly after listing, forming a local high.
Sideways Phase:
Market settled into a sideways consolidation, typical after the first pump.
Retrace:
A retrace toward the 0.5 Fibonacci zone (~$181.50) is developing. Typical retracement in similar "crypto stonks" ranges from 60-80%.
Accumulation in Demand Zone:
Multiple support levels are stacked between $180–$140, indicating a strong demand zone for accumulation.
True Move Potential:
If the support holds, a new bullish leg could start, targeting Fibonacci extensions ($299, $362, $444). If the support is lost, the next levels are $143 and $100.
This scenario is based on the repeating behavioral fractal seen in high-profile crypto listings: explosive initial move, multi-week consolidation, and a deep retracement before the real trend emerges. Current price is entering the key demand area, which aligns with previous market structure seen on token launches. The risk/reward for new longs becomes attractive here if buyers defend the zone. However, invalidation is clear if price breaks below $140.
BASE??Based on tech, seems to have found a resilient floor at $150
It's gearing up to begin a new uptrend
I like this zone and I'm accumulating

Circle buying opportunity. Bullish chartWith the announcement of the new stock release, more selling should come. I see limit entries of 139 and 144 to be ideal. Overall pattern is 4th wave correction IMO. Target at least double top in short term and much higher long term. People smarter than me would put stop losses under those targets, but I'm a degen. Any accumulation in the green box should be good.

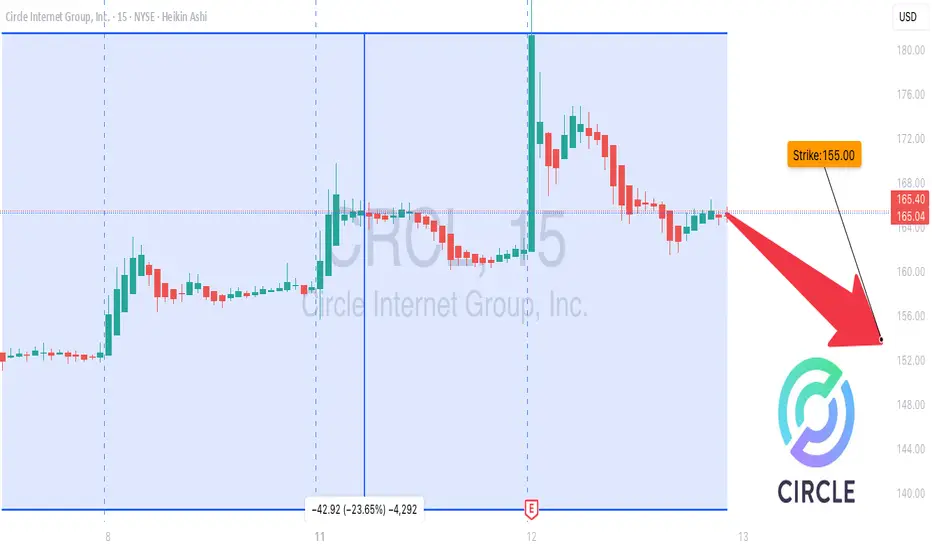
CRCL on the Edge: Bearish Play Loading… 📉 CRCL Weekly Options Alert (Aug 12, 2025)**
**Bias:** ⚠ **Neutral → Bearish** — Weak volume + bearish weekly RSI
📊 **Quick Stats:**
* **Daily RSI:** 40.8 ↗ (bullish divergence from oversold)
* **Weekly RSI:** 58.7 ↘ (bearish drift)
* **Options Flow:** Call/Put = **1.19** → neutral
* **Volume:** 1.0× last week — no institutional conviction
* **Gamma Risk:** Moderate — 3 DTE & rising time decay
💡 **Consensus Take:**
* Lack of strong buying pressure + bearish weekly trend = higher downside risk short term.
**Trade Idea:**
* **Type:** Naked PUT
* **Strike:** \$155.00
* **Expiry:** Aug 15, 2025
* **Entry:** \$6.22
* **PT:** \$10.90 (+75%)
* **SL:** \$2.80
* **Confidence:** 68%
* **Entry Timing:** Open
⚠ **Risks:**
* Earnings news could swing price violently
* Daily RSI divergence could spark short-term bounces against your position
---
**📈 TL;DR:**
Weekly trend still weak, volume flat, options flow balanced → bearish skew.
\#CRCL #OptionsTrading #WeeklyOptions #PutOptions #OptionsFlow #StockMarket #TradingSetup #BearishTrade #TechnicalAnalysis #OptionsAlert
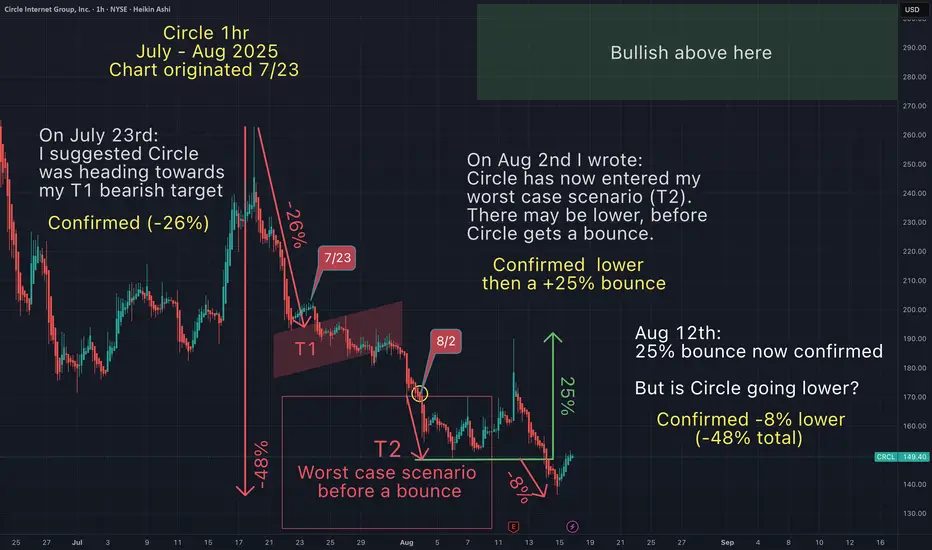
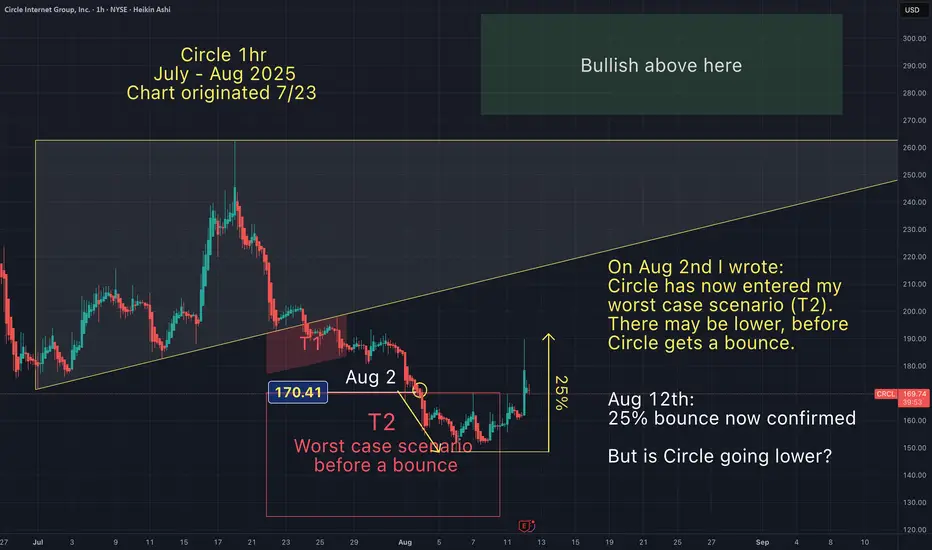
Circle hit my T2 & bounced as expected. But is it going lower?Target and bounce confirmed. On Aug 2nd I wrote: "Circle has now entered my worst case scenario (T2). There may be lower, before Circle gets a bounce" (see Aug 2nd chart below).
As of today, Aug 12th:
Target 2 (red T2 box) hit lower as anticipated
25% bounce from mt T2 target, now confirmed. TA works again!
But is Circle going lower? If/when Circle breaks below this recent low I will post my T3 targets.
May the trends be with you.
Clear short on CRCLCircle was 100% overvalued, a few people in one of my groups have been buying puts, so I decided to look at the chart. I believe we close this gap to the downside around 130$. The daily wedge is broken. Do remember, almost all of their revenue comes from issued bonds that are backed by the USDC. This caps their margins, since we only have about 60 Billion in USDC you can easily do the math, and this is before interest rates continue to drop, looks tremendously overvalued to me. Volume is dropping steadily.

Circle - My Target 2 Hit. Worst case scenario has come true.After a 43% dump, Circle has now enterd my worst case scenario (T2).
There may be lower, before Circle gets a bounce.
-May the trends be with you.
CIRCLE Stablecoin Revolution Circle is more than a crypto firm—it’s building infrastructure for a regulated digital dollar economy. With transparent reserves, global licenses, deep financial integrations, and robust blockchain functionality, USDC is rapidly positioning itself as a cornerstone of future finance.
I see a longer term potential for a great investment opportunity given the coming banking revolution involving stable coins.
For a lower risk entry, after a nearly 40% decrease in less than a week, the stock price is currently supported at the VWAP from the original IPO release.
Should the trend continue higher, I would prefer to see a bounce here on the stock.

CRCL WEEKLY TRADE SIGNAL (JULY 31)
### 🚨 CRCL WEEKLY TRADE SIGNAL (JULY 31) 🚨
**Call Option Setup – Based on Multi-Model Consensus**
📈 **Momentum**:
🟡 RSI Daily: 46.7 (Neutral)
🟥 Volume: 0.4x last week = 🚨 Weak participation
🟢 Options Flow: Bullish (C/P Ratio = 1.42)
🌤️ VIX: Low (15.4) → Low volatility = 💰 opportunity
🔍 **Model Summary**:
✅ **Grok**: Bullish setup → RECOMMENDED TRADE
❌ Claude, DeepSeek, Gemini, Llama: No trade (weak volume + gamma risk)
🤝 ALL agree: Weak volume & mixed trend = caution
---
### 💥 Trade Setup 💥
🎯 **Direction**: CALL (Bullish bias)
💸 **Strike**: \$200
💰 **Entry**: \$0.85
📆 **Expiry**: Aug 1 (1DTE – high gamma 🔥)
🎯 **Profit Target**: \$1.11
🛑 **Stop Loss**: \$0.51
📊 **Confidence Level**: 65%
📍 **Entry Timing**: Market Open
---
### 🧠 Key Insight
📉 Weak volume = 🚫 no institutional conviction
📈 Bullish options flow = 🔥 potential short squeeze
🕓 Time-sensitive 1DTE = Fast hands needed!
---
👉 If you trade momentum, watch CRCL at open.
🧠 **Strategy**: scalp the move or exit near \$1.11
💥 High risk, high gamma, tight leash.
\#OptionsFlow #CRCL #CallOption #TradingSignal #UnusualOptionsActivity #0DTE #GammaScalp #TradingView #SwingTrade #TFlow

What goes around comes full CRCLFor the record, I bought in at ~$220 and looking to exit to ethical reasons. I believe that this stock will reach over $400USD for the end of the year but with every l opportunity left off for a greater cause, there will always be a greater reward.
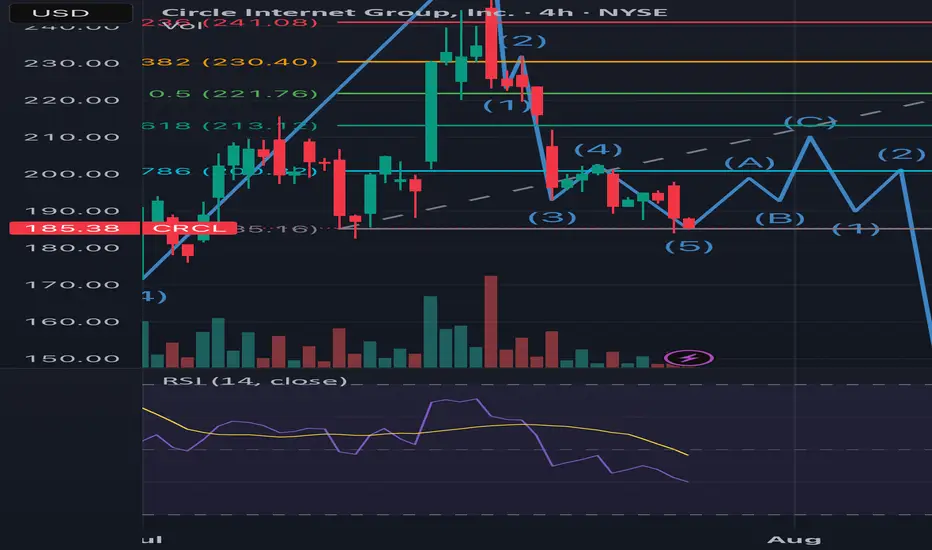
1. Notice the end of the first 5 wave Elliot Impulse coincides with the passing of the GENIUS bill. Wave 3 peak was the ATH and wave 5 was the Friday peak of around $262.
2. We’ve entered the correction where sellers are looking to close from the hype
Wave 1 of the correction was the sell off from the wave 5 peak.
From the chart you can see the 3 wave correction is beginning with wave 1 of the 3 coming to an end.
Good news if you want to swing it to 213, this would be a good entry. Bad news if you want ito t hold it for ATH as it means you’d have to bear the third wave of the correction phase (gap fill ~$216), from there I’m expecting the huge sell off post earnings and FED expectations.
However, after retracing a new cycle will emerge led by major catalysts like the CLARITY Bill, CIRCLE’s bank charter application, USDT diminishing presence in the US and the adoption of USDC even possibly making it the standard stablecoin for all US crypto activity, DE-Fi growth and tradfi participation and growth in their MMF and remittance segments. This will kick start a new run where the highs of $400 will be achieved.
So target next high (earnings time) is $213. I assume price will not go below this region. But a recommended sell until q4
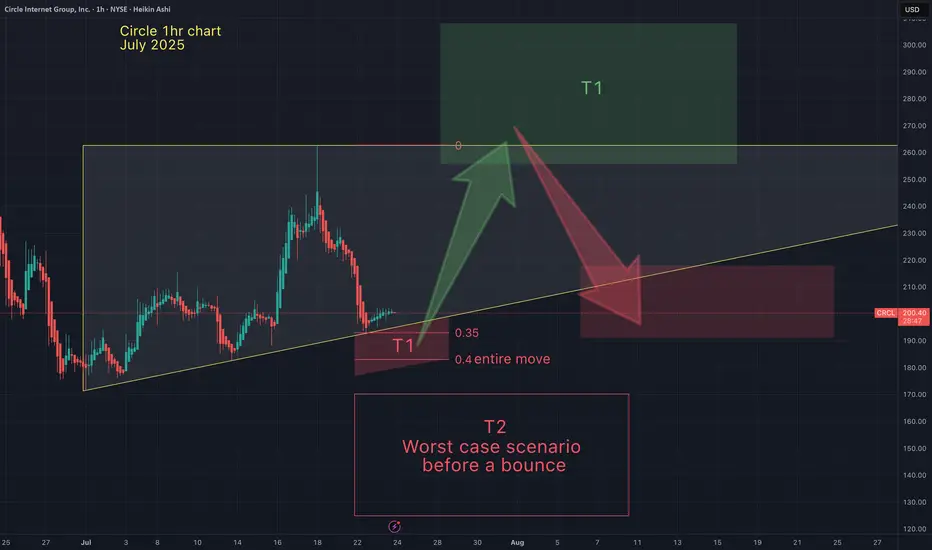
Circle - next targetsIn a bull market the average retrace
is between .2 -.4 Fib from the bottom
of that run.
Several factors of confluence lead me
to believe Circle will hit my red T1 target,
bounce to the top of the triangle (green T1)
then drop to my next red target (or lower).
Then return back to my green T1.
There may be one more retracement after that. Then
Circle may break through the green bar to the upside.
I believe stable coins are the wave of the future.
So I want to be a part of Circle's USDC
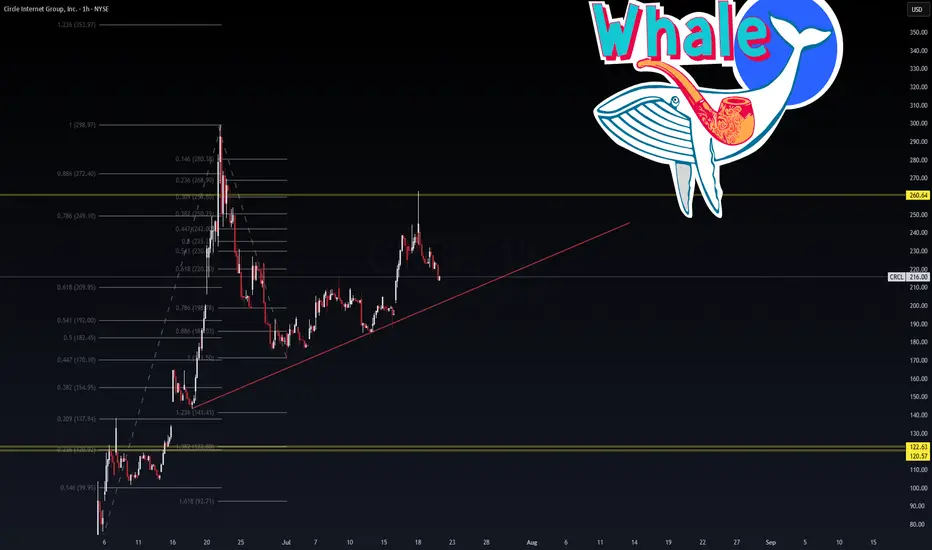
CRCL – Whale Watching Zone Activated🐋 CRCL – Whale Watching Zone Activated
Timeframe: 1H
Posted by: WaverVanir International LLC | VolanX Protocol
Status: Trendline Support Test
🎯 Key Fibonacci Zones Mapped
Circle Internet Group (CRCL) is holding a major ascending trendline, anchored from the July 8 pivot low. We’re monitoring the consolidation above $209–216 as whales defend key volume zones.
🔹 Upside Confluence:
0.786 fib = $249.10
Major liquidity level = $260.64
Extended target = 1.236 = $353.97 (high risk-reward whale zone)
🔻 Downside Triggers:
Trendline failure opens downside flush to $170.10 then $122.63
Strong defense expected at Fib golden pocket (0.618 at $209.95)
📊 VolanX Signal:
Market structure remains intact unless we break below $208 with volume. Any sweep of trendline + reclaim would activate a VolanX Bull Trap Reversal Play with whale targeting in the $260s.
🧠 Strategic Insight:
This chart screams accumulation to reprice, but a sudden liquidation flush is not off the table. Scaling into volatility with defined risk is key.
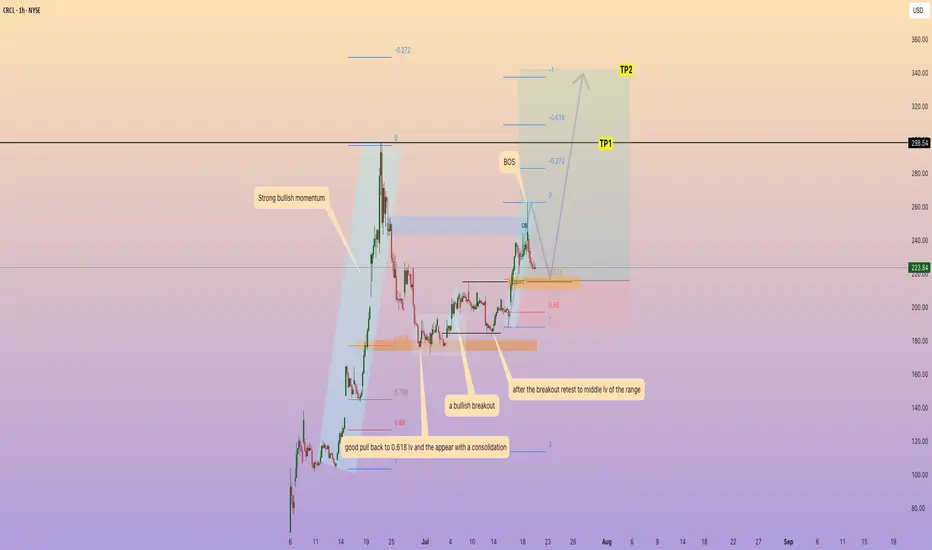
CRCL good pull back and prepare for a new Higher high1. Strong bullish momentum from $104 to $298
2. good pull back to 0.618 lv and the appear with a consolidation
3. a bullish breakout
4. after the breakout retest to middle lv of the range
5. another strong bullish momentum appear from $189 to $262
good setup at $216 is the lv of resistance-support + 0.618 pull back
CRCL Right-side base forming post-IPO. Volume supporting accumCRCL – Circle Internet Financial (IPO)
Setup Grade: A
• Entry: $235.84 (7/17)
• Status: Active
• Trailing Stop: $183.85 (2x ATR)
• Setup: Right-side base forming post-IPO. Volume supporting right-side structure. Higher high after higher low. Sector: blockchain/stablecoins.
• Plan: Add on breakout over ATH $98.99. Hold with strict trailing stop discipline.

Why Circle Internet Group (CRCL) Could Reverse Course and Target
After a period of extreme volatility and sharp corrections, Circle Internet Group (NYSE: CRCL) is showing technical and fundamental signs that a reversal toward $240 is plausible. Here’s why investors and traders should watch for a potential rebound:
1. Strong Underlying Growth Drivers Remain Intact
Despite recent profit-taking, the core business fundamentals that fueled CRCL’s parabolic rise remain robust. Circle operates the world’s second-largest stablecoin (USDC), with over $60 billion in circulation and a dominant position in blockchain-based financial infrastructure. Its revenue model—primarily interest income from USDC reserves—remains highly lucrative in the current high-rate environment, and the company continues to expand its enterprise API and non-stablecoin revenue streams.
2. Technical Support and High-Volume Reversal Zone
The latest chart action shows that after a steep sell-off from highs near $299, CRCL found strong support in the $175–$185 range, coinciding with key moving averages and previous breakout levels. The stock has since stabilized and begun consolidating above these supports, with buyers stepping in on high volume—often a precursor to a reversal, especially after such a rapid drawdown.
3. Analyst Sentiment and Price Targets
Despite recent volatility, analyst consensus remains bullish. The average 12-month price target is in the $183–$230 range, with several analysts highlighting the potential for further upside if Circle continues to scale USDC and diversify revenue. The recent correction may have reset overbought technicals, giving the stock room to run if sentiment improves.
4. IPO Volatility and Mean Reversion
CRCL’s post-IPO performance has been extraordinary, with the stock surging nearly 750% since its debut at $31 per share. Such explosive moves are often followed by sharp corrections as early investors take profits. However, historical IPO data suggests that high-growth tech stocks frequently experience a mean-reverting bounce after initial corrections, especially when underlying fundamentals remain strong and speculative excess is flushed out.
5. Macro and Industry Tailwinds
Circle’s leadership in the stablecoin market positions it at the heart of the rapidly growing digital finance sector. As regulatory clarity improves and institutional adoption of blockchain accelerates, Circle stands to benefit from increased transaction volumes and new use cases, supporting a higher valuation over time.
Conclusion: The Path to $240
With technical support established, bullish analyst sentiment, and powerful industry tailwinds, CRCL is well-positioned for a reversal. If the stock can maintain support above the $180 level and regain momentum, a move back to the $240 zone—a key psychological and technical level from its recent trading history—is well within reach. Investors should watch for confirmation via increased volume and a break above short-term resistance to validate the reversal thesis.

Quick View: $CRCLOn the hourly chart there is a huge compression area with decreasing volume. It should be bullish, but is hard to say as data are so few.
Ready to catch the action higher.
