HINDA trade ideas
HINDALCO LONG INTRADAY 6 APR,2021Dear trader,
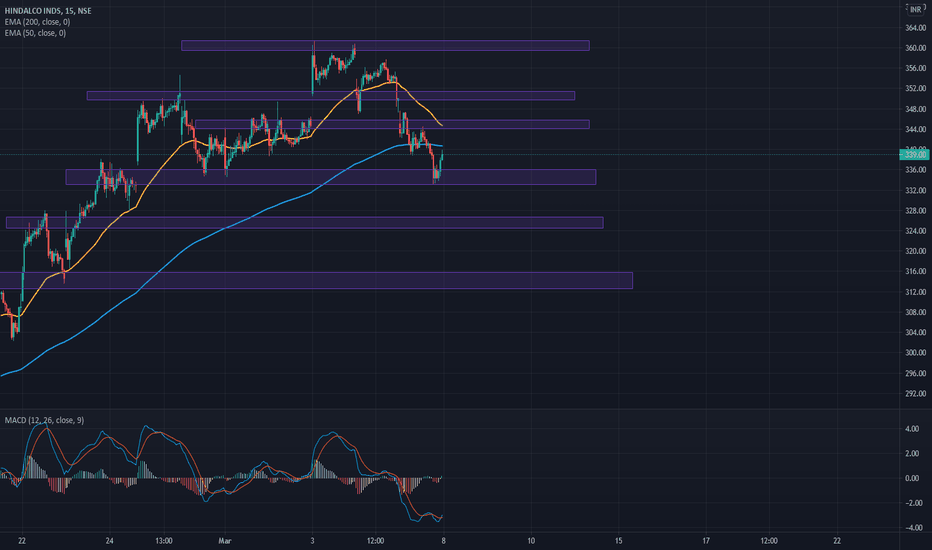
If u look at the chart of HINDALCO (analysis based intraday only) the HINDALCO support at 351 and Target at 358 and Stop loss at 346.
The chart clearly indicates Bullish Trend you can also see the candle stick patters for more indepth analysis.
In Intraday most important thing is to enter and exit points.
Our signals are based on analytics, algorithms, mathematical derivatives.
Always be a responsible trader, kindly trade only when you have maximum opportunity in the market with minimum risk and with keynotes like data, analysis and proper strategies.
Kindly message us for strategies and analysis.
Hindalco -- Flag pattern. Hindalco has a flag pattern in its daily time frame chart.
Entry -- wait for the price to break the upper flag trendline or close above it to avoid any false signals.
Stop loss - SL should be the price at the bottom flag trendline.
Target -- the flag pole is of 135 points. To be conservative -- always use a trailing SL to avoid losing on profits.
Hindalco - Intraday Trade SetupHindalco CMP - 326.40
Looking bearish in higher time frame. One can go for Intraday Trade Setup with the following entry, exit & targets.
*Sell* At or Below 324.50 / Stop Loss 331
Target 1 - 321
Target 2 - 318
Target 3 - 315 / 310
Disclaimer: This is my view and for educational purpose only.
HINDALCO - Short setup Stock is currently trading in third stage of market cycle .
1-Accumulation 2-Rally 3-Distribution 4-Rejection
currently at the peak , at the overbought zone. Has formed a broadening pattern on the top which is rejected by a overhead trendline.
RSI DIVERGENCE
Looking to short once the Chart pattern is broken and retested .


