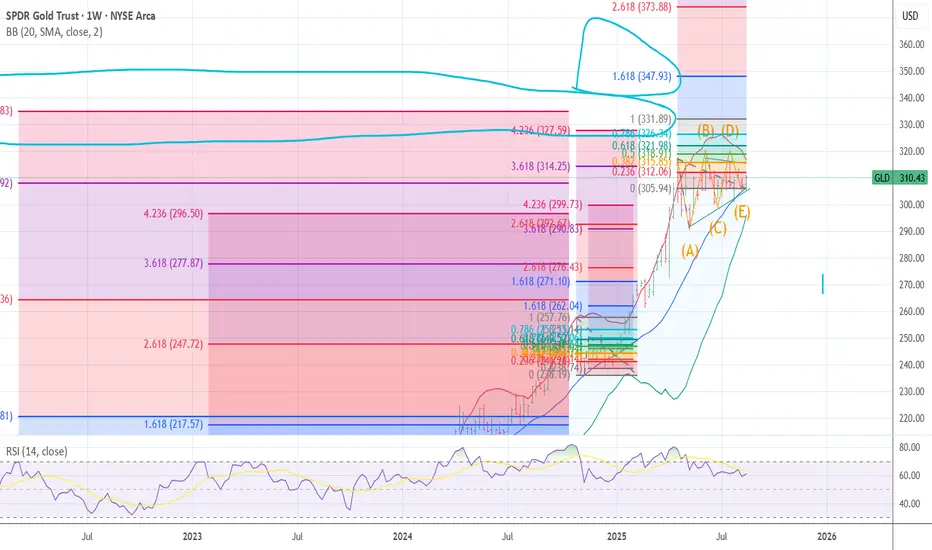
GLD wave 4 target 318-320 waves are why RN Elliott predicted a 71+ bulll run in 1941, GLD will in fact go higher but like a long distance runner price has to rest and that's what the wave 4 pull back is all about, than we march higher in wave 5
GLD trade ideas

GLD wave 4 target 318-320 typical momentum divergence between waves 4 and 5 (lower degree right now), wave 4 (higher degree) target 318-320

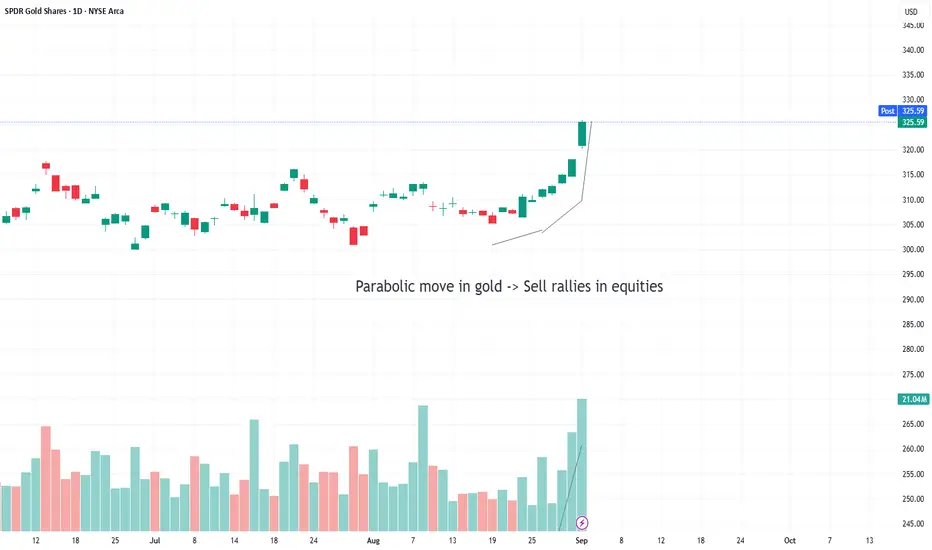
Gold's parabolic move represents fear Until the parabolic Gold rally dies, you must sell any rallies in equities, QQQ or SPY, etc.
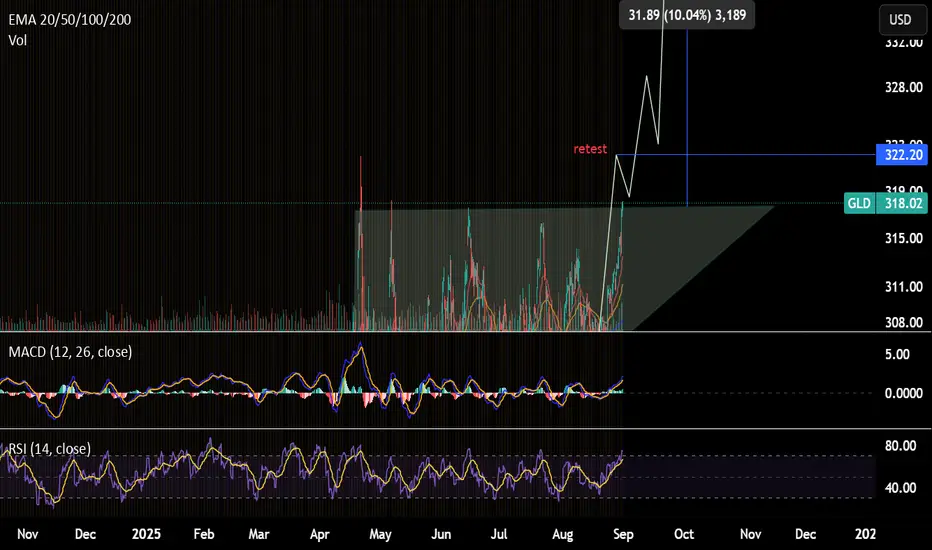
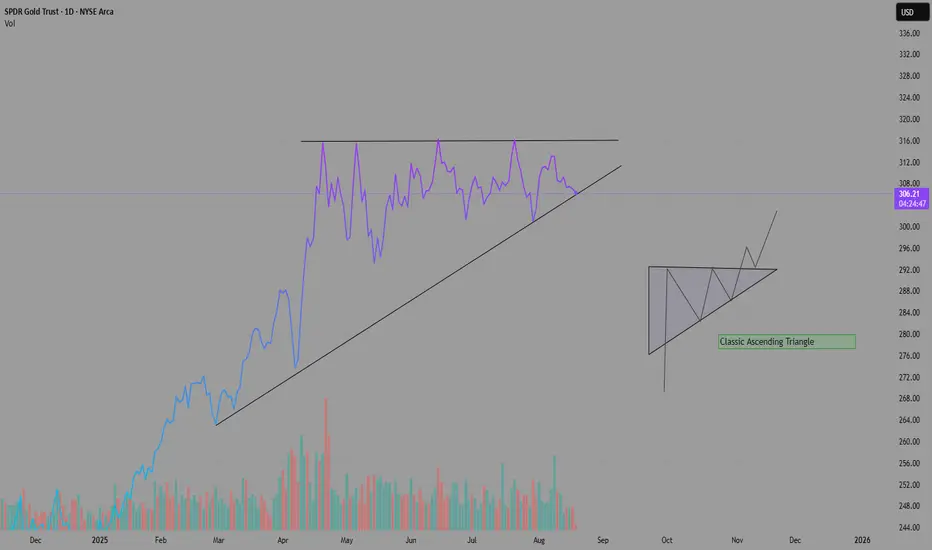
GLD - CALL4hr chart pattern: ascending triangle
Resistance: 321.99 -> need to break & close above 322.2 to confirm bullish breakout. A retest to the equal high at $317 ish might happen after reaching this resistance. Still a good call play from 318 to 321.9
Ultimate price target : $349.2
Stoploss: $304.9
*** Stoploss (for option): Just in case if it is still consolidating in the triangle, stop loss at $313, monitor price movement and re-entry when it reacts at $305.2
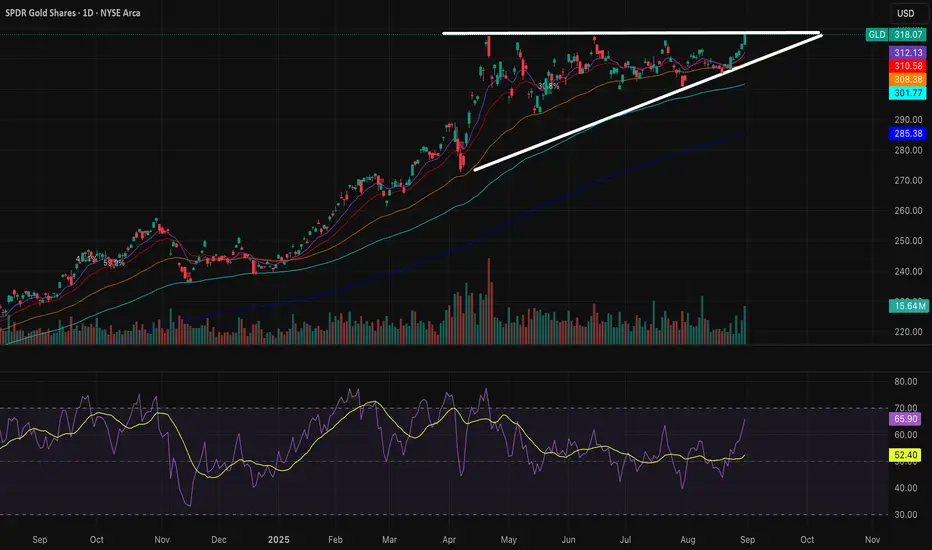
GLD Ascending TriangleGLD has clear resistance in the 318 area but has been trading tighter and tighter up towards it over the last couple months. September is generally the month for a market pullback if you look at seasonality trends, and GLD often (but not always ofc) inverses the rest of the market, and after today's strong close, I think its worth watching as the market may pullback even more in September. Additionally I saw about 28 million in 320 9/19 calls for GLD, so the flow is leaning bullish. NFA
GOLD WAVE 5 is setup 4wave has ended ! look for the blowoff wave in 5th targets are posted best of trades Wavetimer

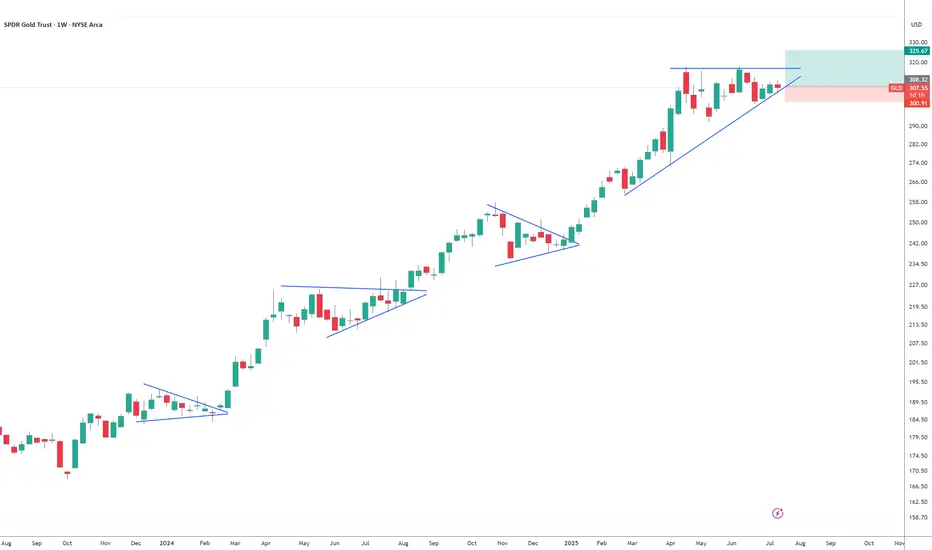
Possible Bullish Pattern For SPDR GOLD TRUSTLooks like an ascending triangle pattern is forming for this stock. Would be a textbook buy opportunity after breakout and Retest
This is not Financial Advice. Please DYOR
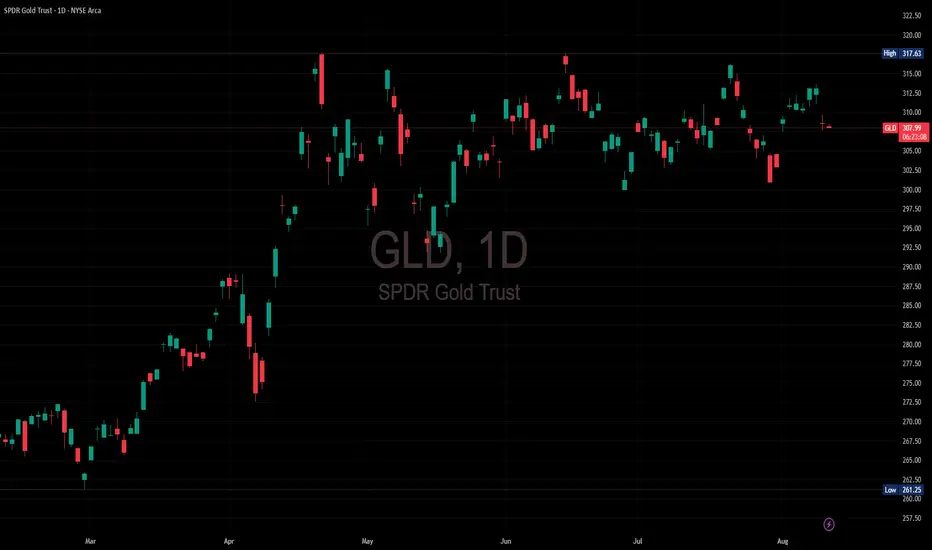
GLD - AUG 2025SPDR Gold Trust ( AMEX:GLD ) continues consolidating under heavy supply after $4.5B sold near 320. Price is defending daily support at 304, but momentum remains fragile. A sustained break above 320 would open the path to 330, while losing 304 risks a drop toward the 285 support zone.
Upside target: 330
Downside target: 285
#GLD #globaltrade #investment #investing #stockmarket #wealth #realestate #markets #economy #finance #money #forex #trading #price #business #currency #blockchain #crypto #cryptocurrency #airdrop #btc #ethereum #ico #altcoin #cryptonews #Bitcoin #ipo

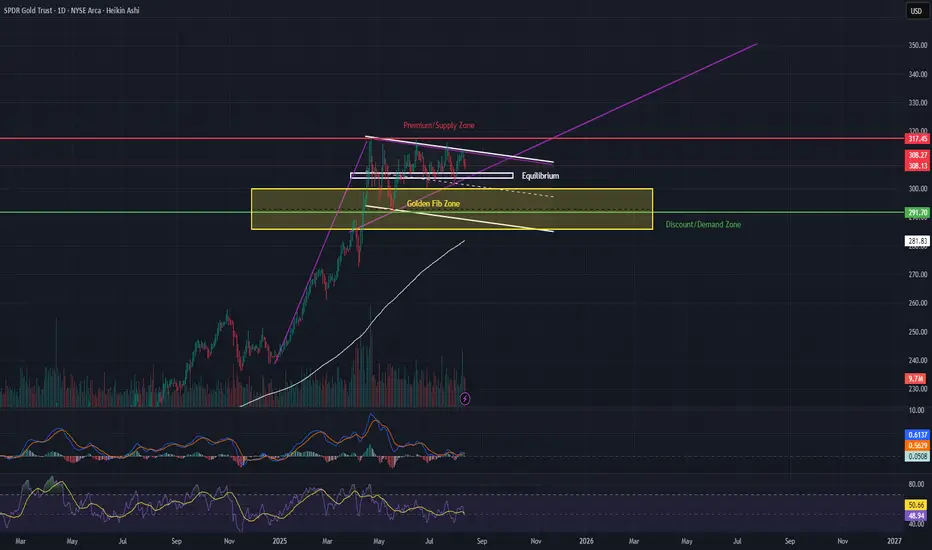
GLD | Bullish Pennant Near All-Time High — Key Levels to Watch GLD is consolidating within a bullish pennant after its March–April rally, trading near the equilibrium zone (305–307). Price action is tightening, and we’re nearing the apex — meaning a breakout is likely soon.
📈 Bullish Scenario – Bullish Pennant Breakout
Pattern: Bullish pennant, flagpole measured move targets 330–335.
Bullish Entry: On a confirmed daily close above 312–314 with increasing volume.
Take Profits:
1️⃣ TP1: 320 (psychological + resistance)
2️⃣ TP2: 330–335 (measured move target)
Stop Loss: Below 305 (under equilibrium) or conservative SL at 302 (below pennant support).
Why: Holding above equilibrium while contracting in price signals accumulation; breakout could mirror prior leg higher.
📉 Bearish Scenario – Pennant Failure
Bearish Entry: On a daily close below 302–300 with strong sell volume.
Take Profits:
1️⃣ TP1: 292–294 (mid-range)
2️⃣ TP2: 285–290 (discount/demand zone & near 200 EMA)
Stop Loss: Above 307–308 (back inside pennant).
Why: A breakdown here invalidates the bullish pennant and targets deeper retracement toward key support.
💡 Options Trade Ideas
(For traders looking to position with defined risk)
Bullish Breakout Play
Strategy: Buy GLD Calls 4–6 weeks out from breakout confirmation.
Strike: ATM or slightly OTM (e.g., 315C).
Trigger: Break and close above 312–314.
Target Exit: Scale out at 320 and 330–335.
Risk Management: Stop if GLD closes below 305 after breakout.
Bearish Breakdown Play
Strategy: Buy GLD Puts 4–6 weeks out from breakdown confirmation.
Strike: ATM or slightly OTM (e.g., 300P).
Trigger: Break and close below 302–300.
Target Exit: Scale out at 292–294 and 285–290.
Risk Management: Stop if GLD closes above 307 after breakdown.
✨ Golden Fib Zone (Key Confluence Support)
This zone (highlighted in yellow) represents the 61.8% Fibonacci retracement of the March–April rally.
It overlaps with the discount zone and sits just above the discount/demand zone (285–290), making it a high-probability buy area if price pulls back here.
Historically, the Golden Fib acts as a strong reversal area in trending markets, especially when combined with structural support and the 200 EMA.
A bounce from this zone would keep the bullish pennant valid and could serve as a low-risk long entry for swing traders targeting the 320+ zone.
🔍 Key Levels to Watch
Upside: 312.5 → 320 → 330–335
Downside: 305 → 302 → 285–290
⏳ Summary:
GLD is in a pivotal coiling phase. The Golden Fib Zone adds strong confluence for buyers if we see a retracement, while an upside breakout from the pennant could trigger the next leg higher. Either way, this setup is primed for a high-volatility move — be ready for both scenarios.
Spying on Your Trading FutureIn my past posts, we’ve explored a different way of looking at trading — one that’s less about “being right” on every trade and more about seeing the bigger picture.
We talked about expected value as the trader’s true “laser vision” — the ability to project the future of your account rather than the price of a single asset. We also saw how looking at results in blocks, rather than one trade at a time, helps remove the emotional weight that comes from obsessing over each outcome.
Now, we’re ready to take this one step further.
It’s one thing to calculate an average from past trades — it’s another to use that number to imagine and measure the possible futures of your system. This is where probability and a few simple tools can turn a set of trading rules into a system you can test, stress, and trust.
Over the next two posts, we’ll keep things intuitive, but we’ll open the toolbox a bit wider: First, we’ll talk about expectancy in action: how the average result grows more reliable over time, and how Monte Carlo simulations can show us the range of possible equity paths — including the unlucky ones.
Then, we’ll look at risk management as the engine that makes expectancy work in real life. We’ll explore how much to risk per trade, why betting more isn’t always better, and how to find the sweet spot between growth and survival.
Think of this as moving from reading a map to running real simulations of the journey ahead. You’ll see your trading system not as a mystery box but as a process you can measure, adjust, and manage — all without turning into a mathematician overnight.
I promise you that in the next two posts, I’m going to turn these technical ideas into practical, actionable lessons. You’ll see exactly how to apply them to your own trading — and once you do, you’ll never look at a trading system the same way again.
And of course, I’ll share the visual examples and a downloadable Python notebook so you can experiment with your own data.
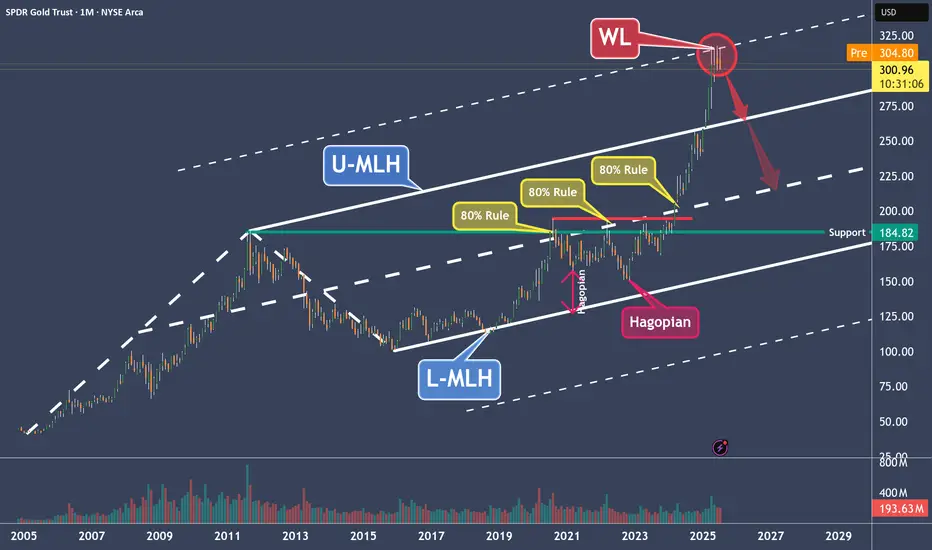
GLD – Why Gold Is a Clear Short to MePrice moved from the Lower Median Line (L-MLH) up to the Centerline, fulfilling the 80% rule.
Then we had two Hagopians, which sent price right back to the Centerline.
After the breakout above the Centerline, the next target was the Upper Median Line Parallel (U-MLH), which was reached rather quickly.
Finally, price broke above the U-MLH and was pulled up toward the Warning Line (WL).
Is this the end of the happy story?
I think so—because Gold has now reached its 2nd standard deviation, and there’s probably no more gas left in the tank.
The Trade:
- A logical target is the U-MLH.
- A secondary target is the Centerline.
At the very least, if you're long, this might be a good time to take some profits—because no tree grows to the moon.
For further details, I will follow-up with a Video explanation - See my Signature.
$GLD short term top in $260-148 target on the downsideAMEX:GLD looks a bit extended here. I could see the possibility of GLD falling back to the $260 support at a minimum and maximum all the way down to $148
The $209 support would be the 50% retracement of the recent run. I like that as a level for a bounce.
Let's see where we end up.

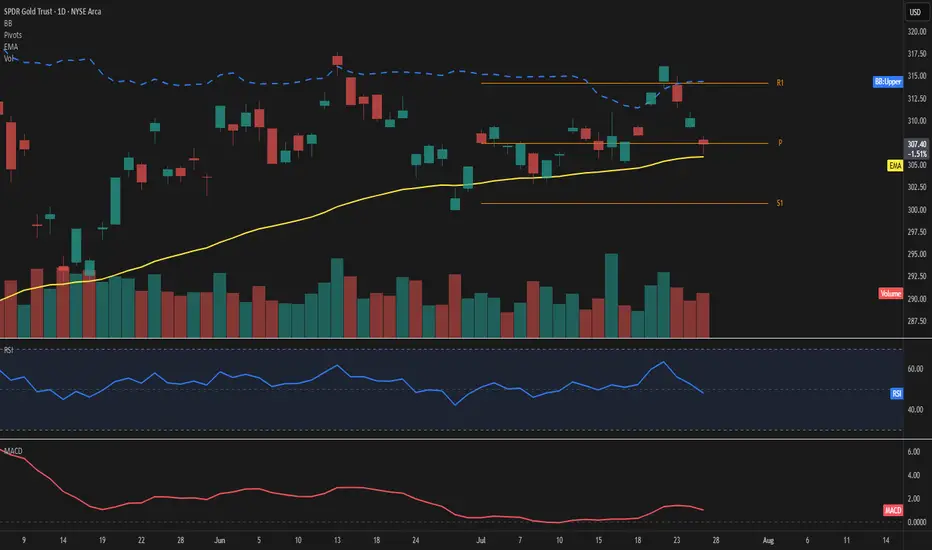
GLD – Price consolidates at highsPrice is hovering just above the 50-day EMA at 307, showing signs of short-term hesitation near the Fibonacci pivot. The upper Bollinger Band sits at 314, leaving moderate room for expansion if momentum picks up.
The RSI reads 48, reflecting a balanced setup without clear directional bias. MACD remains slightly positive, suggesting a still-constructive but soft momentum.
Key levels to watch include the pivot at 307 and the support at 301. On the upside, the 314 area aligns with both R1 and the upper band, acting as the next challenge.
Volume is up sharply (+22%) despite a mild -0.9% price pullback, indicating possible accumulation beneath the surface.
As long as price holds above the 50-day EMA, the structure remains intact.
A move away from the pivot zone will likely define the next directional wave.
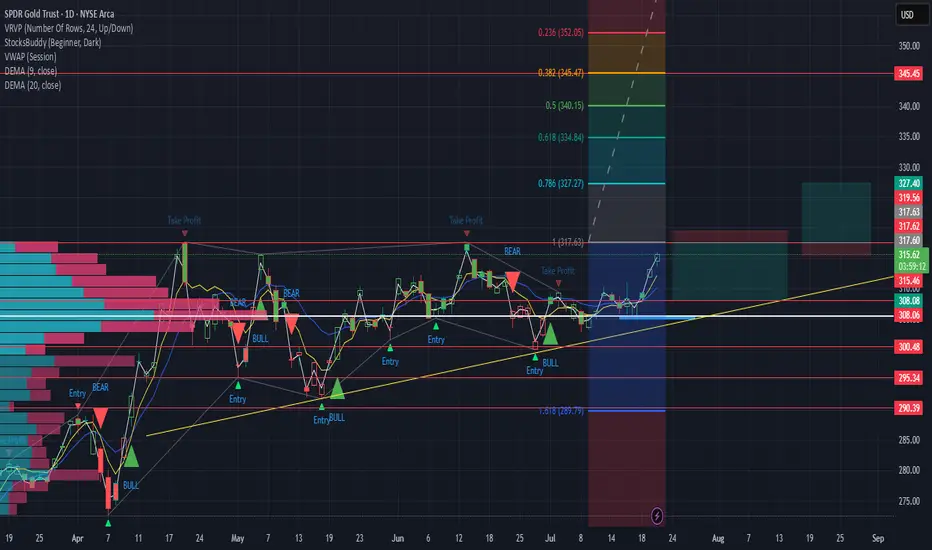
GLD up or down plan OK, tell me if this makes sense. if it rejects off of the 317.60ish area i would trade back to the down side to $308.10 ish - 4.80 R/R. If it breaks out and retests I would be trading to 327 area. 4.5 R/R - Let me know what you see and your thoughts. i'll try to share what i did.
Gold!!!!!Looks like GLD is setting up for a big move to the upside. It likes to consolidate for a few weeks before a massive breakout. I have some GLD calls strike 310 for September 19. My SL triggers if a weekly candle closes under trendline. TP 325 ish.
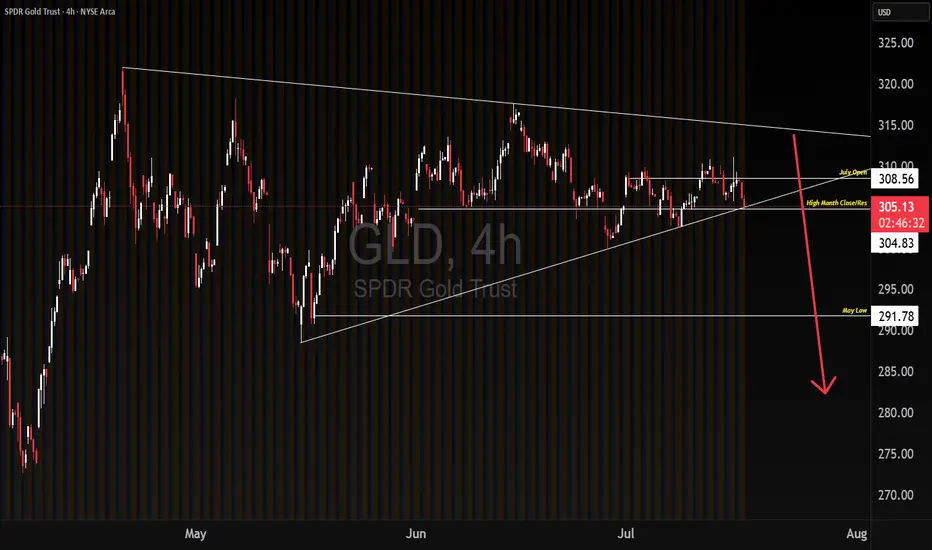
GLD potential break downWe could be experiencing a break down on GLD based on capital outflows, going into riskier markets. If this larger time frame range break down holds, and we get continuation lower on downside momentum, we get a measured move target of May's low. Will be watching to see if the breakdown is a bear trap first. If it is not a bear trap, I will buy OTM Jan 26 puts. Targeting May's low
Short Goldbeen entering puts every time gold surges on any War headlines. it's getting sold into by smart money. it's been successful three to four times in a row. I currently have 11 open puts for the $300 strike expiring August 15th. I picked them up when we were pushing high 309 on Wednesday. high potential to be in the money if we continue to slide. all of the worst doom war news still couldn't get this thing higher, we are going down.

Fear and greed vs SPYWhen VIX crosses over SPY rapidly, it’s usually a reliable sell signal. USD and GLD added for additional fear signals as well as inflation measures.
VIX falling to baseline and SVIX returning to previous value indicates regained stability or growth for SPY (entry point)

Have you noticed Gold and Silver Miners lately?No doubt you are aware of the serious run Gold made so far in 2025, and you might also be aware that Silver is catching up fast lately. But have you thought to take a look at Gold and Silver mining stocks and the ETFs that track them? As Robin might have said (but never did), "Holy prospectors Batman, these stocks are flying higher!"
It is a real question whether this trend will continue, but if it does, GDX/J SIL/J are the ETFs to watch.

GLD Weekly Trade Setup — June 16, 2025🪙 GLD Weekly Trade Setup — June 16, 2025
🎯 Instrument: GLD (SPDR Gold Shares)
📉 Strategy: Short Bias via Puts
📅 Entry Timing: Market Open
📈 Confidence Level: 65%
🧠 Technical & Sentiment Snapshot
Current Price: $311.78
5-Min Chart: Below EMAs (10/50/200); RSI ≈ 34 → short-term oversold
Daily Chart: Above 10EMA ($309.94), RSI ≈ 56 → neutral-to-bullish
Bollinger Bands: Near lower band on M5 → volatility likely
Support/Resistance:
• Support: $311.68 / $307.28
• Resistance: $312.20 / $313.00
🗞️ Market Sentiment Overview
VIX: Elevated at 20.82 → high risk premium environment
Options Flow: Heavily put-weighted near $305–$310 strikes
Max Pain: $285 → bearish options bias into expiration
News: Geopolitical tensions increase flight-to-safety temporarily, but fading momentum fuels retrace setups
🔽 Recommended Trade: GLD PUT
Parameter Value
🎯 Strike $307.00
💵 Entry Price $0.84
🎯 Profit Target $1.25–$1.70
🛑 Stop Loss $0.50
📅 Expiry June 20, 2025
📏 Size 1 contract
⚖️ Confidence 65%
🧷 Trade Plan
📥 Entry: At market open
📈 PT Zone: $1.25 to $1.70 premium, based on drop to $306–307
🛑 Stop: If premium drops to $0.50 OR GLD breaks above $313
💰 Risk Mgmt: Keep exposure <2% of total account equity
⚠️ Key Considerations
Upside Risk: Sudden bullish shift or risk-off headlines can drive reversal
Time Decay: Premium erosion risk is higher if GLD consolidates
Volatility Drag: VIX dropping could suppress put premiums quickly
🧾 TRADE_DETAILS (JSON)
json
Copy
Edit
{
"instrument": "GLD",
"direction": "put",
"strike": 307.0,
"expiry": "2025-06-20",
"confidence": 0.65,
"profit_target": 1.25,
"stop_loss": 0.50,
"size": 1,
"entry_price": 0.84,
"entry_timing": "open",
"signal_publish_time": "2025-06-16 16:15:17 UTC-04:00"
}
💡 If GLD struggles to reclaim $312.20 at the open, the put setup becomes attractive. Breakout above $313? Exit quickly.

GOLD poised for breakout GLD & /gcAfter going on a huge run to 317 we have spent a significant time now basing out and consolidating we’ve come down into that 300 range and tested and built up quite a bit of support
With the Iranian intentions we could kickstart the next move in gold 317 is the breakout. I am looking to play this breakout on an intra day pull back with some calls one month out for a swing Trey looking at the 320 or 325 strike price

Gold - Falling VolatilityI've been selling option premium as momentum has fallen. Money is leaving gold and moving into silver.
As price reaches lower band, I'll be adding delta in anticipation of moves to much higher levels. Gold appears to be at the bottom on a long-term, rising channel and is providing positive long term opportunities.
