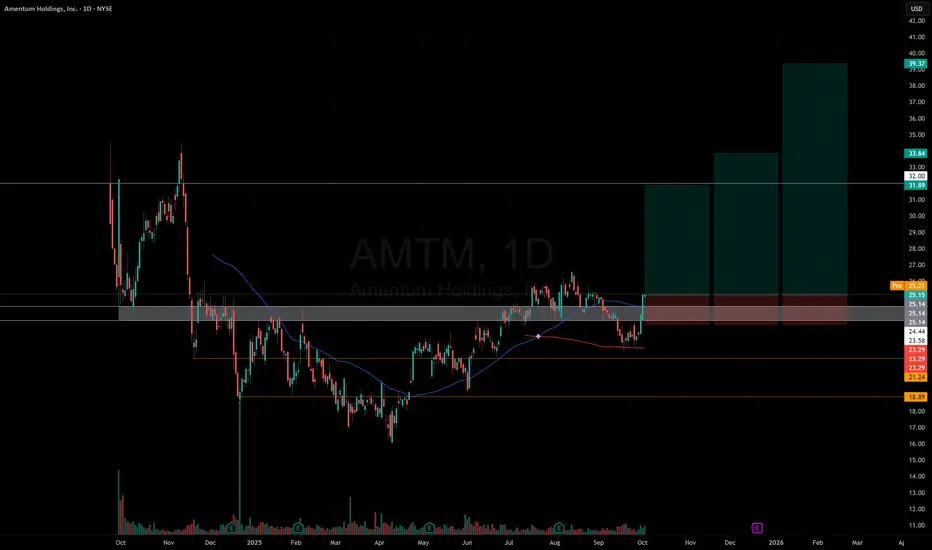
AMTM LongRange trade with targets to top of range, candle close and 1.272 fib measure.
Price is reclaiming the range with bullish hammer candle.
Price above 200ma.
Next report date
—
Report period
—
EPS estimate
—
Revenue estimate
—
0.2 EUR
56.24 M EUR
12.27 B EUR
196.55 M
About Amentum Holdings, Inc.
Sector
Industry
CEO
John E. Heller
Website
Headquarters
Chantilly
Founded
2019
ISIN
US0239391016
FIGI
BBG01TNWLFW7
Amentum Holdings, Inc. engages in mission-critical, technology-driven services in government and commercial markets. It operates through the Digital Solutions and Global Engineering Solutions segments. The Digital Solutions segment provides advanced digital and data-driven solutions including intelligence analytics, space system development, cybersecurity, and next generation IT. The Global Engineering Solutions segment manages large-scale environmental remediation, nuclear power solutions, platform engineering, sustainment and supply chain management. The company was founded on November 26, 2019 and is headquartered in Chantilly, VA.
Related stocks
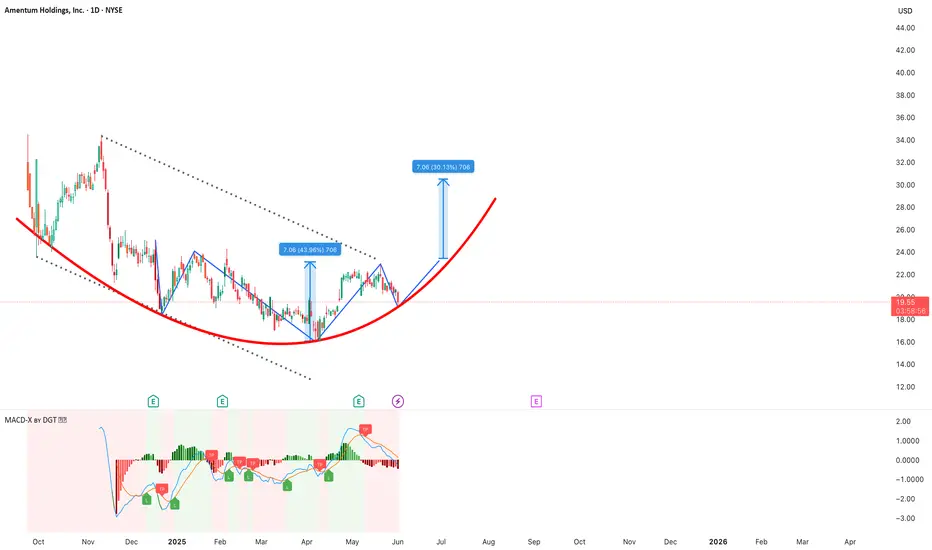
Amentum Holdings – Rounded Bottom Pattern in Progress📊 ** Current Overview **
* The stock is trading at **\ $19.40 **, showing a daily drop of ** 6.10% **.
* A ** rounded bottom (cup-shaped) ** pattern is forming, often associated with a **bullish reversal**.
* The recent price action mirrors the earlier ** mini-breakout ** structure, suggesting a re
AMTM AEROSPACE AND DEFENSEChart looks nice. Can this make new highs? Volume picking up with a nice move. GL!
Amentum Holdings, Inc. provides mission-critical, technology-driven services in government and commercial markets. It operates through two operating segments: Critical Mission Solutions and Cyber & Intelligence. The

AMENTUM Begins!As a starting step we will try to estimate potential levels to buy.
As we are used to see a cup formation on newly introduced stocks, we have one for AMENTUM.

See all ideas
Summarizing what the indicators are suggesting.
Neutral
SellBuy
Strong sellStrong buy
Strong sellSellNeutralBuyStrong buy
Neutral
SellBuy
Strong sellStrong buy
Strong sellSellNeutralBuyStrong buy
Neutral
SellBuy
Strong sellStrong buy
Strong sellSellNeutralBuyStrong buy
An aggregate view of professional's ratings.
Neutral
SellBuy
Strong sellStrong buy
Strong sellSellNeutralBuyStrong buy
Neutral
SellBuy
Strong sellStrong buy
Strong sellSellNeutralBuyStrong buy
Neutral
SellBuy
Strong sellStrong buy
Strong sellSellNeutralBuyStrong buy
AECP5862555
Amentum Escrow Corporation 7.25% 01-AUG-2032Yield to maturity
6.54%
Maturity date
Aug 1, 2032
See all 1AMTM bonds
Frequently Asked Questions
The current price of 1AMTM is 23.4 EUR — it has decreased by −7.14% in the past 24 hours. Watch Amentum Holdings, Inc. stock price performance more closely on the chart.
Depending on the exchange, the stock ticker may vary. For instance, on MIL exchange Amentum Holdings, Inc. stocks are traded under the ticker 1AMTM.
1AMTM stock has fallen by −2.50% compared to the previous week, the month change is a 20.62% rise, over the last year Amentum Holdings, Inc. has showed a 28.57% increase.
We've gathered analysts' opinions on Amentum Holdings, Inc. future price: according to them, 1AMTM price has a max estimate of 34.42 EUR and a min estimate of 24.95 EUR. Watch 1AMTM chart and read a more detailed Amentum Holdings, Inc. stock forecast: see what analysts think of Amentum Holdings, Inc. and suggest that you do with its stocks.
1AMTM reached its all-time high on Nov 25, 2025 with the price of 27.0 EUR, and its all-time low was 17.0 EUR and was reached on Jun 2, 2025. View more price dynamics on 1AMTM chart.
See other stocks reaching their highest and lowest prices.
See other stocks reaching their highest and lowest prices.
1AMTM stock is 7.69% volatile and has beta coefficient of 1.10. Track Amentum Holdings, Inc. stock price on the chart and check out the list of the most volatile stocks — is Amentum Holdings, Inc. there?
Today Amentum Holdings, Inc. has the market capitalization of 6.04 B, it has increased by 12.08% over the last week.
Yes, you can track Amentum Holdings, Inc. financials in yearly and quarterly reports right on TradingView.
Amentum Holdings, Inc. is going to release the next earnings report on Feb 10, 2026. Keep track of upcoming events with our Earnings Calendar.
1AMTM earnings for the last quarter are 0.54 EUR per share, whereas the estimation was 0.50 EUR resulting in a 6.52% surprise. The estimated earnings for the next quarter are 0.44 EUR per share. See more details about Amentum Holdings, Inc. earnings.
Amentum Holdings, Inc. revenue for the last quarter amounts to 3.34 B EUR, despite the estimated figure of 3.08 B EUR. In the next quarter, revenue is expected to reach 2.85 B EUR.
1AMTM net income for the last quarter is 34.09 M EUR, while the quarter before that showed 8.49 M EUR of net income which accounts for 301.55% change. Track more Amentum Holdings, Inc. financial stats to get the full picture.
No, 1AMTM doesn't pay any dividends to its shareholders. But don't worry, we've prepared a list of high-dividend stocks for you.
As of Dec 8, 2025, the company has 50 K employees. See our rating of the largest employees — is Amentum Holdings, Inc. on this list?
EBITDA measures a company's operating performance, its growth signifies an improvement in the efficiency of a company. Amentum Holdings, Inc. EBITDA is 870.94 M EUR, and current EBITDA margin is 7.10%. See more stats in Amentum Holdings, Inc. financial statements.
Like other stocks, 1AMTM shares are traded on stock exchanges, e.g. Nasdaq, Nyse, Euronext, and the easiest way to buy them is through an online stock broker. To do this, you need to open an account and follow a broker's procedures, then start trading. You can trade Amentum Holdings, Inc. stock right from TradingView charts — choose your broker and connect to your account.