How to identify a Buy Side Dark Pool Platform Trend.Contrary to popular opinion. Dark Pools do rarely move price in huge runs up or down. The Giant Buy Side Institutions use ATS Venues called "Dark Pools of Liquidity" to ensure that they can control their price to the penny or half penny spread. You need to learn how to read the a stock chart as easily as reading a book. Buy Side Institutions price on daily charts will usually be very small candles. Some candles will be white, some will be doji's and some will be black. A black candle in a platform is not a sell short signal.
Platforms are a narrow price range that has consistent highs and lows that you can draw a rectangle around. Typically a Platform has a very stable price action but the candles are very small and compact. This is the Buy Zone that Dark Pools create that can last 1 -3 months depending on the reason for the Buy Side Institutions accumulation. IF it is for an ETF development, then the accumulation will be faster a month or less. If the accumulation is due to the expectation that the company is going to have a strong earnings report, then the platform will tend to be 3 months in duration before HFTs gap and run the stock up on earnings news. Platforms are an important sideways trend that you need to be able to easily identify so that you can enter the stock before the earnings release and HFT gap up.
The Platform is a trend that takes some study to be able to see but the time is worth it because often the gaps out of a platform can be huge OR there is a strong momentum run or velocity run that nets high profits with low risk.
1APP trade ideas

AppLovin (APP) – Momentum Building for a Breakout?Hey traders!
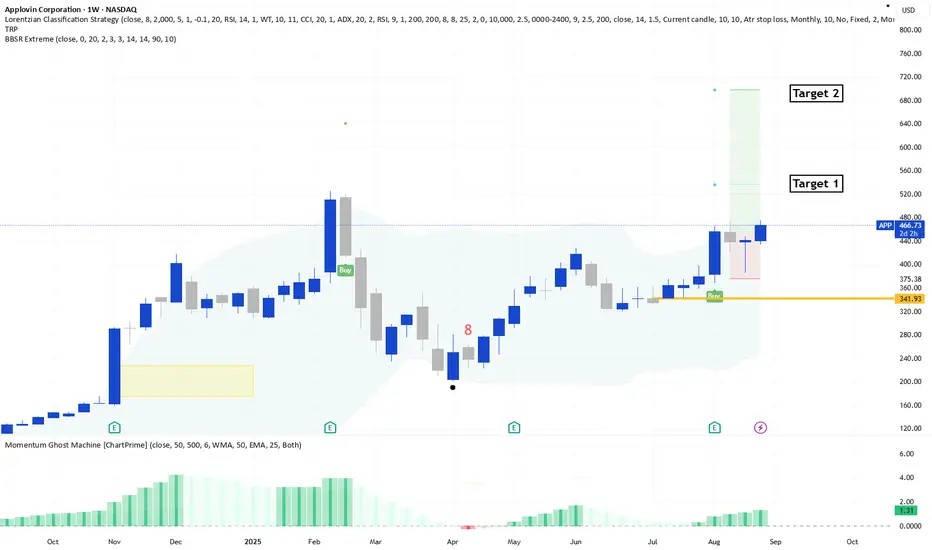
Let’s take a closer look at AppLovin Corp (NASDAQ: APP), which is showing some serious strength on the weekly chart.
Current Price: $466
Entry Zone: $450 – This level has acted as a solid support and could offer a great risk-reward setup.
Target 1: $540 – A key resistance level and potential short-term profit zone.
Target 2: $700 – If bullish momentum continues, this could be the next major upside target.
Catalyst to Watch:
AppLovin is rumored to be a strong candidate for S&P 500 inclusion. Such a move could trigger institutional buying, increase visibility, and act as a powerful tailwind for the stock.
Technical Setup Highlights:
Recent buy signals triggered
Momentum Ghost Machine shows increasing bullish pressure
BBSR extreme close values support a continuation of the uptrend
Add it to your watchlist and let’s see how this plays out!
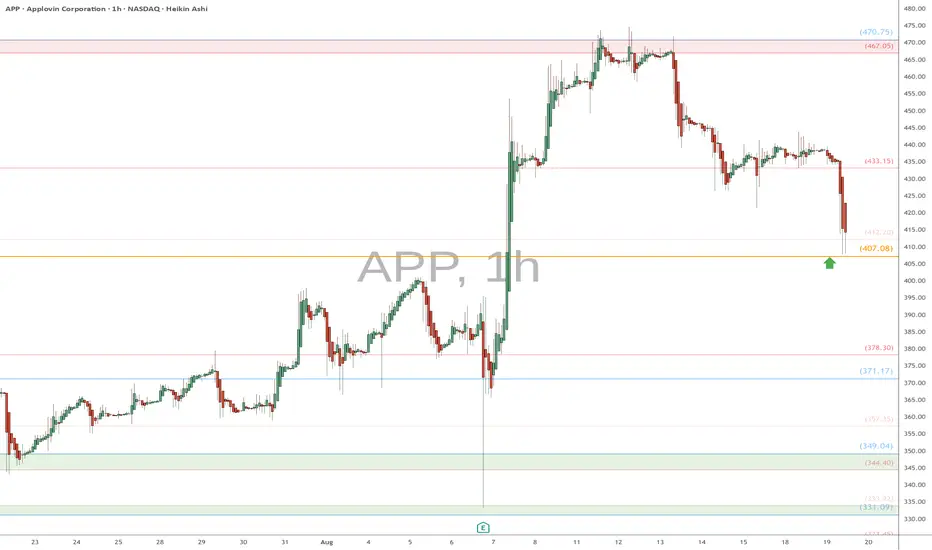
APP eyes on $407.08: Golden Genesis fib may end the CorrectionAPP has been pulling back with the general market.
Currently testing a Golden Genesis fib at $407.08.
Look for a clean bounce to maybe end correction.
It is UNLIKELY to be "the" bottom.
It is PROBABLE to be "a" bottom.
It is PLAUSIBLE to break and fall.
.
Previous Analysis that caught a PERFECT BREAKOUT
Hit BOOST and FOLLOW for more such PRECISE and TIMELY charts.
========================================================
.
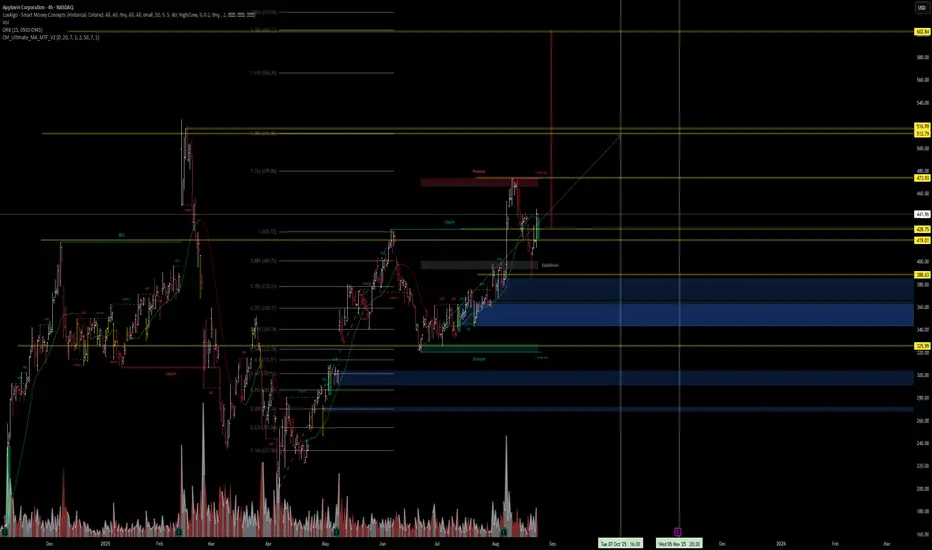
APP (4H) | Runway to $500+ if AI & Flow HoldAPP (AppLovin) — AI & Smart Money Bust Open Path to $500–$517
Body Text:
AppLovin appears primed for another leg higher—AI models, technical structure, and institutional flow all aligning bullish:
⮕ AI Forecast targets $497.93 (30-day) — logical first major resistance zone. Thru there, $512–$517 opens up as next supply/pumping zone.
⮕ Call sweeps at $462–$470 (Aug 29) show serious bullish wagers in motion.
⮕ Chart Structure: Reclaiming $428–$430 pivot (former supply now support). Cleanup through $473–$480 resistance could clear the way to $500+.
⮕ Fundamentals & Sentiment: Stellar Q2 beat and guidance raise; IBD comp rating now elite at 98; continued analyst upgrades and S&P inclusion talk add fuel.
Probabilistic Targets:
Base Case (~40%): Target zone $490–$500 — aligns with AI and near-term supply breakout.
Extended (~20%): Run to $512–$517 if momentum sustains and broader market holds.
Failure (~40%): Rejection below $428 pivot could re-test $400–$405 demand.
Trade Setup
Entry: $442
Stop-Loss: Ideally $430–$435 (under pivot)
Convert into scale-out or trailing above $497–$500
This is AI + Flow + Structure convergence — textbook and high-probability asymmetric setup.
#APP #TradingView #AITrading #OptionsFlow #BreakoutSetup #AppLovin #TechnicalAnalysis
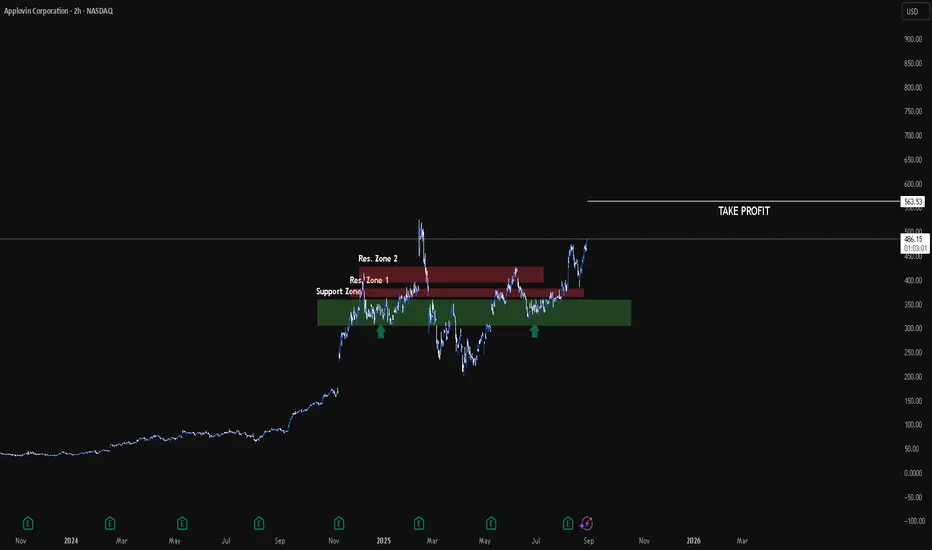
Applovin Corp. Trading Idea. 2H. We are seeing how good the first impulse was. It's marked with a green arrow on the Chart.
The second destination is our TP... We hope the second one will be just as good.
Hit Your Take Profits. That's my wish for you.
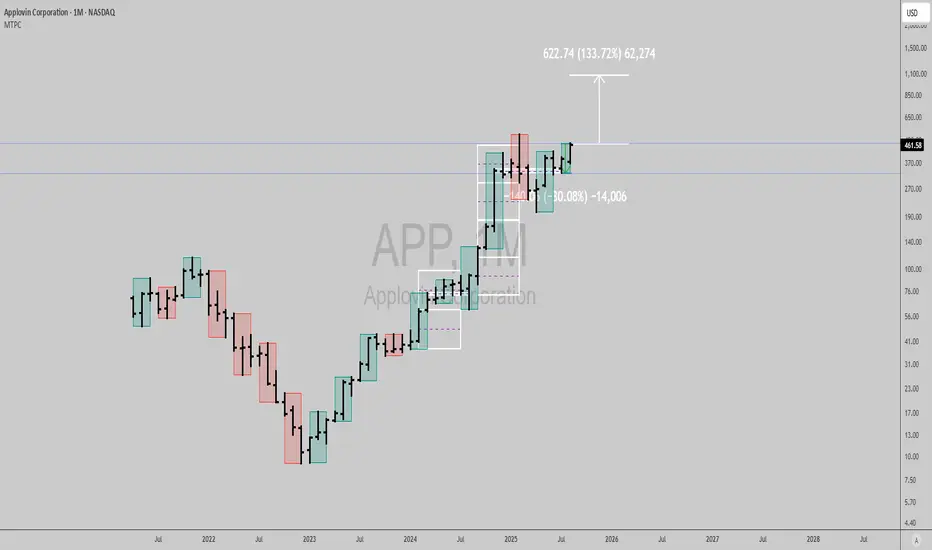
$APP: Strong technical signal with bullish fundamentalsAppLovin ( NASDAQ:APP ) stands out as a compelling growth story driven by its AI-powered AXON platform, which has transformed the company into a high-margin leader in digital advertising technology.
With robust revenue growth of 43% in 2024 and analyst projections of nearly 90% earnings growth in 2025, APP demonstrates the strong quarterly and annual growth that growth investors would find appealing.
The company’s innovation, leadership position in a rapidly expanding market, and strong institutional sponsorship further support the bullish outlook.
Technically, APP has broken out of a favorable Time@mode pattern, the proprietary trend-following system I use (coined by @timwest here), which projects an impressive 133% rally over the next seven months - an upside well above consensus analyst targets.
This blend of fundamental strength, market leadership, positive institutional demand, and confirmed technical momentum creates an attractive setup for significant stock appreciation in the near to medium term.
Best of luck!
Cheers,
Ivan Labrie.
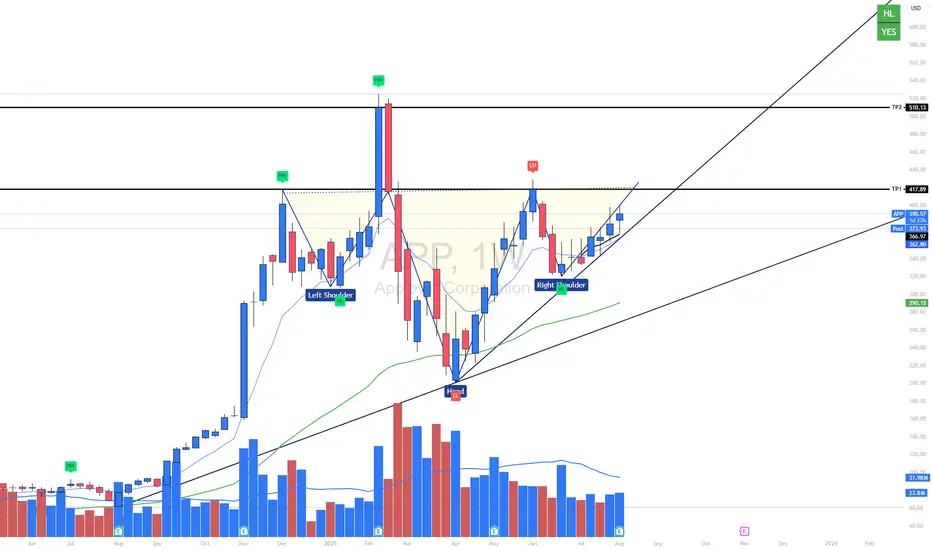
Bullish | APPNASDAQ:APP
Weekly Chart | Swing and Position Setup
APP is forming a textbook inverse head and shoulders pattern, signaling a major bullish reversal on the weekly timeframe.
Structure Highlights:
Left Shoulder – Head – Right Shoulder confirmed
Neckline breakout with change of character (ChoCH)
Price is trending above all key moving averages (EMA 9, EMA 50, VWAP)
Bullish volume behavior: expansion on rallies, contraction on pullbacks
Key Levels:
TP1: 417.89 (neckline resistance)
TP2: 510.13 (measured move target)
Final projection: 600+ if macro conditions align
Invalidation Level: Weekly close below 345
Thesis:
As long as the neckline holds, the bullish momentum remains valid. The structure is clean, technical confluence is strong, and volume confirms accumulation. This setup favors swing traders and position holders looking for high reward-to-risk entries.
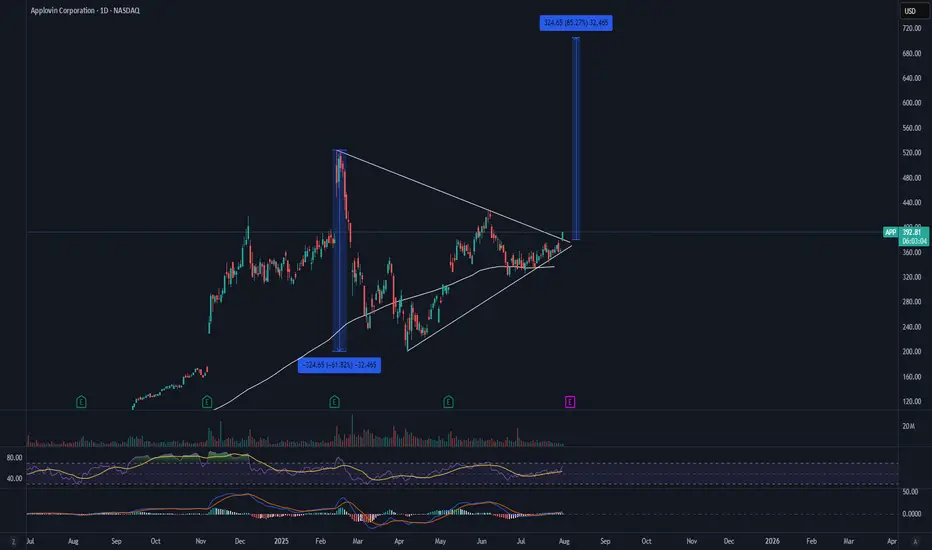
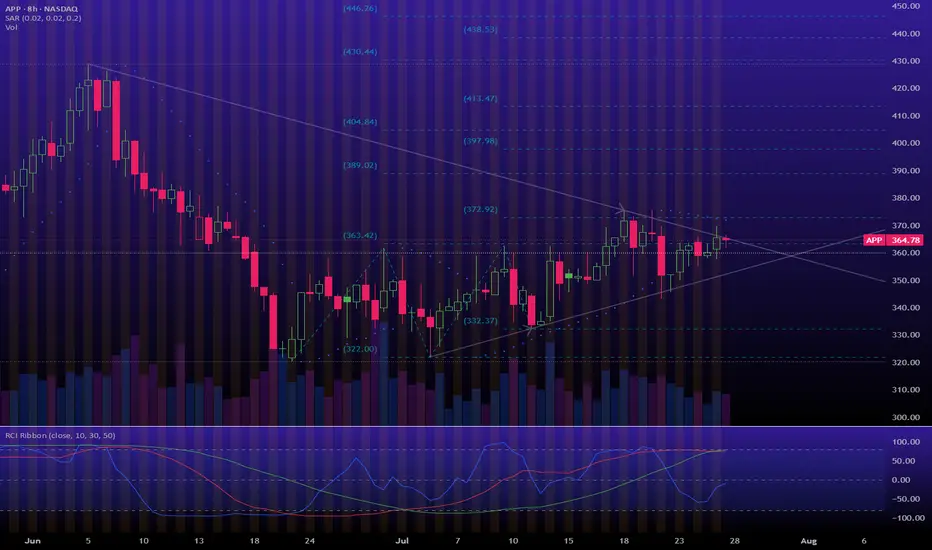
APP Earnings Triangle BreakoutWith APP breaking key resistance to the upside. There is a possibility for an aggressive move to the upside. This will NOT be a straight line up, but does show the possibility of the measured move. If I were to enter this, todays candle would be my entry and my stop loss would be an aggressive close back under the trendline.
Let's see what happens.
Buy Idea APP (Applovin Corp)Entry: $371 - 372
Stop: $342.50
Risk per share: $28.80
Earnings Catalyst Setup
• Flat base breakout above $370 zone, strong price structure
• Volume expanding into earnings — ideal for pre-earnings momentum pop
• Holding all major MAs: 21EMA, 50MA, 200MA clustered below
• MACD & Oscillators turning up, showing early momentum shift
• Institutional positioning appears supportive
• Earnings Date: ~9 days (6 Aug 2025 after mkt)
⚠️ Key Notes
• Pre-earnings breakout pattern, keep size light
• Possible re-rating if earnings surprise positively — watch for revenue growth in AI/game ads
• Sell partial above 1R to de-risk, trail rest
DISCLAIMER : The content and materials featured are for your information and education only and are not attended to address your particular personal requirements. The information does not constitute financial advice or recommendation and should not be considered as such. Risk Management is Your Shield! Always prioritise risk management. It’s your best defence against losses.
BofA note: : Excellent setup w/catalysts from mobile gaming & adConfirmation of self-serve launch would put story on track: APP remains top pick under coverage. We see big upside to CY26 EBITDA expectations, with this print potentially prompting upward revisions; the vast majority of investors we spoke with appear to exclude both a continued managed service onboarding ramp, and a major self-serve ramp in CY26. This quarter, management has the opportunity to
(1) confirm the launch timing of APP’s eCommerce self-serve platform for small advertisers,
and
(2) indicate the resumption of onboarding of larger merchants to its managed service. About one third of investors we spoke with expect the self-serve platform to launch this Fall, and ~40% expect a launch during the holiday shopping season. Despite this, expectations of Q3/Q2 growth appear too conservative; APP’s managed service would resume onboarding well before self-serve launches.
Mobile game ads could drive big Q2 expectations beat: Based on client conversations, 2Q25 Advertising Revenue expectations are above guidance of $1.20Bn (+4%-5% Q/Q as usual), but in line with BofA’s $1.26Bn (+9% Q/Q). Few investors we spoke with assumed a performance break-through (eg “model enhancement”) in Q2, but virtually all are above guidance. Mobile game engagement and ad load continued to trend upwards in Q2, giving our model some fundamental support. We assume flattish Q/Q eCommerce revenue, although a first cohort managed service advertisers is known to have tested APP’s new AI dashboard. We removed APP’s 1P games segment from our consolidated model as APP will report it in discontinued operations from Q2 onwards; we estimate an incremental $30mn of Advertising net revenue contribution from
divested 1P studios in Q3 onwards.
Q3 & CY25 expectations likely too conservative: Few investors we spoke with appear to assume a Q3 (1) a model enhancement or (2) an eCommerce managed service ramp, putting BofA’s $1.42bn well above the vast majority of clients. The likelihood of a model enhancement rises with each passing quarter, making upward revisions likely post print. We change CY25 Revenue/EBITDA forecast to $5.8bn/$4.5bn from $6.2bn/$4.6bn to reflect the divestiture of APP’s 1P games segment in Q2.
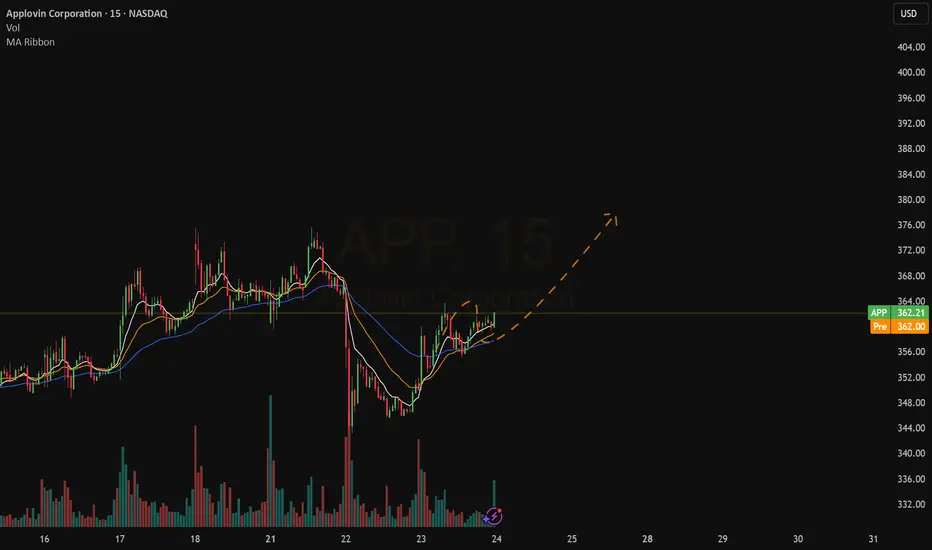
QuickTrade : APPOur Setup on the 15 minutes chart
Bullish ATR Alert
Bullish crossover with pullback on the ema50 in this case.
Volume is coming.
Ready To Catch It
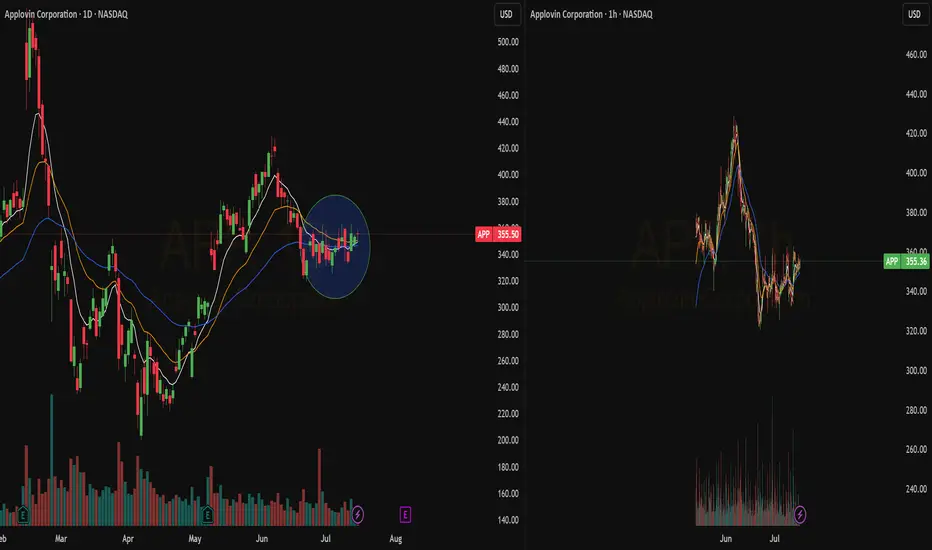
Quick View: $APPThe Daily Chart sees the price to hold the ema 50d while the ema 21d is getting closer and closer.
The action is not supported by volume, as happens in every classic pullback.
Ready to catch the action
$APP Long Setup – Bullish Reversal Attempt off Key SupportApplovin ( NASDAQ:APP ) is attempting to base and reverse off the lower range of its cloud structure after a sharp pullback from highs above $400. Price is holding just under the cloud but showing early signs of curling higher. Despite bearish MACD pressure, momentum is beginning to decelerate, and a bounce here could offer strong upside.
Current setup offers a 2.83 risk/reward:
Entry: $341.03
Stop: $308.00 (below recent low)
Target: $434.44 (back to breakdown zone)
This is a countertrend play unless the price can reclaim and hold above the cloud. If it clears $360–$370 with volume, it opens the door to $400+. For now, this is a speculative long with a tight invalidation point and plenty of upside.
Are you buying this bounce or waiting for trend confirmation?

APP Weekly Trade Plan – June 20, 2025🟥 APP Weekly Trade Plan – June 20, 2025
🎯 Instrument: APP (Applovin Corp)
📉 Direction: Bearish (Put)
📅 Expiry: 2025-06-20
📊 Confidence Level: 65%
⏰ Entry Timing: Market Open
🔎 Model Consensus Breakdown
Model Direction Summary
Grok/xAI 🔻 Bearish Clear bearish momentum. Recommends $325 put.
Claude ⚠️ No Trade Mixed signals; confidence below 50%.
Gemini 🔻 Bearish Recommends $322.50 put based on RSI/VIX.
Llama ⚠️ No Trade Slightly bearish but low conviction.
DeepSeek 🔼 Bullish Contrarian call ($327.50) against oversold bounce.
🧠 Consensus Takeaway
✅ Most models agree APP is under bearish pressure on the daily chart.
⚠️ Mixed signals emerge due to oversold RSI and elevated VIX (~20.31).
🧨 Watch for short squeezes or rebound attempts off key support ($325–$327).
✅ Recommended Trade (Put Option)
Metric Value
🎯 Strike $325 Put
💰 Entry Price $0.75 (limit)
🛑 Stop Loss $0.38
🎯 Profit Target $0.975+
📈 Confidence 65%
📏 Size 1 contract
📅 Expiry June 20, 2025
💡 This trade bets on short-term continuation lower, possibly breaking $325 support.
⚠️ Risk Management Notes
VIX at 20+ increases whipsaw risk — limit order strongly recommended.
Oversold RSI could lead to a dead-cat bounce.
Respect the stop-loss if APP rebounds above $327 intraday.
🧾 TRADE_DETAILS (JSON Format)
json
Copy
Edit
{
"instrument": "APP",
"direction": "put",
"strike": 325.0,
"expiry": "2025-06-20",
"confidence": 0.65,
"profit_target": 0.975,
"stop_loss": 0.38,
"size": 1,
"entry_price": 0.75,
"entry_timing": "open",
"signal_publish_time": "2025-06-20 15:21:16 UTC-04:00"
}

AppLovin - the Shoulders – But Not the Breakdown!🟢 Head and Shoulders Pattern (Bearish)
* The price action is forming a left shoulder , a higher peak (head) , and a right shoulder .
* This classical pattern often signals a reversal from bullish to bearish.
* The dotted orange neckline marks the potential support – if broken, it could trigger a sharper decline.
📉 Key Technical Zones
* Neckline Support: Around $309 . A breakdown below this level may confirm the pattern.
* Previous Support : In case of a breakdown, next strong support lies near $100–110 (long-term zone).
* Upside Scenario : If neckline holds and bullish momentum resumes, the pattern could be invalidated with a breakout over $400 .
📊 MACD Divergence
* MACD shows a bearish divergence (higher price highs vs. lower MACD highs), signaling momentum weakness .
* The histogram is turning red again – a bearish sign.
* A bearish crossover has already occurred, supporting a possible downtrend.
🔄 Possible Scenarios
* Bearish : If neckline breaks → possible drop toward the $200s or lower.
* Neutral : Consolidation between $310–$380.
* Bullish : If price bounces before neckline and breaks above $400 → invalidates pattern.

APP watch $310-313: Key Resistance before next Target at $350APP recovering well but watch key resistance at $310.50-313.14
If we get a dip then we look to support below at $289.58-291.00
Break and run has some blue skies above it until the $350 area.

AppLovin Corporation (APP) – Rewiring Ad Tech with AI at ScaleCompany Snapshot:
AppLovin NASDAQ:APP is shedding its legacy gaming identity and emerging as a pure-play AI advertising infrastructure leader. Post its $900M gaming unit divestiture, the company is laser-focused on AXON 2.0, its next-gen AI ad engine, positioning APP as one of the most transformative players in the digital ad ecosystem.
🚀 Key Growth Drivers:
🧠 AXON 2.0 – AI-Powered Programmatic Ad Platform
Delivers real-time ad bidding with predictive optimization
Retail and eCommerce verticals seeing rapid adoption
Scalable infrastructure = operating leverage + high margin tailwinds
🛠️ Self-Serve & GenAI Expansion
Self-serve ad tools on the roadmap = democratizing access for SMBs
Generative AI ad creatives enable fast, customized campaigns at scale
Broadens TAM beyond top-tier advertisers to long-tail marketers
💰 High-Margin, Asset-Light Model
Post-divestiture, APP’s margins are structurally higher
Lean, software-first model with strong unit economics and cash generation
Flexibility for buybacks, R&D, or strategic M&A
📊 Market Positioning & Flywheel
Network effects: More advertisers = better data = smarter bidding
Competes with The Trade Desk, Google DV360, and Meta in ad optimization
First-mover advantage in mobile AI bidding infrastructure
📈 Financial & Strategic Highlights:
Q/Q margin expansion amid rising advertiser retention
Structural cost improvements post-gaming spinout
Potential for SEED_TVCODER77_ETHBTCDATA:2B + in annualized EBITDA as AI scaling accelerates
🧭 Investment Outlook:
✅ Bullish Above: $255.00–$260.00
🚀 Upside Target: $520.00–$525.00
🎯 Thesis: AppLovin is evolving into the NVIDIA of mobile ad tech—using proprietary AI infrastructure to reshape programmatic advertising. With high-margin growth, expanding use cases, and a clear product vision, APP is a top-tier AI advertising compounder.
#AppLovin #APP #AdTech #AXON #AIAdvertising #Programmatic #DigitalMarketing #GrowthStock

LONG APP / Swing tradingPrice just above SMA200d, previous relevant support.
Bullish wedge for a fast and explosive rally, possible short squezze.
Target: $270.

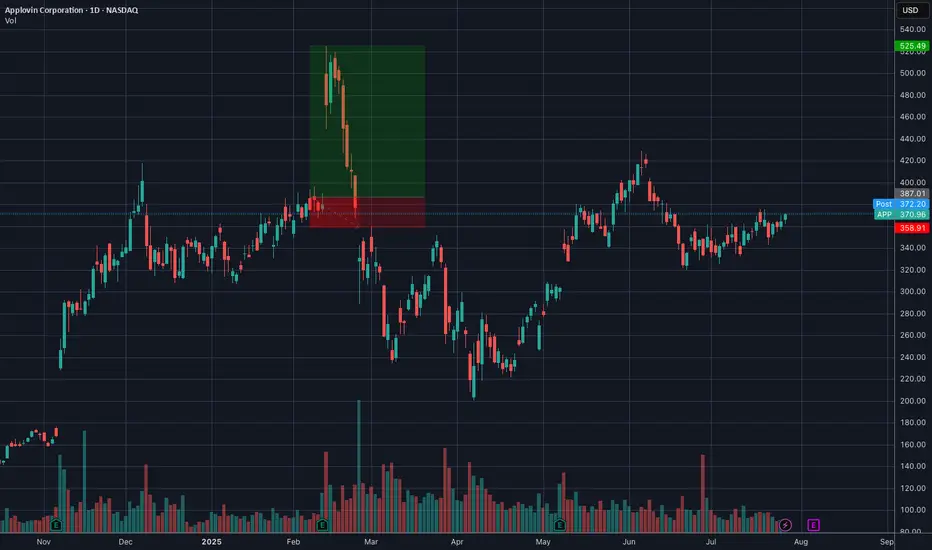
$APP - Model Book Example - 2024Consolidation breakout on APP in 2024. Ticks all the boxes - proper range break breakout on volume, MAs stacked, volume dry up in base, obeys the 20day on run-up.

APP. GOING DOWN TO $115. HUGE BUY AT $115.Huge level of support. Great Company. WIll be buying at these levels.

Longs should be careful with this one.boost and follow for more! 🔥
could push to 359-416 short term before it tops out, from risk reward perspective theres much better options in this market.
I personally wouldn't chase this one to the upside with so many options out there, big money may think the same and sell it off. Id be a buyer at trend support or near it.

Apploving 1HR zoomed outThe last time a similar move in amplitude occurred, was to the positive persuasion and took approx. 17 hrs to move approx. 40%...PUTTential18% + to the downside inbound over the next day; if not MORE... Not advice...new to this wanna get better.

$APP - A hard passNASDAQ:APP I wouldn’t go long on this stock. It’s currently within the volume gap and up against major resistance. Many other stocks have charts that look more promising than this one.
It’s a hard pass for me.
