Macy’s Inc. (M) Expands Digital Retail PresenceMacy’s Inc. (M) is a leading U.S. department store chain offering apparel, beauty, home goods, and accessories through its iconic Macy’s stores, Bloomingdale’s, and Bluemercury brands. With a growing online presence and nationwide footprint, Macy’s continues to be a household name in retail. The com
Next report date
—
Report period
—
EPS estimate
—
Revenue estimate
—
1.564 EUR
561.90 M EUR
22.21 B EUR
266.66 M
About Macy's Inc
Sector
Industry
CEO
Antony Spring
Website
Headquarters
New York
Founded
1858
ISIN
US55616P1049
FIGI
BBG01K3Y4PV2
Macy's, Inc. engages in the retail of apparel, accessories, cosmetics, home furnishings, and other consumer goods. The firm's brands include Macy's, Bloomingdale's, and Bluemercury. It offers men's, women's, and children's apparel, women's accessories, intimate apparel, shoes, cosmetics, fragrances, as well as home and miscellaneous products. The company was founded by Rowland H. Macy in 1858 and is headquartered in New York, NY.
Related stocks
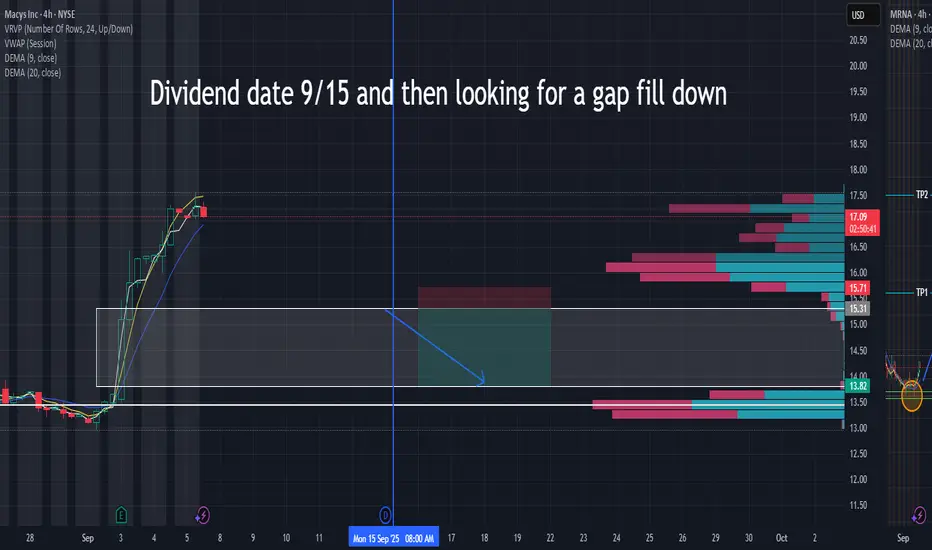
Macys dividend play I am looking to play the gap fill down on Macys around the date of the dividend close. Not financial advice just keeping people informed of a couple plays that i am watching. I have a 1:3.7 risk to reward on this.
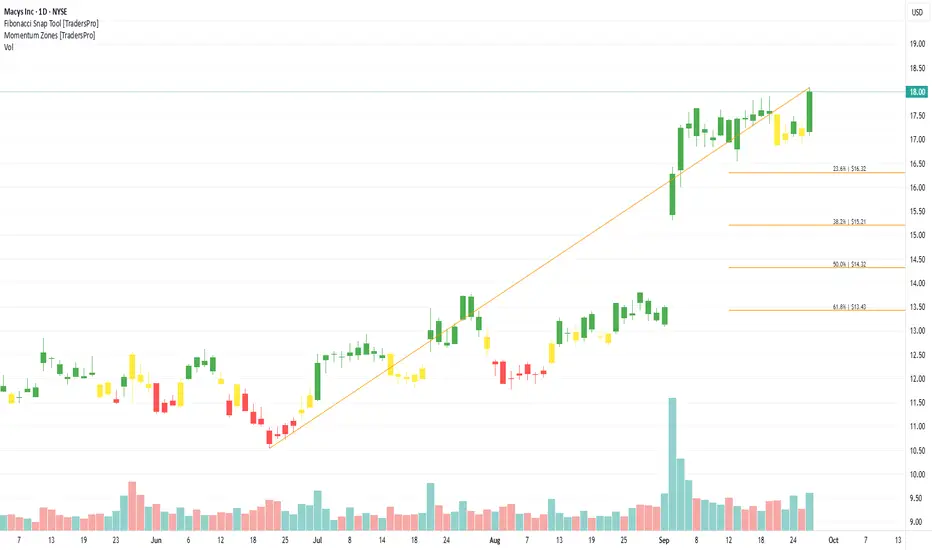
Macy Stock Chart Fibonacci Analysis 081525Trading Idea
1) Find a FIBO slingshot
2) Check FIBO 61.80% level
3) Entry Point > 12.3/61.80%
Chart time frame:B
A) 15 min(1W-3M)
B) 1 hr(3M-6M)
C) 4 hr(6M-1year)
D) 1 day(1-3years)
Stock progress:A
A) Keep rising over 61.80% resistance
B) 61.80% resistance
C) 61.80% support
D) Hit the bottom
E
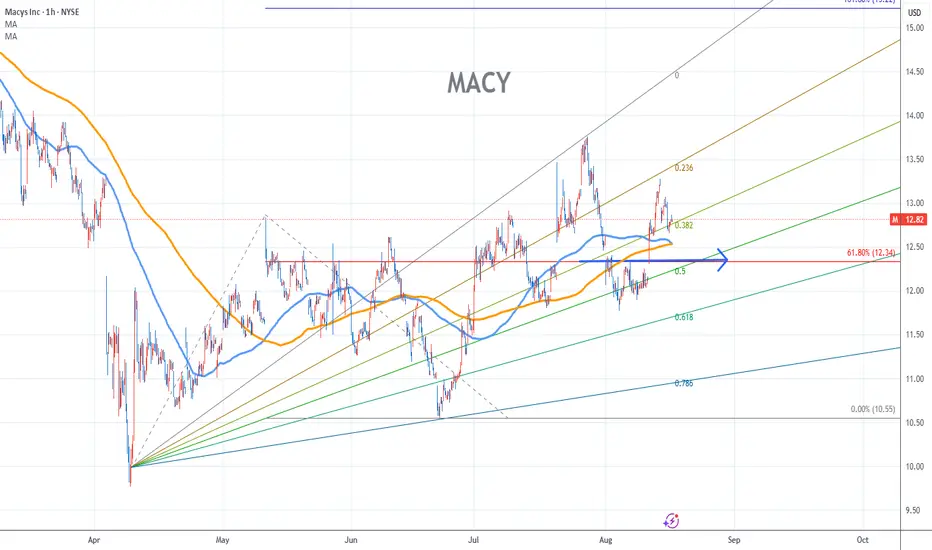
M to $15.50My trading plan is very simple.
I buy or sell when price tags the top or bottom of parallel channels.
I confirm when price hits Fibonacci levels.
So...
Here's why I'm picking this symbol to do the thing.
Price below bottom channels (period 100 52 39 & 26)
Stochastic Momentum Index (SMI) at ov

Macys | Chart & Forecast SummaryKey Indicators On Trade Set Up In General
1. Push Set Up
2. Range Set up
3. Break & Retest Set Up
Notes On Session
# Macys
- Double Formation
* 20.70 USD | A+ Set Up
* Neckline Entry At 16.70 USD | Subdivision 1
- Triple Formation
* 14.20 USD | Support Area | Top / Bottom Structure | Subdivision 2

Macys an american institution is in a fight for it's life....if it takes out that neckline.
"Macy's founded in 1858.
It is the largest department store company by retail sales in the United States as of 2015.
Macy's operates with over 700 stores in the United States. Its flagship store is located at Herald Square in the New York City borough of Manhattan.

Macy’s stock Down 13.7% on Q2 Earnings ReportsMacy’s (NYSE: NYSE:M ) has been a staple of American retail for over a century, but in Q2 CY2024, the iconic department store faced a challenging environment that reflected the shifting dynamics of consumer behavior and broader economic trends. Despite delivering a robust earnings performance, Macy

M Macy's Options Ahead of EarningsIf you haven`t sold M before the previous earnings:
Now analyzing the options chain and the chart patterns of M Macy's prior to the earnings report this week,
I would consider purchasing the 17usd strike price Calls with
an expiration date of 2024-8-30,
for a premium of approximately $1.47.
If the

M - Macy’s a slow moving short Macy’s bottom is cracking, it’s little late to short but this is the quick part of the move.
Short anywhere here or wait for a retest
Target #1 - 15
Stop loss- 19

MACY's season is coming -- and everyone knows it.As we approached the 2nd half of the year -- the season for buying personal stuff (and giving) is definitely ON.
And this past few days is a testament of that as MACY's is registering massive net buy volume.
On June 2, the stock net positive volume increased by a whopping +60% from its average num

See all ideas
Summarizing what the indicators are suggesting.
Neutral
SellBuy
Strong sellStrong buy
Strong sellSellNeutralBuyStrong buy
Neutral
SellBuy
Strong sellStrong buy
Strong sellSellNeutralBuyStrong buy
Neutral
SellBuy
Strong sellStrong buy
Strong sellSellNeutralBuyStrong buy
An aggregate view of professional's ratings.
Neutral
SellBuy
Strong sellStrong buy
Strong sellSellNeutralBuyStrong buy
Neutral
SellBuy
Strong sellStrong buy
Strong sellSellNeutralBuyStrong buy
Neutral
SellBuy
Strong sellStrong buy
Strong sellSellNeutralBuyStrong buy
Displays a symbol's price movements over previous years to identify recurring trends.
M5022546
Macy's Retail Holdings, Inc. 7.875% 01-MAR-2030Yield to maturity
9.04%
Maturity date
Mar 1, 2030
M5022544
Macy's Retail Holdings, Inc. 7.875% 01-MAR-2030Yield to maturity
8.85%
Maturity date
Mar 1, 2030
M5022550
Macy's Retail Holdings LLC 6.7% 15-JUL-2034Yield to maturity
8.13%
Maturity date
Jul 15, 2034
M5022559
Macy's Retail Holdings LLC 6.7% 15-JUL-2034Yield to maturity
7.89%
Maturity date
Jul 15, 2034
M.BI
May Department Stores Co. 6.7% 15-JUL-2034Yield to maturity
7.88%
Maturity date
Jul 15, 2034
M.BA
May Department Stores Co. 7.875% 01-MAR-2030Yield to maturity
7.56%
Maturity date
Mar 1, 2030
M5022549
Macy's Retail Holdings LLC 6.9% 15-JAN-2032Yield to maturity
7.54%
Maturity date
Jan 15, 2032
M.AI
Federated Retail Holdings, Inc. 6.375% 15-MAR-2037Yield to maturity
7.50%
Maturity date
Mar 15, 2037
M.AA
Macy's Retail Holdings, Inc. 5.125% 15-JAN-2042Yield to maturity
7.22%
Maturity date
Jan 15, 2042
M3930952
Macy's Retail Holdings, Inc. 4.3% 15-FEB-2043Yield to maturity
7.10%
Maturity date
Feb 15, 2043
M6123853
Macy's Retail Holdings LLC 7.375% 01-AUG-2033Yield to maturity
6.47%
Maturity date
Aug 1, 2033
See all 1FDO bonds
Frequently Asked Questions
The current price of 1FDO is 15.382 EUR — it has increased by 0.43% in the past 24 hours. Watch Macy's, Inc. stock price performance more closely on the chart.
Depending on the exchange, the stock ticker may vary. For instance, on MIL exchange Macy's, Inc. stocks are traded under the ticker 1FDO.
1FDO stock has risen by 3.00% compared to the previous week, the month change is a 31.99% rise, over the last year Macy's, Inc. has showed a 10.85% increase.
We've gathered analysts' opinions on Macy's, Inc. future price: according to them, 1FDO price has a max estimate of 15.79 EUR and a min estimate of 5.55 EUR. Watch 1FDO chart and read a more detailed Macy's, Inc. stock forecast: see what analysts think of Macy's, Inc. and suggest that you do with its stocks.
1FDO reached its all-time high on Mar 19, 2024 with the price of 19.940 EUR, and its all-time low was 9.212 EUR and was reached on Jun 23, 2025. View more price dynamics on 1FDO chart.
See other stocks reaching their highest and lowest prices.
See other stocks reaching their highest and lowest prices.
1FDO stock is 0.43% volatile and has beta coefficient of 1.07. Track Macy's, Inc. stock price on the chart and check out the list of the most volatile stocks — is Macy's, Inc. there?
Today Macy's, Inc. has the market capitalization of 4.17 B, it has increased by 3.20% over the last week.
Yes, you can track Macy's, Inc. financials in yearly and quarterly reports right on TradingView.
Macy's, Inc. is going to release the next earnings report on Nov 13, 2025. Keep track of upcoming events with our Earnings Calendar.
1FDO earnings for the last quarter are 0.36 EUR per share, whereas the estimation was 0.17 EUR resulting in a 117.04% surprise. The estimated earnings for the next quarter are −0.13 EUR per share. See more details about Macy's, Inc. earnings.
Macy's, Inc. revenue for the last quarter amounts to 4.22 B EUR, despite the estimated figure of 4.12 B EUR. In the next quarter, revenue is expected to reach 3.86 B EUR.
1FDO net income for the last quarter is 76.21 M EUR, while the quarter before that showed 33.55 M EUR of net income which accounts for 127.12% change. Track more Macy's, Inc. financial stats to get the full picture.
Yes, 1FDO dividends are paid quarterly. The last dividend per share was 0.16 EUR. As of today, Dividend Yield (TTM)% is 3.96%. Tracking Macy's, Inc. dividends might help you take more informed decisions.
Macy's, Inc. dividend yield was 4.30% in 2024, and payout ratio reached 32.41%. The year before the numbers were 3.42% and 394.25% correspondingly. See high-dividend stocks and find more opportunities for your portfolio.
As of Oct 4, 2025, the company has 94.19 K employees. See our rating of the largest employees — is Macy's, Inc. on this list?
EBITDA measures a company's operating performance, its growth signifies an improvement in the efficiency of a company. Macy's, Inc. EBITDA is 1.52 B EUR, and current EBITDA margin is 7.90%. See more stats in Macy's, Inc. financial statements.
Like other stocks, 1FDO shares are traded on stock exchanges, e.g. Nasdaq, Nyse, Euronext, and the easiest way to buy them is through an online stock broker. To do this, you need to open an account and follow a broker's procedures, then start trading. You can trade Macy's, Inc. stock right from TradingView charts — choose your broker and connect to your account.
Investing in stocks requires a comprehensive research: you should carefully study all the available data, e.g. company's financials, related news, and its technical analysis. So Macy's, Inc. technincal analysis shows the buy rating today, and its 1 week rating is buy. Since market conditions are prone to changes, it's worth looking a bit further into the future — according to the 1 month rating Macy's, Inc. stock shows the buy signal. See more of Macy's, Inc. technicals for a more comprehensive analysis.
If you're still not sure, try looking for inspiration in our curated watchlists.
If you're still not sure, try looking for inspiration in our curated watchlists.