1JNJ trade ideas

Long JNJ on the EMA bounceon an uptrend , seems to be trying to retest the highs again after bouncing off the 50EMA on daily

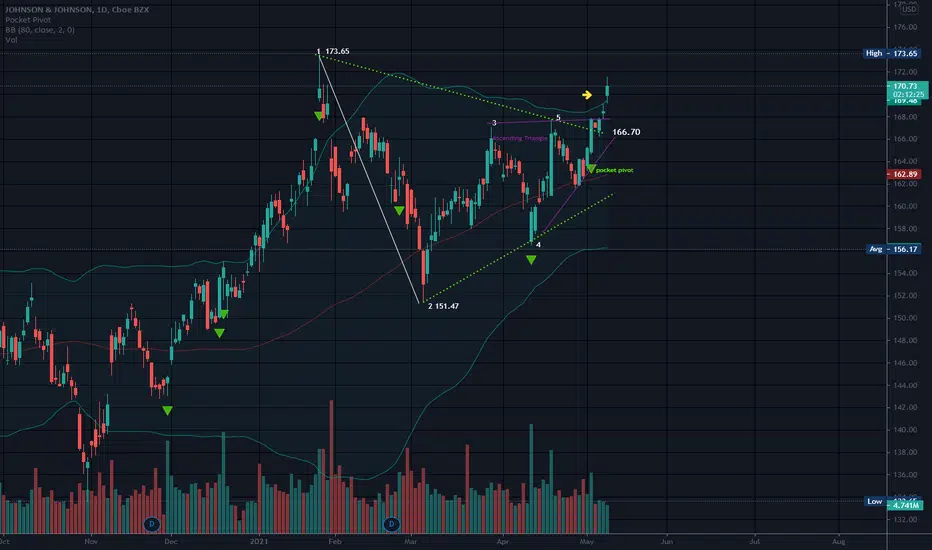
JNJ going for ATH retestJNJ is in an ascending triangle pattern. Uptrend has been challenged a couple times and has held its ground every time including its most recent test this past week. This will keep climbing until it retest ATH later this month.


Johnson and Johnson Struggling Below a Historic Resistance The share price appears unable to break out above the historic resistance level at 170.00, which represents a very strong bearish signal.
Moreover, the price action has recently established a broad 1-5 impulse wave pattern, as postulated by the Elliott Wave Theory, as well as having developed an Ascending Wedge. Both of these developments confirm the bearish expectations.
Finally, yesterday's trading session resulted in the creation of a Shooting Star candle, which could be a precursor to an imminent reversal.
Overall, there seems to be a very strong confluence of bearish indications at present.
The 23.6 and 38.2 per cent Fibonacci retracement levels represent the most likely targets for such a dropdown.

Long | JNJNYSE:JNJ \
Possible Scenario: LONG
Evidence: Price Action
TP: 175$
Call options, Strike 175$, 06/18/21
* This is my idea and could be wrong 100%.


Symmetrical Triangle Ascending Triangle173.65 is the long term high.
JNJ has broken free of both triangles, as well as the bollinger bands.
Bollinger bands are set on this chart using an eighty day moving average verses the norm of 20. Price is above the top band today which is bullish, but it is likely that price will return to the inside of the bands.
No recommendation


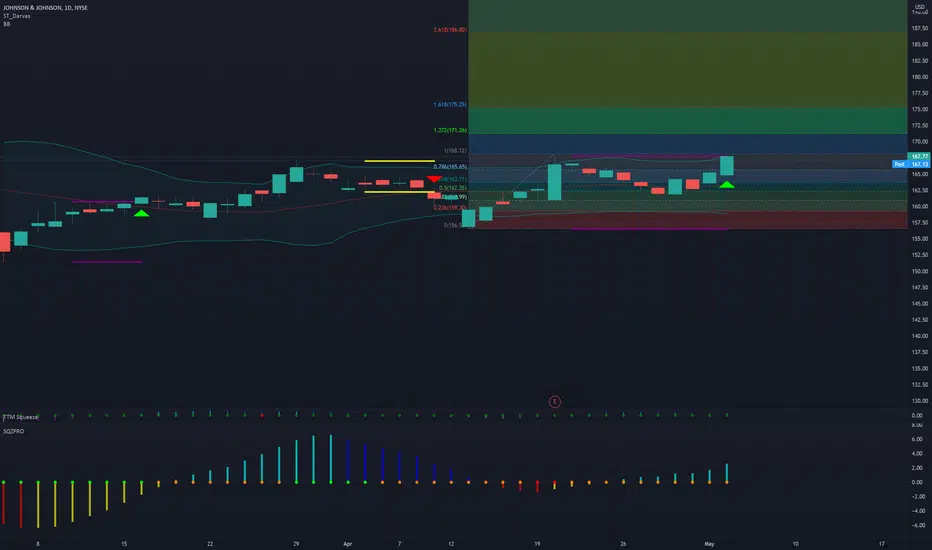
JNJ 1.272 Fib Ext Target IdentifiedJNJ which is a component of the DOW is scanning on A6 with a short squeeze setup. Using Fib extension 1.272 target, a price target has been identified to be approx $175. This extension was developed using the March 4th and 29th lows and highs, respectively. A6 scanning implies there is news being priced in and perhaps JNJ may announce or report new drug studies that could ignite the price to push toward the 2.618 fib ext which is $186. If this is the case, then JNJ may as well run toward a psych tgt of $200 sometime within the next 14 to 34 trading days.
Declining MACD15m distribution is targeting highlighted support level (4h doji)
Looks like it is setting up a new high on the move but on lower MACD. Then a drop.


JNJ - STOCKS - 26. APR. 2021Welcome to our weekly trade setup ( JNJ )!
-
4 HOUR
Bullish price action.
DAILY
Possible turnover and pressure towards previous highs.
WEEKLY
Expecting more bullish price movement.
-
STOCKS SETUP
BUY JNJ
ENTRY LEVEL @ 164.20
SL @ 160.79
TP @ Open
Max Risk: 0.5% - 1%!
(Remember to add a few pips to all levels - different Brokers!)
Leave us a comment or like to keep our content for free and alive.
Have a great week everyone!
ALAN


$JNJ with a Bullish outlook following its earnings #Stocks The PEAD projected a Bulish outlook for $JNJ after a Negative over reaction following its earnings release placing the stock in drift C
If you would like to see the Drift for another stock please message us. Also click on the Like Button if this was useful and follow us or join us.

Breakout Play on Johnson & Johnson Johnson & Johnson just posted better-than-expected EPS data for Q1. Meanwhile, the company's shares continue to strengthen above the 50-day MA (in green).
A potential breakout above the clearly visible Bullish Pennant would signify mounting bullish momentum, which can be taken advantage of. Bulls can catch a potential upswing towards the major resistance level at 170.00, with the potential for further gains above.

$JNJ may still have juice leftOur primary wave count indicates $JNJ could still have room for some great upside, to find new highs above $200.
The main target is the 1.618 extensions from waves 1-2, at $212.20.
Below 150 would lead to a new wave count.

ABC??? Volume or Pattern? Earnings 4-20 BMOABC bearish pattern. Bullish harmonic pattern but D is not here yet.
Pattern says Bearish. Volume says Bullish.
I plan to stay on the sidelines for now.
No recommendation.
Sometimes I guess you just go with the flow, and sometimes best to do nothing at all. I am always heistant to call anything bearish as of late )o:
