Next wave might be shaping up I am bullish above $14.53. I would like to see price close over the daily 20 ema, but sometimes that happens via bigger move without me. So smaller size, loose stop.
My target is $21.50 to $23 range, price action depending.
So it's a support trade, in a wave to wave setup.
Good luck, btw I am n
Next report date
—
Report period
—
EPS estimate
—
Revenue estimate
—
1.424 EUR
522.84 M EUR
634.05 M EUR
362.64 M
About MARA Holdings, Inc.
Sector
Industry
CEO
Frederick G. Thiel
Website
Headquarters
Hallandale Beach
Founded
2010
ISIN
US5657881067
FIGI
BBG01R9QY7C6
MARA Holdings, Inc. is a digital asset technology company, which engages in mining cryptocurrencies with a focus on the Bitcoin ecosystem. It also deals with owning and operating bitcoin mining facilities or data centers, selling proprietary software or technology to third parties operating in the Bitcoin ecosystem, offering advisory and consulting services to support Bitcoin mining ventures in domestic and international jurisdictions, and generating electricity from renewable energy resources or methane gas capture to power Bitcoin mining projects. The company was founded on February 23, 2010 and is headquartered in Hallandale Beach, FL.
Related stocks

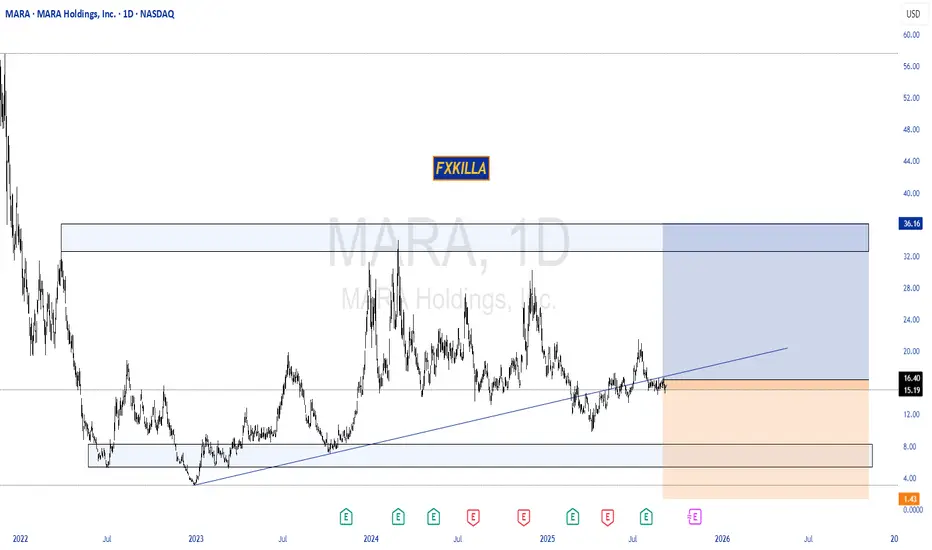
MARA HIGH PROBABILITY SETUP SOON!!!🚨 MARA HIGH PROBABILITY BUY SETUP 🚨
* Here We Can See Clearly The Next Potential Move For MARA Coming Hours/Days.
* Keep Your Eyes Close On Your Trading Positions.
* Happy PIP Hunting Traders.
FXKILLA.
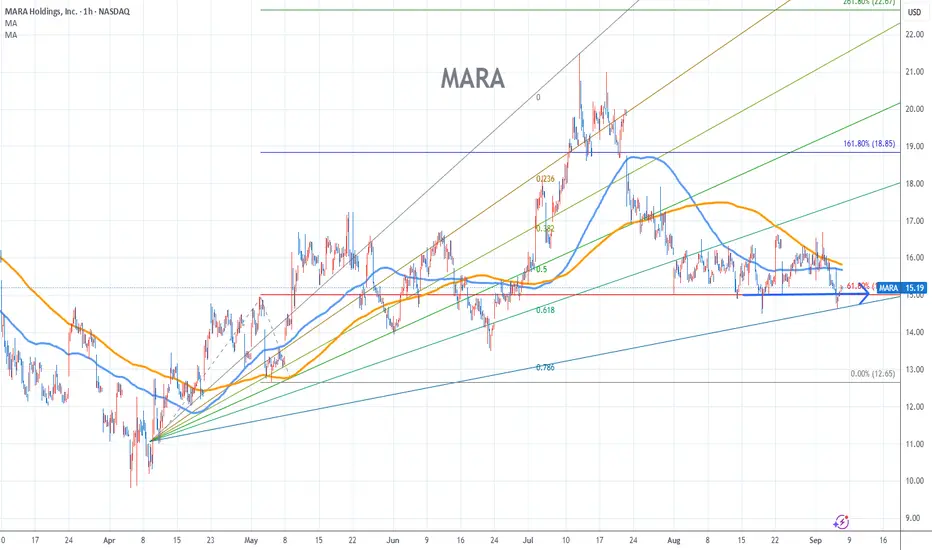
Marathon Stock Chart Fibonacci Analysis 090625Trading Idea
1) Find a FIBO slingshot
2) Check FIBO 61.80% level
3) Entry Point > 15/61.80%
Chart time frame:C
A) 15 min(1W-3M)
B) 1 hr(3M-6M)
C) 4 hr(6M-1year)
D) 1 day(1-3years)
Stock progress:A
A) Keep rising over 61.80% resistance
B) 61.80% resistance
C) 61.80% support
D) Hit the bottom
E)
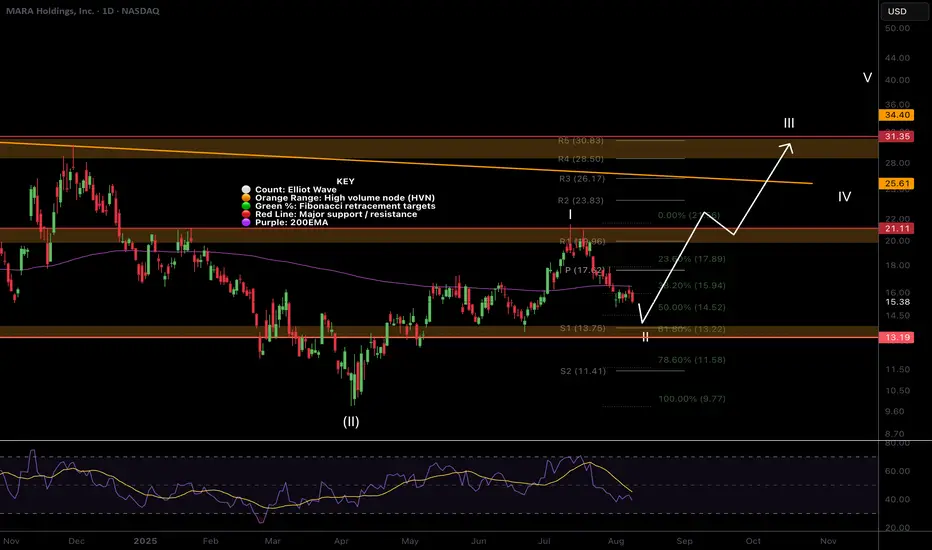
$MARA One More Push Lower to the Golden Pocket?NASDAQ:MARA was rejected hard on the 6th test of the daily 200EMA! The probability of a breakthrough is huge but it just cant overcome supply as people want out of this underperforming Bitcoin Miner! Just the recipe we need for explosive upside, capitulation.
The S2 pivot and Fibonacci golden pock
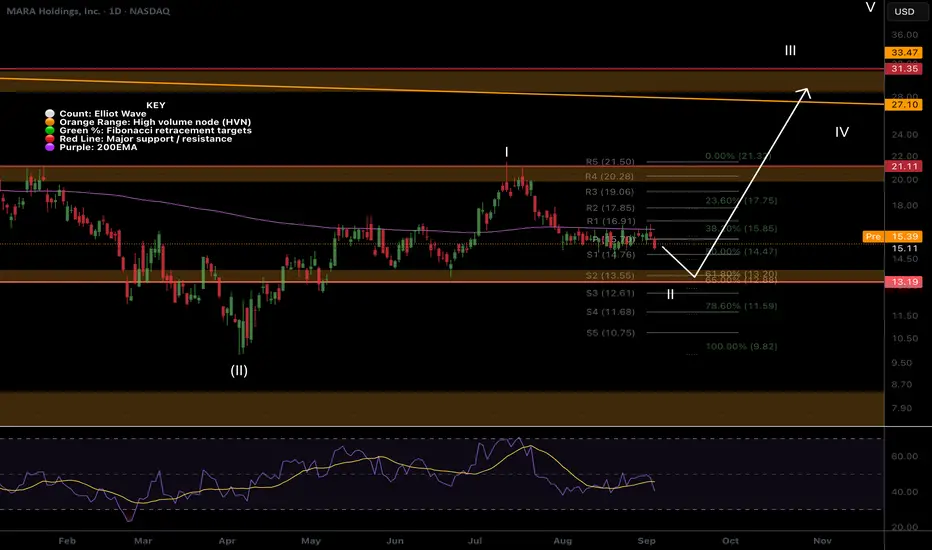
MARA Holding Tight!NASDAQ:MARA continues to lag behind the small cap Miners. It is attempting to break through the weekly 200EMA once more after the rejection from the weekly pivot and High Volume Node (HVN) resistance I warned about.
My long term outlook remains up in Elliot wave 3 towards the R% weekly pivot at $6

$Mara bullish or ultra bullishIf you believe bitcoin mining is the future among other crypto projects, may be there is something here. Log trendline break could lit fire under this beast or not. We'll see.

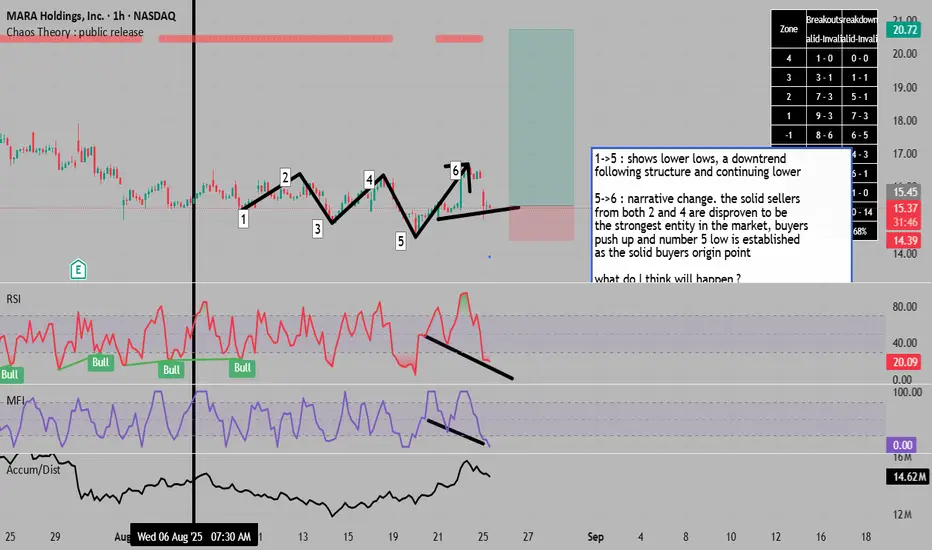
a change in narrative with return to solid =BUYers ## MARA Technical Analysis & Market Outlook
### **Elliott Wave Structure (1→5)**
The decline from wave 1 to 5 traced a clear five-wave impulsive move lower, establishing a downtrend with progressively lower lows. This bearish sequence bottomed around $10, marking the completion of the corrective ph
MARA - Currently Favorite Short-Term PickI believe MARA is primed for a sharp 50–80% upside move in the short term.

$MARA Setting Up for A Huge Move?This stocks price action has been subdued far too long after they sold shares to investors but should be moving more aggressively alongside Bitcoin, being the second largest holder of BTC in its treasury.
Price appears to have completed an awkward wave 1 potentially a leading diagonal with wave 2 n
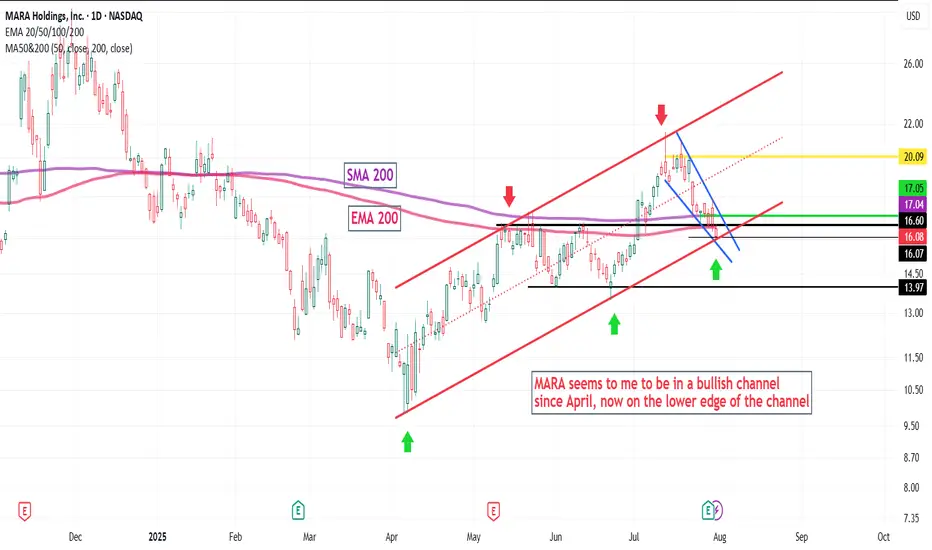
MARA in channelMARA seems to me to be in a bullish channel
since April, now on the lower edge of the channel
See all ideas
Summarizing what the indicators are suggesting.
Neutral
SellBuy
Strong sellStrong buy
Strong sellSellNeutralBuyStrong buy
Neutral
SellBuy
Strong sellStrong buy
Strong sellSellNeutralBuyStrong buy
Neutral
SellBuy
Strong sellStrong buy
Strong sellSellNeutralBuyStrong buy
An aggregate view of professional's ratings.
Neutral
SellBuy
Strong sellStrong buy
Strong sellSellNeutralBuyStrong buy
Neutral
SellBuy
Strong sellStrong buy
Strong sellSellNeutralBuyStrong buy
Neutral
SellBuy
Strong sellStrong buy
Strong sellSellNeutralBuyStrong buy
Displays a symbol's price movements over previous years to identify recurring trends.
MARA6153309
MARA Holdings, Inc. 2.125% 01-SEP-2031Yield to maturity
—
Maturity date
Sep 1, 2031
MARA5513953
MARA Holdings, Inc. 1.0% 01-DEC-2026Yield to maturity
—
Maturity date
Dec 1, 2026
US565788AG1
MARA Holdings, Inc. 0.0% 01-JUN-2031Yield to maturity
—
Maturity date
Jun 1, 2031
US565788AJ5
MARA Holdings, Inc. 0.0% 01-AUG-2032Yield to maturity
—
Maturity date
Aug 1, 2032
US565788AE6
MARA Holdings, Inc. 0.0% 01-MAR-2030Yield to maturity
—
Maturity date
Mar 1, 2030
See all 1MARA bonds
Curated watchlists where 1MARA is featured.


Frequently Asked Questions
The current price of 1MARA is 13.430 EUR — it has decreased by −1.12% in the past 24 hours. Watch MARA Holdings, Inc. stock price performance more closely on the chart.
Depending on the exchange, the stock ticker may vary. For instance, on MIL exchange MARA Holdings, Inc. stocks are traded under the ticker 1MARA.
1MARA stock has risen by 2.66% compared to the previous week, the month change is a −3.67% fall, over the last year MARA Holdings, Inc. has showed a −34.10% decrease.
We've gathered analysts' opinions on MARA Holdings, Inc. future price: according to them, 1MARA price has a max estimate of 24.04 EUR and a min estimate of 15.45 EUR. Watch 1MARA chart and read a more detailed MARA Holdings, Inc. stock forecast: see what analysts think of MARA Holdings, Inc. and suggest that you do with its stocks.
1MARA reached its all-time high on Jan 20, 2025 with the price of 20.660 EUR, and its all-time low was 8.800 EUR and was reached on Apr 4, 2025. View more price dynamics on 1MARA chart.
See other stocks reaching their highest and lowest prices.
See other stocks reaching their highest and lowest prices.
1MARA stock is 4.39% volatile and has beta coefficient of 1.88. Track MARA Holdings, Inc. stock price on the chart and check out the list of the most volatile stocks — is MARA Holdings, Inc. there?
Today MARA Holdings, Inc. has the market capitalization of 5.11 B, it has increased by 3.20% over the last week.
Yes, you can track MARA Holdings, Inc. financials in yearly and quarterly reports right on TradingView.
MARA Holdings, Inc. is going to release the next earnings report on Nov 5, 2025. Keep track of upcoming events with our Earnings Calendar.
1MARA earnings for the last quarter are 1.56 EUR per share, whereas the estimation was −0.06 EUR resulting in a 2.58 K% surprise. The estimated earnings for the next quarter are −0.05 EUR per share. See more details about MARA Holdings, Inc. earnings.
MARA Holdings, Inc. revenue for the last quarter amounts to 202.46 M EUR, despite the estimated figure of 193.48 M EUR. In the next quarter, revenue is expected to reach 220.19 M EUR.
1MARA net income for the last quarter is 686.11 M EUR, while the quarter before that showed −492.86 M EUR of net income which accounts for 239.21% change. Track more MARA Holdings, Inc. financial stats to get the full picture.
No, 1MARA doesn't pay any dividends to its shareholders. But don't worry, we've prepared a list of high-dividend stocks for you.
As of Sep 16, 2025, the company has 152 employees. See our rating of the largest employees — is MARA Holdings, Inc. on this list?
EBITDA measures a company's operating performance, its growth signifies an improvement in the efficiency of a company. MARA Holdings, Inc. EBITDA is −38.09 M EUR, and current EBITDA margin is −6.24%. See more stats in MARA Holdings, Inc. financial statements.
Like other stocks, 1MARA shares are traded on stock exchanges, e.g. Nasdaq, Nyse, Euronext, and the easiest way to buy them is through an online stock broker. To do this, you need to open an account and follow a broker's procedures, then start trading. You can trade MARA Holdings, Inc. stock right from TradingView charts — choose your broker and connect to your account.
Investing in stocks requires a comprehensive research: you should carefully study all the available data, e.g. company's financials, related news, and its technical analysis. So MARA Holdings, Inc. technincal analysis shows the sell today, and its 1 week rating is sell. Since market conditions are prone to changes, it's worth looking a bit further into the future — according to the 1 month rating MARA Holdings, Inc. stock shows the strong sell signal. See more of MARA Holdings, Inc. technicals for a more comprehensive analysis.
If you're still not sure, try looking for inspiration in our curated watchlists.
If you're still not sure, try looking for inspiration in our curated watchlists.