SMCI BUYBUY SMCI at 35.00 to 33.00, riding it back to 120.00 to 130.00 as Profit Targets, Stop Loss is at 27.00!
WARNING: This is only a journal of my opinion of the market and only for my journaling purpose. This information and publication are NOT meant to be, and do not constitute, financial, investment, trading, or other types of advice or recommendations. Trading any market instrument is a risky business, so do your own due diligence, and trade at your own risk. You can loose all of your money and much more.
Super Micro Computer, Inc.
No trades
Trade ideas

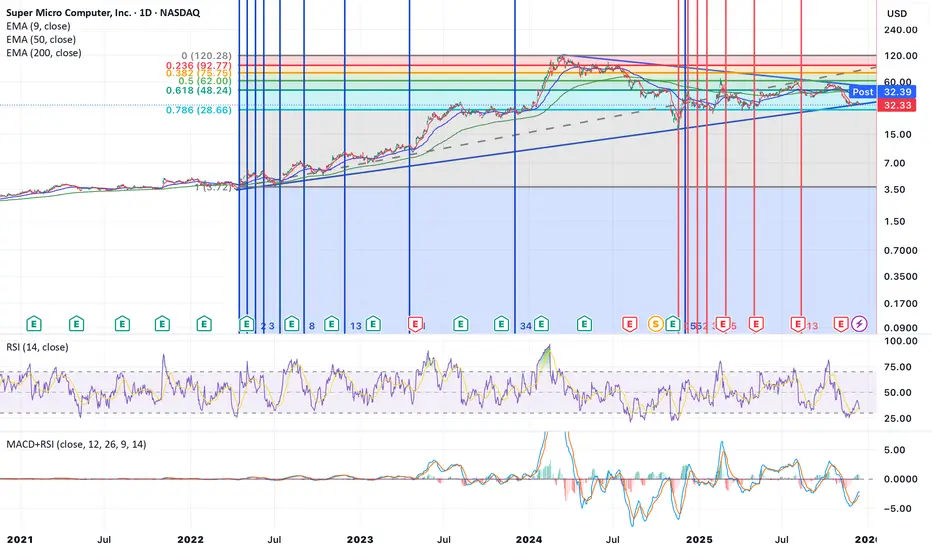
SMCI cools the servers while the market warms up expectationsSMCI continues to move inside an ascending channel and is currently trading in the buy zone between the 0.618 and 0.786 Fibonacci levels. Strong demand appears within this range and the ma200 adds structural support as a dynamic base. Weekly divergence indicates weakening selling pressure and increases the probability of a renewed upward cycle. As long as price holds above the ma200 and stays within the channel, the structure remains bullish with the next targets at 41.88 and later at 62.35.
Super Micro Computer remains one of the global leaders in artificial intelligence server infrastructure. As of December 4, trailing twelve month revenue stands near 14.9 billion dollars. Net income exceeds 850 million dollars and cash reserves remain above three billion dollars. The company expands production of liquid cooled systems and next generation platforms for advanced model training. Global demand for artificial intelligence compute capacity continues to strengthen revenue and support margins. Minimal debt levels provide stability during market volatility.
As long as price remains within the buy zone between the 0.618 and 0.786 levels and above the ma200, the bullish continuation scenario remains valid. A confirmed breakout opens the way toward 41.88 and later toward 62.35. Technical and fundamental signals currently align which increases the probability of a new upward wave.
Servers cool down slowly, but trends usually heat up faster, especially with charts like this.

Super Micro Computer, Inc. (SMCI)Technical Analysis (from your chart)
Trend & Structure
• The stock has been in a long-term uptrend since 2022 with several consolidation phases.
• Multiple support/resistance horizontals and trendlines are drawn — price currently sitting near a major support zone around ~$30–$35.
• Price oscillates around the 50 & 200 EMAs — often a sign of trend indecision or transition.
Oscillators
• RSI (14): currently mid-range — not strongly overbought or oversold, but recent downward bias suggests short-term bearish momentum building.
• MACD: recent signal line crossover indicates possible short-term relief bounce, but overall trend direction still unclear.
Key Levels
• Support: ~$30 (historical pivot, rising trendline)
• Resistance: ~$50–$55 (cluster of previous highs)
• Break above/below these could signal the next leg.
Short-Term Bias: Neutral to slightly bearish until confirmation above recent range high.
⸻
📈 Fundamental Snapshot
Valuation
• P/E (TTM): ~27–29x — moderately high relative to historical norms but not extreme for tech hardware. 
• Forward P/E: ~19–20x — suggests expected earnings growth priced in. 
Earnings
• EPS (TTM): ~1.25–1.67 (data vary slightly by source) 
• EPS recently declined year-over-year, reflecting tightening margins and cost pressures. 
Profitability & Other Ratios
• Profit Margin around ~4–5% — fairly slim for tech. 
• P/B: ~3.1–3.6, P/S: ~0.9–1.0 — moderate valuation relative to sales and book. 
Company Context
• Serves servers/storage for enterprise, cloud, AI & 5G. 
• Revenue growth and EPS have shown volatility due to demand cycles and cost pressures. 
⸻
📌 Trade-Ready Summary (Caption-Style)
SMCI – Super Micro Computer (NASDAQ)
Current Price: ~$32–33
P/E (TTM): ~27–29x
Forward P/E: ~19–20x
EPS: ~1.3–1.7
Key Support: ~$30
Key Resistance: ~$50–55
Tech View: Price holding long-term trend support; oscillators neutral to bearish short-term. Need break above recent range for bullish confirmation.
Fundamental View: Valuation reflects growth expectations but margins are thin; earnings have recently softened.
Bias: Neutral to cautious — trade range, watch breakout or breakdown.
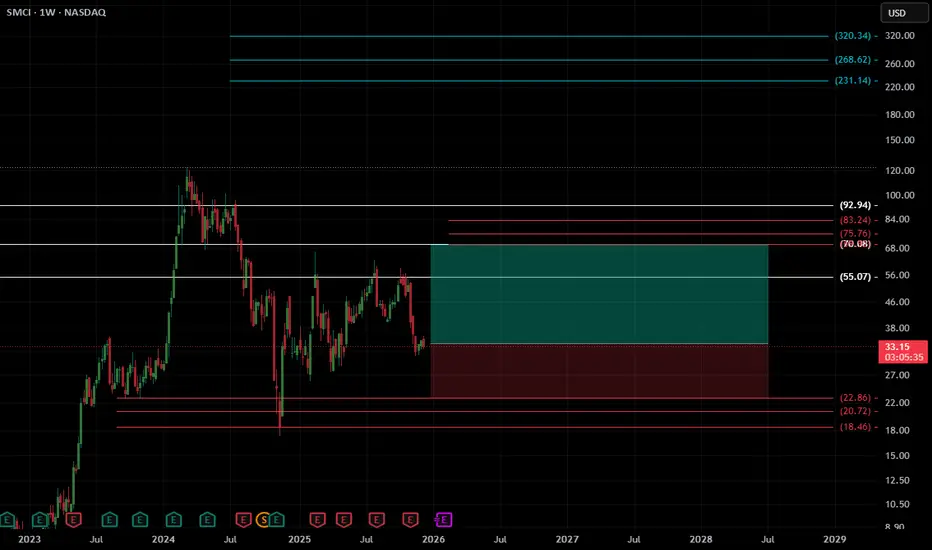
SMCI Weekly Rebound Setup (1W)SMCI has pulled back into a key higher-timeframe demand zone, where price has shown repeated reactions and absorption of sell-side pressure. After a long corrective phase, the weekly chart is now forming a potential base, suggesting the possibility of a broader recovery leg toward overhead inefficiencies.
Price is currently sitting at CMP, right on top of a structural support cluster that has historically launched strong rallies. With volatility compressing and wicks showing buyer defense, SMCI may be preparing for a macro rebound.
🔹 Entry: CMP
🔹 Target (TP): 69.65
🔹 Stop-Loss (SL): 22.95 (stop adding money here and wait)
This setup targets a move back toward the major weekly imbalance above, aligning with prior distribution structure and unfilled liquidity. A weekly close above 55–56 would strengthen the bullish case, potentially accelerating the move into the 70+ zone.
A breakdown below 22.95 would invalidate the idea and imply continuation of the larger downtrend.
Trade Management
Partial profits can be taken as price approaches 55–56, the first significant weekly resistance.
Momentum confirmation: a strong weekly close above 56 opens room for continuation toward 70+.
Hard invalidation: Weekly close below 22.95.
⚠️ Financial Disclaimer :
Not financial advice. Just chart art. If you go long because the lines look optimistic, SMCI may choose violence instead. Always DYOR and protect your capital.
$SMCI: high probability the $31 support fails.Bulls threw a decent punch but only managed to retrace a small part of the November downtrend – typically a bad look for the long side.
On top of that, the latest headlines out of NYSE:ORCL and NASDAQ:AVGO add more pressure to Super Micro’s outlook. Overall, the risk skew here still favors the bears.

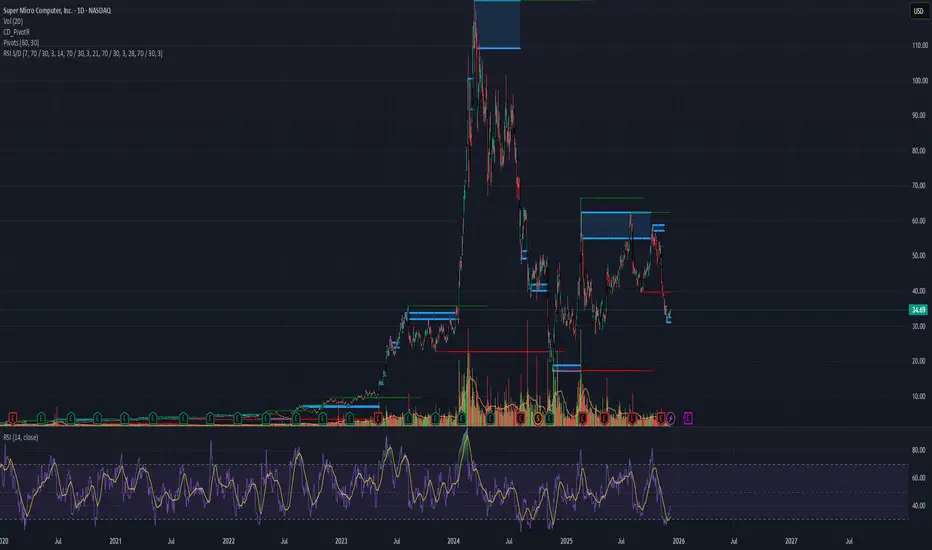
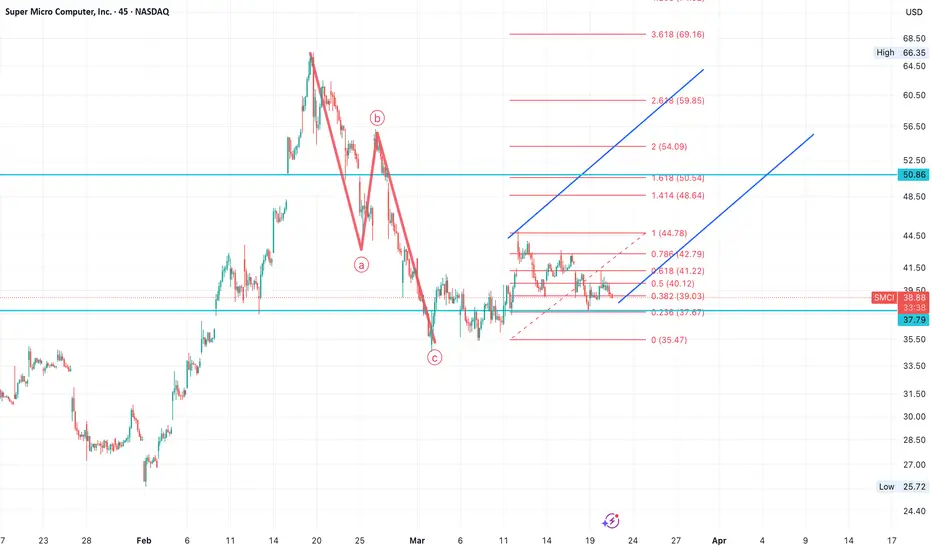
SMCI buyers coming in? Purely technical analysis (And an indicator that I have been working on for multi timeframe analysis). I see a bounce from previous support. Looks like it could be the start of a reversal after BOS to the upside.

Fast Bounce Setup | Price: 34.69 → Target: 36.42 (+5%)Fundamentals 📊
SMCI continues to show strong revenue and profit forecasts, supported by growing demand in AI servers and high-performance computing hardware.
The long-term outlook is strong, which also supports short-term bounce setups.
Repeated Behavior 🔍
Historically, SMCI has shown a clear behavioral pattern: after sharp pullbacks or oversold phases, it typically produces 5%–50% bounces before stabilizing.
The current structure matches those previous behavior cycles.
Price Action 🔥
Recent volume spikes and the pullback zone align with previous SMCI reversal phases.
Price is reacting at a familiar technical level where the stock has shown fast rebounds.
Entry: 34.69
Target: 36.42
Profit: +5% 💰⚡
This setup is based entirely on the repeated behavioral pattern of SMCI itself.
Each stock has its own cycle — we do not use one fixed formula.
All signals come from pure behavior analysis.
#BehaviorBasedTrading 🔍📈
Long $SMCIBuying low, hopefully sell high. Price at 200SMA weekly. there's is a big probability SMCI gets back up to the weekly 100SMA

Reverse Flag PatternAs Pattern is there bearish but impact may be reverse like,
26 key level. and as stop loss also.
cmp : 33.68
Target : 47,64,75
So, Reward is more than Risk
Manage your Risk .. Long view.
SMCI long-term TASMCI is a biggie, it was slammed pretty heavily after the recent earnings report and as of this moment mid-term is in heavy distribution, which seems like it's close to bottom out, yet weekly time frame uptrend is not ready yet but there's a positive divergence in accumulation.
In general, SMCI has a perspective for growth but it's broken yet, it needs more time to bottom out.

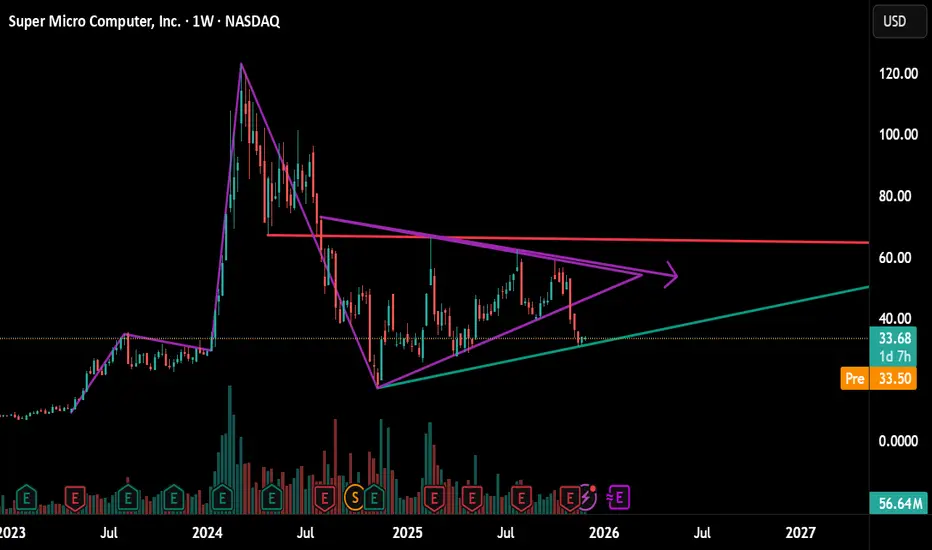
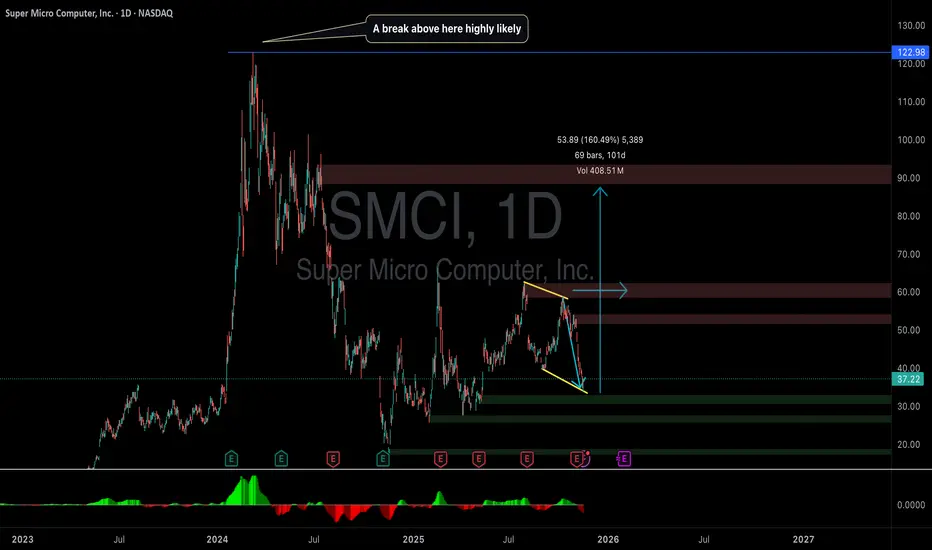
SMCI - Bull Flag Breakout SetupSMCI formed a strong bullish impulse followed by a bull flag pattern.
A breakout above the flag structure may signal continuation if confirmed with strong price action.
Trade Plan:
• Entry: On breakout or retest
• Stop Loss: Below flag support
• TP1: Recent high
• TP2: Measured flagpole extension
This setup is worth monitoring for potential bullish continuation.
Disclaimer: This is not financial advice. For educational purposes only.

SMCITake a close look at this long-term chart on a logarithmic scale. There are two distinct long-term bullish channels, as demonstrated by the different highlighted points. We are currently resting on the lower part of the steeper channel; we could even test the 27-28 levels, but I believe there will be room for a strong rally in the coming months. It could be broken by some corrective retracements, but I believe that those who start accumulating now are buying at very attractive prices.

SMCI - Caution! My target entry might surprise you!Most of retail is long (and bullish) on SMCI, seeing it as an "undervalued" golden ticket to NVDA-like riches.
I, however, am skeptical. Intentional liquidity does not lie - nor does supply and demand. So I'm not saying SMCI is doomed - rather, in order to continue a substantial and sustainable reversal, there are some attractive buyers in the $25-$27 range that could help create a much needed support base for SMCI going forward.
Targeting $25 in the near term with an entry on a clear red or purple rejection and LTF bearish liquidity building.
Please do your own research as any news can completely blow this thing up at any moment. I am approaching this potential trade with very limited risk and minimal time frame if it presents itself properly.
Happy Trading :)

Bullish Butterfly @$25 (OR) Double Bottom @$341st Scenario: SMCI forming a bullish butterfly(yellow lines) all the way down to point D (at $25 - 26) mark. I can see this happen if NVDA ER turns out bad, but if ER is good and Mr. HUANG FORCASTS a clear sky going into 2026, AI and tech's bearish trend could be over.
2nd Scenario: IF ER is astonshing, I see SMCI bounces back up - forming double bottom pattern(blue pattern) at $34 range - if you know what I mean.

SMCIWe are touching the long-term bullish trendline, below there is another very long-term bullish trendline with two open gaps, but in my opinion there is a greater probability of closing the gaps above towards 51 dollars.

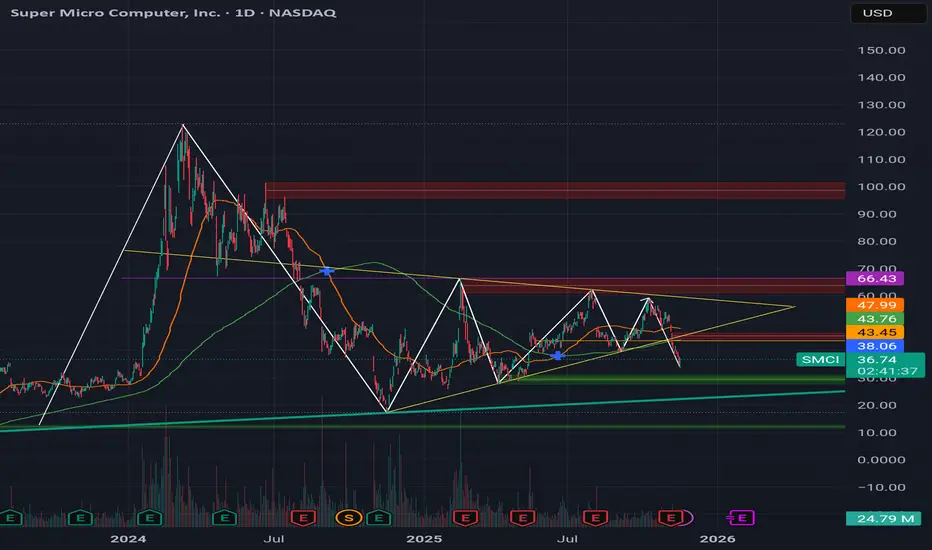
SMCI on a daily chart I see a HUGE symmetrical triangle pattern with a HUGE fakeout on a daily chart.
Past few years, SMCI has always been at its yearly lowest in November time frame, and then it shoots up towards the end of year. Check it out yourself.
Recent A.I. bubble fears have given us amazing discount (the huge fakeout).
I know SMCI almost always does not act accordingly to conventional analysis we anticipate and this time is no exception. If this heads lower again,- perhaps down to sub-$30(?), I am going to fully commit for Christmas present.
My target is $66 by the end of the year :)
Good luck out there, everyone.
Bullish Case for SMCI: Why the Next Big Move Could Be ExplosiveSuper Micro Computer (SMCI) remains one of the most powerful AI-infrastructure plays in the market, and the bullish setup going into the next quarter looks exceptional.
1. Next Quarter Revenue Forecast: $10B — Up 100% QoQ
Analysts expect SMCI to report $10 billion in revenue next quarter — a 100% jump from the previous quarter.
This kind of acceleration is extremely rare for a company of SMCI’s size.
A triple-digit quarter-over-quarter growth rate signals:
Surging demand for AI servers
Rapid expansion of hyperscaler orders
Strong execution in supply chain and delivery
SMCI taking meaningful market share from Dell, HP, and legacy OEMs
Wall Street absolutely rewards revenue hyper-growth like this.
2. AI Infrastructure Demand Is Exploding
AI training and inference workloads are scaling at a pace never seen before. Every major AI company is racing to expand server capacity, and SMCI has positioned itself as:
Faster than competitors
Cheaper to deploy
Highly customizable
NVIDIA’s preferred partner for next-gen GPU systems
As long as AI accelerators remain the hottest commodity in tech, SMCI remains at the center of that demand.
3. Margins Are Expanding With High-End Configurations
High-performance racks built around H100, H200, B100, and next-gen NVIDIA/AMD GPUs carry much higher margins.
More customers are upgrading to fully-integrated racks rather than low-tier components.
This means earnings could beat expectations, not just revenue.
4. SMCI Is Becoming a Core AI Index Play
Funds that want exposure to AI infrastructure don’t have many pure plays available. SMCI is now viewed as:
A backbone of AI datacenters
A beneficiary of every new GPU cycle
A growth stock with real earnings, not hype
This attracts institutional inflows during AI-sector rotations.
5. Technical Setup Supports a Bullish Breakout
Although volatile, SMCI consistently builds higher lows over time.
With a $10B revenue forecast ahead, sentiment could flip extremely fast.
A strong earnings beat + raised guidance can trigger:
A major gap-up
Short covering
Renewed momentum buying
Bottom Line
SMCI is entering one of the strongest growth phases in its history. With revenue expected to double next quarter, rapidly expanding AI demand, and improving margins, the setup is highly bullish.
If the company delivers anything close to the $10B forecast —
the stock could reprice sharply to the upside.
SMCI IS POPPING NOW !!! READ THE NARRATIVE The AI infrastructure boom is reshaping the global economy, and two companies—Super Micro Computer (SMCI) and NVIDIA (NVDA)—stand at the forefront of this transformation. Recent geopolitical and business developments, particularly President Donald Trump’s Middle East trip in May 2025 and Japan’s endorsement of SMCI for its sovereign AI installation, have significantly bolstered the growth prospects of both companies. In this article, I’ll analyze the impact of these deals, project new revenue streams for SMCI and NVDA, and make a compelling case for why their stocks are undervalued, supported by current price-to-earnings (P/E) ratios. This is a comprehensive exploration of why SMCI and NVDA are poised for explosive growth and why their stocks are a bargain for long-term investors.
Context: Trump’s Middle East Trip and AI Infrastructure Deals
In May 2025, President Trump embarked on a high-profile tour of the Gulf States—Saudi Arabia, Qatar, and the UAE—to strengthen U.S. technological and economic ties. The trip resulted in landmark AI infrastructure deals, positioning NVDA and SMCI as key beneficiaries as these nations pivot from oil-based economies to technology hubs. Key highlights include:
Saudi Arabia: Saudi Arabia committed $600 billion to invest in the U.S., with a significant portion allocated to AI infrastructure. NVDA secured a deal to supply “several hundred thousand” of its advanced Blackwell AI chips to Saudi Arabia’s Humain project, while SMCI signed a $20 billion multi-year partnership with DataVolt to deliver ultra-dense GPU platforms and liquid-cooled rack systems for hyperscale AI campuses in Saudi Arabia and the U.S.
Qatar and UAE: While specific deals for NVDA and SMCI in Qatar and the UAE were less detailed, the broader context suggests technology partnerships, with Qatar Airways ordering Boeing planes, indicating a wide-ranging economic collaboration likely including tech infrastructure.
Tech Conferences and Sentiment: The trip coincided with events like the Saudi-US Investment Forum, where NVDA’s CEO Jensen Huang and SMCI’s CEO Charles Liang were prominent figures, reinforcing their leadership in AI. Market sentiment, reflected in posts on X, shows strong enthusiasm, with NVDA and SMCI stocks surging post-announcements.
Additionally, Japan’s decision to select SMCI for its sovereign AI installation is a massive endorsement. As one of the most technologically advanced nations after the U.S., Japan’s preference for SMCI’s liquid-cooled, AI-optimized servers over competitors like Dell or HP underscores SMCI’s technological edge, particularly in energy-efficient data center solutions.
These developments position SMCI and NVDA as critical players in a global AI infrastructure surge, with the Middle East and Japan emerging as pivotal markets.
Revenue Projections and Growth Infused by the Deals
To quantify the impact, let’s compute new revenue projections for SMCI and NVDA, focusing on the incremental growth from these deals. I’ll assume that a significant portion of NVDA’s high-performance chips (e.g., Blackwell GPUs) will be integrated into SMCI’s servers, given their long-standing partnership and SMCI’s dominance in liquid-cooled AI server solutions.
Super Micro Computer (SMCI)
Current Revenue Baseline:
SMCI reported $14.94 billion in revenue for fiscal year 2024 (ended June 30, 2024) and guided for $21.8 billion to $22.6 billion in fiscal year 2025.
For fiscal Q3 2025 (March 2025), SMCI guided revenue of $5 billion to $6 billion, and for Q4 2025 (June 2025), $5.6 billion to $6.4 billion.
SMCI’s long-term goal is $40 billion in revenue by fiscal year 2026 (ending June 30, 2026).
Impact of Saudi Deal:
The $20 billion DataVolt deal is multi-year, likely spanning 2025–2028, with an estimated annual revenue contribution of $4 billion to $6.7 billion (assuming 3–5 years).
This deal alone represents nearly 100% of SMCI’s 2025 consensus revenue, significantly boosting its growth trajectory.
SMCI expects to earn $200 million in annual EBIT from this deal, implying strong profitability despite margin pressures from competition.
Impact of Japan’s Sovereign Installation:
While specific financial details are unavailable, Japan’s choice of SMCI for its sovereign AI infrastructure suggests a multi-billion-dollar contract, given the scale of national AI projects. Japan’s AI investments are part of a broader push to compete with the U.S. and China, with budgets in the tens of billions. Let’s conservatively estimate $2 billion in revenue over 2025–2027, or $500 million to $1 billion annually.
Other Growth Drivers:
SMCI’s partnerships with NVDA and Fujitsu, along with its leadership in liquid-cooled servers (80% market share), position it to capture a growing share of the $133.3 billion global server market in 2025, potentially increasing its market share from 12.7% in 2024 to 22%.
SMCI’s Q2 2025 revenue was $5.65 billion, with AI-optimized infrastructure accounting for 70% of sales, indicating robust demand.
New Revenue Projection for FY 2025:
Baseline FY 2025 guidance: $21.8 billion to $22.6 billion.
Saudi deal contribution (2025 portion): $2 billion (conservatively assuming partial deployment in 2025).
Japan deal contribution: $500 million.
Organic growth from existing markets: Assume $1 billion from increased market share and demand.
Total FY 2025 Revenue: $25.3 billion to $26.1 billion (a 69%–75% increase over FY 2024’s $14.94 billion).
Growth Infused by Trump’s Trip:
The Saudi deal adds $2 billion to 2025 revenue, representing an 8%–9% uplift over the original guidance.
Japan’s endorsement enhances SMCI’s credibility, likely driving additional contracts globally, contributing $500 million (2% uplift).
Combined, these deals infuse 10%–11% additional growth for FY 2025, with further upside in 2026 as SMCI targets $40 billion.
NVIDIA (NVDA)
Current Revenue Baseline:
NVDA guided for $24 billion in revenue for Q1 FY 2025 (ended April 2025), a 300% year-over-year increase.
For FY 2025 (ending January 2025), analysts estimated $103 billion in revenue, driven by data center GPUs like Hopper Craig and Blackwell.
NVDA’s data center segment, which includes AI GPUs, grew 16% quarter-over-quarter in January 2025, with Blackwell GPUs constituting 31% of revenue.
Impact of Saudi Deal:
NVDA’s deal to supply “several hundred thousand” Blackwell GPUs to Saudi Arabia’s Humain project is massive. Assuming 300,000 GPUs at an average price of $30,000 each (based on Blackwell pricing estimates), this deal could generate $9 billion in revenue.
Spread over 2025–2027, this implies $2 billion to $3 billion annually, with $2 billion likely in FY 2026 (ending January 2026).
Other Middle East Deals:
Qatar and UAE deals are less quantified, but given NVDA’s global demand, assume an additional $1 billion in 2026 from these regions.
Other Growth Drivers:
NVDA’s backlog for Blackwell GPUs is oversubscribed, with hyperscalers and sovereign entities driving demand.
SMCI, NVDA’s third-largest customer, integrates NVDA GPUs into 70% of its servers, amplifying NVDA’s revenue as SMCI grows.
Japan’s AI push likely includes NVDA GPUs, given SMCI’s reliance on them. Estimate $500 million in additional revenue for 2026.
New Revenue Projection for FY 2026:
Baseline FY 2026 revenue (analyst consensus): $125 billion (assuming 20% growth over FY 2025’s $103 billion).
Saudi deal contribution: $2 billion.
Qatar/UAE contribution: $1 billion.
Japan contribution (via SMCI): $500 million.
Total FY 2026 Revenue: $128.5 billion (a 25% increase over FY 2025).
Growth Infused by Trump’s Trip:
The Saudi deal adds $2 billion, or 1.6% uplift to FY 2026 revenue.
Qatar/UAE and Japan add $1.5 billion, or 1.2% uplift.
Combined, these deals infuse 2.8% additional growth for FY 2026, with potential for more if Middle East investments accelerate.
Case for SMCI and NVDA Stocks Being Undervalued
Both SMCI and NVDA are trading at valuations that significantly undervalue their growth potential, particularly given the transformative impact of the Middle East deals and Japan’s endorsement. Below, I outline why their stocks are cheap, supported by P/E ratio calculations and qualitative factors.
Super Micro Computer (SMCI)
Current Valuation and P/E Ratio:
As of May 16, 2025, SMCI’s stock price is approximately $46.14.
For FY 2025, SMCI’s guidance for earnings per share (EPS) is not explicitly stated, but preliminary Q2 2025 results suggest $0.29–$0.31 EPS.
Assume FY 2025 EPS of $1.20 (based on Q2 and Q3 guidance and historical growth). With a stock price of $46.14, the forward P/E ratio is:
Analysts project 2028 EPS at $5.11 (based on SMCI trading at 9x 2028 forecasts).
Why SMCI is Undervalued:
Explosive Revenue Growth: SMCI’s revenue grew 74.5% annually over the past three years, and the Saudi deal and Japan’s endorsement could push FY 2025 revenue to $25.3–$26.1 billion, a 69%–75% increase. The $40 billion target for FY 2026 implies 77% growth over 2025. This growth rate far exceeds the S&P 500’s average, yet SMCI’s forward P/E of 38.45 (and 9.03 for 2028) is modest for a hyper-growth tech stock.
Undervalued Relative to Peers: SMCI’s P/E of 38.45 is significantly lower than NVDA’s and other AI infrastructure players like Broadcom (AVGO, P/E ~70). Given SMCI’s 70% AI-driven sales and leadership in liquid cooling, it deserves a premium valuation.
Japan’s Endorsement: Japan’s choice of SMCI for its sovereign AI installation validates its technological superiority. As a leading tech nation, Japan’s decision could lead to further contracts in Asia and Europe, driving upside beyond current forecasts.
Saudi Deal’s Transformative Impact: The $20 billion DataVolt deal is nearly SMCI’s entire 2025 revenue, providing multi-year visibility and supporting upward estimate revisions. Analysts like Raymond James see SMCI as a “near-pure-play on AI,” with a $41 price target (11% upside from $46.14).
Margin Expansion Potential: Despite recent gross margin declines (11.9% in Q2 2025 vs. 16.7% in Q1 2024), SMCI’s operating margin expanded from 3% to 8.5% since 2020. Optimized pricing and scale from new deals could restore margins, boosting EPS and justifying a higher P/E.
Accounting Overhang Clearing: SMCI faced scrutiny from a 2024 Hindenburg Research report alleging accounting irregularities, but it filed delayed SEC reports by February 25, 2025, avoiding delisting. With a new auditor (BDO) and cleared regulatory hurdles, investor confidence is rebounding.
Price Target: Analysts suggest SMCI could trade at 30x 2028 earnings ($5.11), implying a price of $153.30—a 232% upside from $46.14. A conservative 20x P/E yields $102.20 (121% upside).
NVIDIA (NVDA)
Current Valuation and P/E Ratio:
As of May 16, 2025, NVDA’s stock price is approximately $105 (post-2024 price adjustments).
For FY 2025, NVDA’s adjusted EPS is estimated at $2.70 (based on $5.50 Q1 EPS forecast and analyst consensus).
For FY 2026, assume EPS of $3.24 (20% growth). The forward P/E is:
Why NVDA is Undervalued:
Unmatched AI Dominance: NVDA controls 80%–90% of the AI GPU market, with Blackwell GPUs driving 31% of Q1 2025 data center revenue. Demand is backordered, and deals like Saudi Arabia’s ensure sustained growth.
Middle East Catalyst: The Saudi deal ($9 billion over 2025–2027) and potential Qatar/UAE contracts add 2.8% to FY 2026 revenue, with upside if more nations invest. NVDA’s ability to court global leaders (e.g., China, Japan, D.C.) mitigates trade risks.
SMCI Synergy: As SMCI’s third-largest customer, NVDA benefits from SMCI’s growth, with 70% of SMCI’s servers using NVDA GPUs. SMCI’s $20 billion Saudi deal and Japan contract indirectly boost NVDA’s chip sales.
Margin Strength: NVDA’s operating margin expanded from 35% in 2020 to 54% in FY 2024, far surpassing SMCI’s 8.5%. This profitability supports reinvestment and resilience against tariffs.
Undervalued Growth: NVDA’s P/E of 38.89 (FY 2025) and 32.41 (FY 2026) is reasonable for a company with 300% Q1 2025 revenue growth and a $128.5 billion FY 2026 projection. Tech peers like Tesla (P/E ~100) trade at much higher multiples.
Geopolitical Shelter: Trump’s temporary exemption of GPUs from tariffs protects NVDA’s supply chain, unlike other tech firms facing 5%–25% cost increases.
Price Target: If NVDA trades at 50x FY 2026 EPS ($3.24), the price target is $162—a 54% upside from $105. A conservative 40x P/E yields $129.60 (23% upside).
Risks and Counterpoints
While the bullish case is strong, investors should consider potential risks:
SMCI:
NVDA:
Despite these risks, both companies’ fundamentals and deal-driven growth outweigh concerns, with SMCI’s valuation particularly attractive.
Conclusion
SMCI and NVDA are at the epicenter of the AI infrastructure revolution, with Trump’s Middle East trip and Japan’s endorsement catalyzing their growth. SMCI’s $20 billion Saudi deal and Japan contract could push FY 2025 revenue to $25.3–$26.1 billion (10%–11% uplift), while NVDA’s Saudi and regional deals add 2.8% to its $128.5 billion FY 2026 projection. Their forward P/E ratios—38.45 for SMCI (9.03 for 2028) and 38.89 for NVDA (32.41 for 2026)—are low relative to their hyper-growth profiles, making them compelling buys. SMCI’s leadership in liquid cooling and NVDA’s GPU dominance, amplified by global AI demand, suggest 121%–232% upside for SMCI and 23%–54% for NVDA. For investors seeking exposure to the AI megatrend, SMCI and NVDA offer unmatched value and growth potential. Now is the time to invest in these undervalued giants shaping the future of technology.

A Quintillion Reasons to Invest: N^18 SMCI + NVDAA Quintillion Reasons to Invest: SMCI and NVIDIA Propel Walmart and Global Industries to Trillions March 20, 2025
In the realm of investing, capital allocation reigns supreme—a disciplined endeavor to direct resources toward opportunities that maximize returns while minimizing systemic risk. In today’s data-driven global economy, Supermicro (SMCI) and NVIDIA (NVDA) have emerged as the vanguard of computational supremacy, delivering a transformative edge through their latest technological innovations. Their GB300 NVL72 systems, paired with NVIDIA’s Blackwell Ultra GPUs, harness the power of N^18 computation—one quintillion operations per second—a feat unattainable just one week prior. This seismic shift, a $10 billion investment in hardware, redefines what industries can achieve, unlocking trillion-dollar opportunities across sectors and geographies.
Consider Walmart as a case study in this revolution. By deploying $500 million in SMCI and NVIDIA technology, Walmart can predict consumption patterns with unparalleled precision. Imagine a 15% spike in grill sales when temperatures reach 75°F—Walmart, armed with this foresight, negotiates industrial capacity at 20% lower rates, widens profit margins by 3 percentage points, and captures an additional $2.5 billion in annual profits. This predictive power allows Walmart to secure aluminum futures at $2,500 per ton during a 90°F heatwave, producing 10 million soda cans preemptively and seizing $50 million in sales before competitors can react. Without this technological edge, Walmart would be left scrambling, ceding market share to rivals who act faster. The numbers are stark: a modest $500 million investment yields billions in returns, a testament to the power of computational foresight.
This advantage scales globally with staggering implications. If 50,000 retailers worldwide adopt this $25 billion technology, each could realize $50 million in annual profit gains, culminating in an aggregate of $2.5 trillion. Supply chains across the globe arbitrage this predictive capability, turning data into cash. For instance, anticipating a surge in yoga gear demand post-New Year’s, retailers can flood warehouses ahead of time, capturing market share and boosting margins while competitors lag. This isn’t mere speculation; it’s a calculated strategy rooted in the unprecedented computational might of SMCI and NVIDIA. Without their systems, industries remain tethered to petascale limitations—10^15 operations per second—incapable of processing the trillion-parameter models that modern AI demands. Legacy systems falter, unable to match the data velocity and volume required for market dominance.
The implications of N^18 computation extend far beyond retail, shattering barriers that confined industries just days ago. A week prior, trillion-parameter models overwhelmed even the most robust systems, stalling at petascale thresholds and requiring weeks to process. Now, SMCI and NVIDIA’s N^18 capacity completes these tasks in hours, delivering real-time insights that redefine operational efficiency. Financial institutions, for example, can now model quadrillion-variable risk scenarios, identifying potential missteps and saving $1 billion annually in losses. Governments leverage this power to optimize traffic grids across 1,000 cities, reducing commute times by 15% and saving $500 million in fuel costs each year. These feats were pipe dreams last week, as systems buckled under the sheer deluge of data. Today, they are reality, driven by the $10 billion hardware investment in SMCI and NVIDIA technology—a catalyst for trillion-dollar value creation.
This computational revolution is not a race of abstract metaphors but a winner-takes-all contest defining our era. SMCI and NVIDIA are the architects of this new paradigm, their synergy transcending mere assembly. NVIDIA’s Blackwell Ultra GPUs, wielding quintillions of calculations per second, provide the raw horsepower, while SMCI’s advanced server and rack architecture integrates this power into a cohesive, exascale-capable system. Together, they form a technical triumph, enabling industries to surpass petascale bottlenecks and pioneer an AI-driven future. Their partnership is the backbone of progress, from autonomous vehicle fleets to real-time financial forecasting. For instance, Visa can now mine trillions of transactions to predict a surge in energy drink purchases by teens at 80°F, dispatching timely incentives and steering commerce, while preemptively optimizing supply chains for the next demand wave. Legacy systems, noting only “coffee on Mondays,” cannot compete with this granularity.
The stakes are unequivocal: align with SMCI and NVIDIA, or risk irrelevance. Shorting these titans is folly—only the boldest speculators dare, and history shows their fate: capitulation, fueling monumental returns for those who invest wisely. The numbers speak volumes: a $10 billion investment in SMCI and NVIDIA hardware unlocks trillions in value, from supply chain foresight to policy efficiency. This advantage permeates every sector—logistics and operations management globally reap billions in savings, while governments enhance efficiency, saving billions in public expenditure. The first movers triumph, as seen in the financial sector: should Visa adopt this technology before Amex, Amex becomes the short, Visa the long, and vice versa. This dynamic extends beyond retail and finance, touching all competing interests solving equations with exponentially more variables.
Investors, the directive is clear: capital must flow to those addressing existential needs. SMCI and NVIDIA are not optional; they are the drivetrain of a scalable tomorrow. Their combined infrastructure, with 72 Blackwell GPUs, 36 Grace CPUs, and NVLink precision, forms a singular intellect in a liquid-cooled rack, eclipsing petascale relics that once drained power across vast footprints. This technology pioneers AI’s frontier—self-driving cars, adaptive robotics, even self-authored films—unlocking trillion-dollar prospects. Allocate resources to this power, or watch others claim the windfall. Capital allocation demands no less.
SMCI FOMO for longs, pure terror for shorts—ALERT!!!SMCI SuperMicro Alert !!! sooo Urgent - don't miss it
Greed rules the world, baby! FOMO for longs, pure terror for shorts—ALERT!!! Dump all metals NOW, pile into equities. High Beta or bust—High Tech only. Move FAST, minutes not hours, that’s my hot tip (wink wink). SMCI’s the play—not Tesla—oversold, over-shorted, tiny float, primed for a $20, $30, even $60 rip in ONE swing. Double, triple your cash, EASY. Took just $200M to tank it from $130 to $39—chump change. Same fireworks coming on the way up. Liquidity’s a joke—penny stock vibes with monster upside. Multi-X move is HERE. Shhh… tell only your greediest pals. This post vanishes soon—pass it on!
This is the advice I gave to myself... To each its own, as the frog said wanting to get married.
Disclaimer: This information is compliant with Standard III(A) of the CFA Institute Code of Ethics and Standards of Professional Conduct.

SMCI is crawling toward its 39-41$ supportstrong support around 39-41 usd. this is the range to place buy orders

I'M GETTING READY TO LOAD UP ON SMCISMCI gaps down for a long awaited correction. earning were not so good but this stock has a history of reacting badly to ER and than recovering. NOTE that the company is growing just not as the wallstreet analysts want it to. im getting my shares off this discount. SEE YOU BACK ON 53$!!

New Setup : $SMCIThe hourly chart sees a good bullish crossover with a tight box after our bullish alert.
Ready to catch the new high !
