Virgin Galactic Holdings Inc
No trades
Trade ideas

SPCE: Playing the GapsThis chart shows recent gaps with more than 20% in magnitude and what happened next within 1 to 3 months afterward. In average, we have seen about 65% upward movement in that time frame. One interesting fact is the decreasing timeline as the stock gains popularity. The first gap took 125 days, the second gap took 49 days, and the third gap took 22 days to max out their potential. Also, the percentage change also increase from 63 to 65 and 73 over time. So will latest gap on May 24th 2021 max out sooner than 1 month and will it go higher than +73%? We shall see if the history of SPCE breakaway gaps keep repeating themselves.


SPCE TO $32?SPCE has Finally closed above resistance on the daily timeframe . And with a STRONG bullish Hammer on the daily yesterday. We can expect a healthy pullback to the daily Support (that was ONCE resistance) and continue heading up with STRONG and Concise bullish sentiment.

Zoom out! SPCE has lots of room to go!Based on the current situation one could come to the conclusion that this chart is clearly headed towards 35 and 42 Dollar targets.
Good luck!


SPCE - strong reversalAfter the successful flight the downtrend is broken
We have here reversal from a strong level on volume + short squeeze

Virgin Galactic rocket ready for takeoff!As we can see, Virgin Galactic shares fell to $ 14.5, but over the weekend Virgin Galactic announced the successful launch of its rocket. The tests went very well. Thanks to the news, Virgin Galactic stocks went up. Barring bad news, stocks are guaranteed to rally, but real gains will follow after their first tourist flight.
If you like the idea, subscribe and like it.
Good luck and big profits.


Clear example of Market ManipulationThis could be done by:
Algorithms
Hedge Funds
Individuals
Most Probable Scenario : Hedge Fund using Algorithmic trading
Trading value at the top of the channel is 11.1 million dollar in both case and happened in first 30 minutes of the market..!
Only a fool would not consider this as market manipulation!
Moshkelgosha

The rocket can now got till 36$After the successful start, a 36$ target can now be possible and starting a new uptrend for this year!

$SPCE Short Squeeze (Technical Analysis Breakdown)$SPCE Short Squeeze rumors after the successful launch for Virgin Galactic

VIRGIN GALACTIC-SPACE TOURISMThe spaceflight company is developing commercial spacecraft and aims to provide suborbital spaceflights to space tourists. With their successful flight on 22-05-2021, we should see rise in the stock price as demand for space tourism accumulates.

$SPCE Virgin Galactic - Traded Near Support, Reclaimed Line A_B$SPCE Virgin Galactic 🚀 - traded down to test horizontal support before seeing some buying interest. Up 18% in in pre-market, following it's +14% jump last week Thursday. Line A_B reclaimed.
Original idea flagged on socials 04-may.

Daily chart looks extremely bullishStrong pre-market after the news.
I colored the next resistances.
Lot of people going to FOMO, I would stay away for a while and wait for a backtest.
SPCEGood news helps but things look good here. I grabbed June calls a week ago or so. Looking for a good week...

SPCE: Attention, this is BIG!Mission accomplished! VG finally made their first flight into the space and back on earth, successfully.
Back in January 2021, SPCE went up almost 170% with just the rumor of this flight.
Let's see how high it goes now!
Target: $50

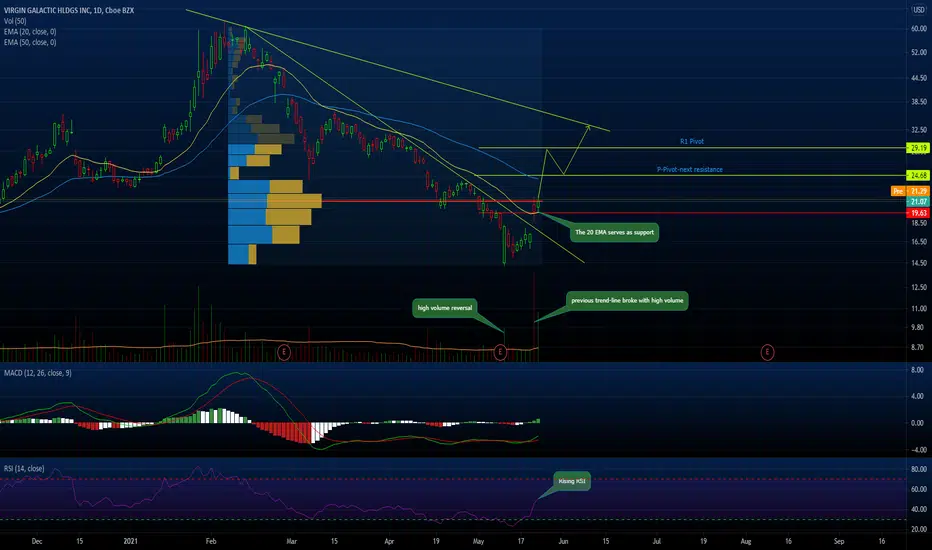
SPCE Virgin Galactic Broken down 7 different ways no indicators You don't need fancy indicators, algos, AI, Bobs approval from down the street, or even that one kid who made 100k and lost it all on WKHS meme stocks, (because he doesn't know how to trade) to tell you what's going on. You don't need news or to find a lucky penny, you can even let the rabbits keep their feet. I broke this down into 7 different ways you can look at this chart. I am not even using the indicatiors I have on there.
1-3 is a break down of trend lines and how price follows breaks and comes back to an area to give you Three ways you can find a way into this stock.
(3. being the safest place to enter any trade)
4. Is using an old trend line and identifying exactly where we are today on that trend and what was the result. Does it respect the Trendline? Does it ignore it?
5. Is taking price actions new angle being formed after it has come back down to its old trendline. Drawing a upward trendline to predict the high on any given day and what to anticipate from it moving forward.
6-7. is a break down of Wyckoff methodology accompanied with the Curves Stages (My own personal brain child) paired together to give a reference as to where Institutional buying is present.
Also take note that this is done a Daily Chart which will result in better movements into the directions you are wanting to follow this into. You can do this on a 15 min chart but it will result in smaller moves.

