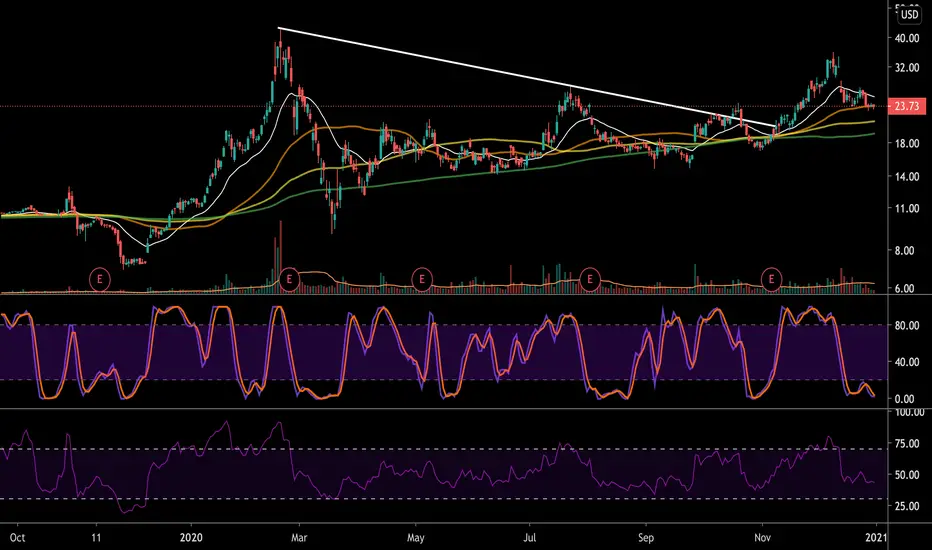
SPCE Finished CorrectionSpce looks to be forming an inverse head and shoulders after falling in the 0.5 to 0.618 retracement zone after it's initial impulsive move. Look for break or retest of trendline
Virgin Galactic Holdings Inc
No trades
Trade ideas


ABC BullishPrice is oushing down on C
As a rule a good place for a stop is under C. I looked and SPCE has hit 22.88 today but did not go lower
A= 17 and B = 35.82
Targets are calculated using AB leg and fib levels.
C can not go below A in this pattern
Not a recommendation

Bearish SPCE Chart Bearish SPCE as much as i am bullish on the chart i will never learn from my mistakes same exact set up BABA had that fooled me once but not again, Bearish trend-line that isn't close to breaking at all looking like a descending triangle as well, last 2 week of DEC i also saw these smaller companies get less flow into them as tech, it might be because low volume or my little theory on more money flowing into tech as we been seeing them make a move, higher risk but i see no reason to be bullish again until a launch of some sort (catalyst) not ultimate as i am not confident as this one as the others

[SPCE] Touchdown SOON Before Next LAUNCH!Unloading half my stake over 4 trades at average 33 worked out quite well with Price Action completing the expected mean reversion.
I have expanded the original Value Channel (magenta) by 3x now because Price Action is holding to the uptrend very strong and I do anticipate that to continue for years. Any BUY in the Value Channel likely to be good for a solid intra-year swing trade.
I'm very tempted to start scaling back in and will if I see signs of a trend reversal here but for now especially within the overall market conditions for the next couple weeks, I'm expecting a strong chance we can load up in the Value Channel again.
Will preferably start scaling back in on a green line X and each subsequent line X after that with a capstone bet as the trend reverses or before a big event.

SPCE VirginHello receive a cordial greeting, and a thriving 2021 our wishes are that 2021 will be a fantastic year in all aspects for all people.
We believe that this action has a great bullish journey based on Technical and Fundamental Analysis. But this is not financial advice
We have as resistors the key levels of 31, to consolidate it, 35 and 37.
and as resistors the levels of 17, 15 and 12. Also on the chart there is a blue circle, it represents a GAP, this is :
Gaps are areas on a chart where the price of a stock (or another financial instrument) moves sharply up or down, with little or no trading in between. As a result, the asset's chart shows a gap in the normal price pattern. The enterprising trader can interpret and exploit these gaps for profit.
Greetings and best wishes for 2021 L.E.D
In Spain as of 12/31/2020

JUST A THOUGHT.This is not financial advice, just an idea. I think price should appreciate around these levels near the arrows.
good luck traders!

Long for SPCE - 1d price chart with 50 day moving average** Disclaiming I'm a massive supporter of SPCE and i'm holding this stock for the next 10+yrs **
Looking at the day chart and a 50 day moving average we are bang on the moving average price.

SPCE Wave 2 Correction $SPCE finished with a daily pin bar signaling sellers may be exhausted. A corrective zig-zag into the .618 retracement, which coincidence with daily support/resistance levels. Waiting for break or retest of top trendline with high relative volume.


SPCE BUY POINT AND FLOORQuick idea of what SPCE could do. I am looking to the MA,8,9 and 20,focusing on a short trade where SPCE could rebound at the level of the 22 dollars. As first objective I will have 30. We must keep looking for any drastic changes.

SPCE update Spce has a little more to drop looking for a bounce at 22.68 was to focused on my minor count in my previous charts, under 21.35 I would cut short term options but good area to add long term shares. Spce is a great company and has potential to run over ATH but this is al on speculation next space launch date is announced early next year. Keep in mind this could really mean we wont get a launch till mid or late 2021. But If history repeats we will run. Take a look at the last time Spce was at 20 and announced launch date

$SPCE pitchfork and fib based target timingIf pitchfork holds true . We could see $SPCE in the 50s before March.


Ultimate SPCE Chart Warning Extreme Bullish Chart seeing a frying pan set up as well as a potential Inverse head and shoulders combine with the DOUGIEEEE DDDDDD wick and a early on wave count

SPCE super bulllishSPCE in my minor correction wave 2, watching for breakout of 27.52, measuring a breakout to fill the gap at 31.71. Under 23.79 I would cut for short term options. Shares are good to add here as well.
Playing this on speculation we get a second launch date early 2021


Large cup with handle and wedge. If SPCE can be at 30$ by EOY then our chart will look to follow a large cup with handle pattern and possibly test upper wedge area.

$SPCE Aspirational Bull Count$SPCE is a little too young to start calling cycles and primaries, but based on the data we have so far, there is some indication that we're in a primary 3 with significant upside. I'm bargain hunting for a few long dated OTM calls. This feels like more of a flier than a sound investment, though.

SPCE load shares and leapsSPCE after a failed launch and Chairman selling millions of shares, SPCE is back at a good price to buy. The chairman still has good faith in the future and is committed to the company. We could see next space launch early next year and if we run up the way it did last time, SPCE will be back at ATH again.
Support: 24.30, 19.78
Resistance: 27.55, 32.04
