$SPOT Earnings Report and Technical Analysis OverviewSPOT Delayed Earnings Move
Earnings Report Summary
On the morning of November 4, 2025, Spotify Technology S.A. (SPOT) announced its earnings results for the third quarter, surpassing market expectations. The company reported earnings of $3.83 per share, notably higher than the consensus estimate of $1.87 per share. Revenue reached $4.99 billion, beating the expected $4.89 billion. This represented a 104.81% outperformance on earnings and a 13.93% increase in revenue year-over-year, with earnings growth at 140.9%. Despite this strong performance, Spotify provided guidance for fourth quarter revenue at approximately $5.17 billion, which is below the current consensus estimate of $5.32 billion for the period ending December 31, 2025.
Technical Analysis
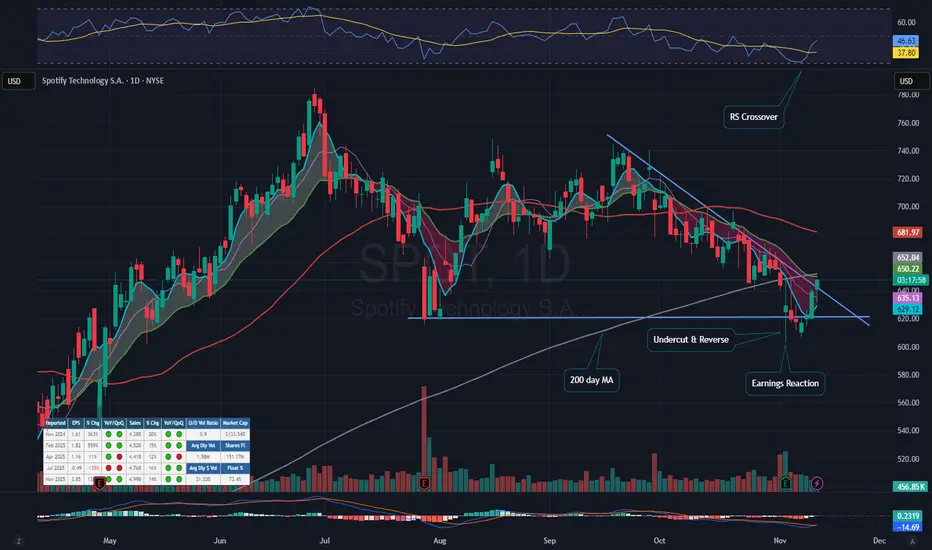
Since mid-September, SPOT shares have been in a downtrend. A downward line of resistance had been identified, and as of today, the stock has broken above it. This movement also appears to form an undercut and rally pattern. However, several technical hurdles remain. Notably, the stock has not yet established a higher low or a higher high, which are key signals needed to confirm a reversal of the downtrend. Additionally, SPOT is currently trading below its 21-day exponential moving average (EMA), 50-day moving average (DMA), and 200-day moving average (DMA).
Criteria for Reversal Confirmation
While there are signs that a reversal may be underway, further evidence is required. The first indication would be the formation of a higher low, suggesting some retracement without returning to recent lows. Following this, the stock would need to move above both the 21 EMA and 200 DMA. Should these milestones be reached, it could present a favorable risk-reward trading opportunity, with a stop loss placed just below the most recent established low.
Investment Considerations
SPOT may be worth adding to your watchlist, though the current setup does not yet meet the criteria for action under this trading strategy. It is important for readers to conduct their own analysis and consistently apply personal trading rules. All investments involve risk, and informed decision-making is essential when committing capital.
Trade ideas
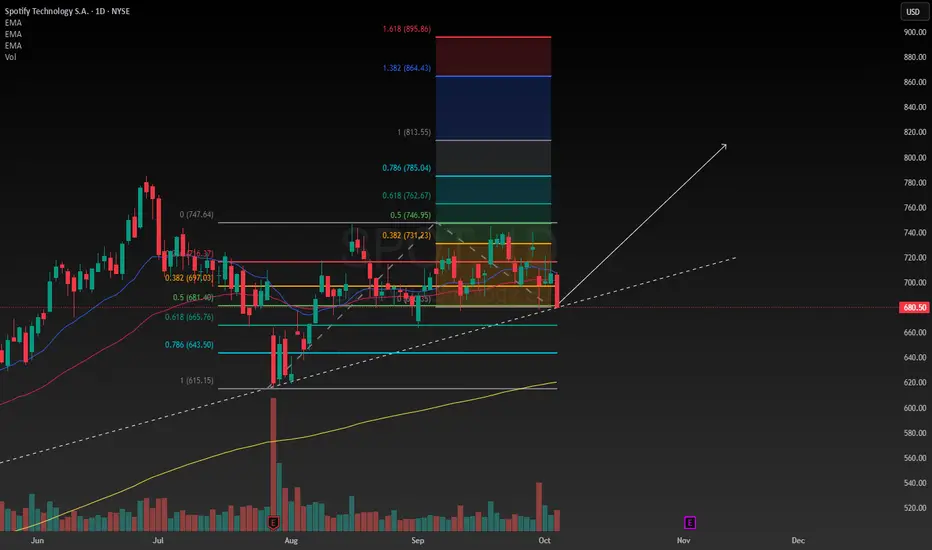
SPOT Price Action | Strong Support, Tight Stop, Open Target!🎧 SPOT | Thief Trader Profit Playbook 💰
“When Music Meets Money — Spotify’s Chart Is About to Drop Beats & Gains!” 🎵📈
🧭 Plan:
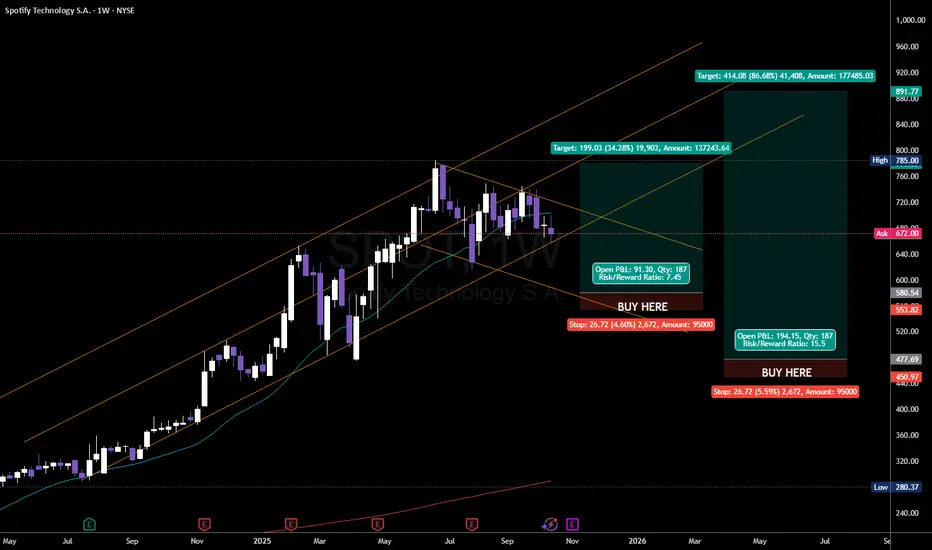
Bullish Bias — Thief-style layered accumulation for a smart entry!
We’re eyeing SPOT (Spotify Technology S.A.) for a potential swing/day trade move north.
🎯 Entry (Layering Strategy)
💎 The Thief Strategy uses multiple limit layers to build a strong position.
Here’s the sneak-in setup (choose your own comfort):
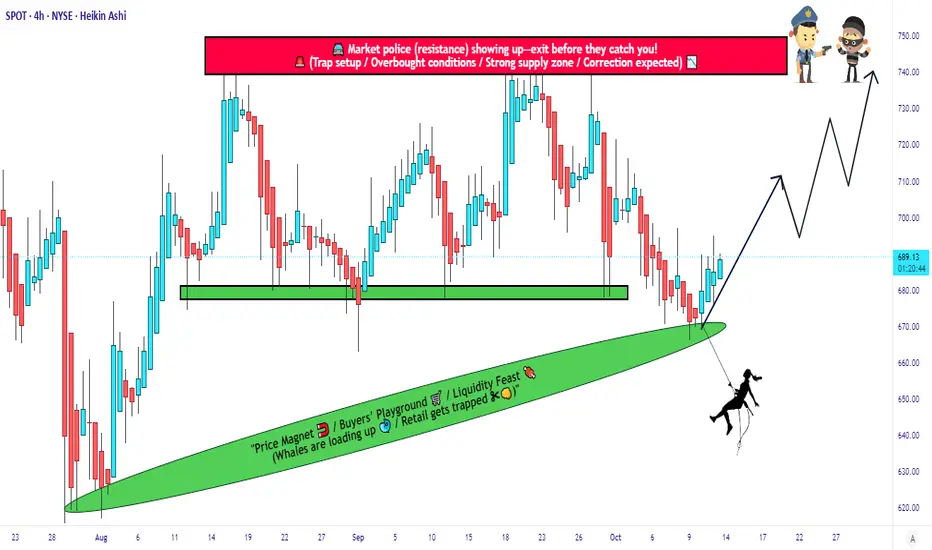
🧩 Buy Limit 1 → $670
🧩 Buy Limit 2 → $680
🧩 Buy Limit 3 → $690
(You can expand layers based on your risk appetite — remember, thieves adapt!) 😎
🛑 Stop-Loss (Thief’s Safe Escape)
This is the Thief SL @ $650
⚠️ Note: Dear Ladies & Gentlemen (Thief OG’s), this is not a fixed SL — trade smart, manage your own risk. You make money → you take money. 💼
🎯 Target Zone (Police Barricade 🚓)
Target: Around $740
The chart shows a strong resistance + overbought area + possible trap zone — that’s where the police barricade is! 🚧
Escape with profits before they catch your bags! 💨💰
⚠️ Note: Again, Thief OG’s — this is a flexible TP zone, not financial advice. Secure your profits when the opportunity sings! 🎤📊
🧩 Correlated Pairs to Watch ($)
Keep an eye on these correlated tickers for extra confirmation or sentiment cues:
NASDAQ:NFLX → Streaming sector momentum 🎬
NASDAQ:AAPL → Tech sentiment driver 🍏
NASDAQ:MSFT → Market leader correlation 🖥️
NASDAQ:META → Digital ad revenue influence 💬
NASDAQ:QQQ / AMEX:SPY → Index health check 💪
These tickers often dance together in the same rhythm — when the tech sector grooves, SPOT follows the beat! 🕺
⚙️ Technical Key Points:
Bullish structure holding above $650 zone support 🧱
Momentum strengthening after pullback retest 🎢
RSI mid-zone recovery — not yet overbought, potential room to run! 📈
Volume showing accumulation footprints 👣
✨ If you find value in my analysis, a 👍 and 🚀 boost is much appreciated — it helps me share more setups with the community!
⚠️ Disclaimer:
This is a Thief-style trading strategy, shared for educational & fun purposes only.
Trade responsibly. I’m not your financial advisor — I’m your chart burglar! 😜💼
#SPOT #Spotify #SwingTrade #DayTrade #StockMarket #ThiefTrader #LayeringStrategy #TechnicalAnalysis #BullishSetup #TradingView #EditorPick #ProfitPlaybook #SPY #QQQ #NASDAQ #StocksToWatch
SPOT QuantSignals V3 Earnings 2025-11-03SPOT QuantSignals V3 Earnings 2025-11-03
SPOT Earnings Signal | 2025-11-03
• Direction: BUY PUTS | Confidence: 60%
• Entry Plan: Pre Earnings Close | Expiry 2025-11-07
• Strike Focus: $572.50
• Entry Range: $5.50
• Target 1: $11.00
• Stop Loss: $3.30
• Implied Move: $63.73 (9.9%)
• 24h Move: -2.99%
• Flow Intel: Neutral | PCR 0.97
• ⚠️ MODERATE RISK WARNING: Consider reducing position size due to moderate confidence level.
• Earnings Date: 2025-11-04 | Estimate: $2.01
⚖️ Compliance: Educational earnings analysis for QS Premium members only. Not financial advice.
🎯 TRADE RECOMMENDATION
Direction: BUY PUTS
Confidence: 60%
Conviction Level: MEDIUM
🧠 ANALYSIS SUMMARY
Katy AI Signal: NEUTRAL with bearish bias (composite score -1.6) - despite neutral technical reading, Katy identifies bearish momentum factors including pre-earnings pressure and weak beat history
Technical Analysis: Bearish EMA alignment, MACD at -10.0064 shows downward momentum, RSI at 36.1 indicates potential oversold but room for further decline, price dropped -2.99% in 24h showing pre-earnings weakness
News Sentiment: Mixed - Rosenblatt raised price target to $700 (bullish) but maintains Neutral rating, recent earnings outlook articles suggest cautious expectations given historical misses
Options Flow: Neutral PCR at 0.97, but max volume at $520 put indicates institutional bearish positioning, implied move of 9.9% suggests high volatility expected
Risk Level: MEDIUM-HIGH - historical -51.1% average miss rate creates significant uncertainty, but exceptional revenue growth (+4315%) provides fundamental support
💰 TRADE SETUP
Expiry Date: 2025-11-07 (4 days)
Recommended Strike: $572.50
Entry Price: $5.15 - $5.85 (mid price: $5.50)
Target 1: $11.00 (100% gain from entry)
Target 2: $16.50 (200% gain from entry)
Stop Loss: $3.30 (40% loss from entry)
Position Size: 2% of portfolio
⚡ COMPETITIVE EDGE
**W
Image
QS Analyst
APP
— 10:52 AM
hy This Trade: Combines Katy's bearish composite score with technical weakness and institutional put positioning at lower strikes
Timing Advantage: Pre-earnings close strategy captures maximum volatility compression with 4-day expiry
Risk Mitigation**: Strike selection at -0.137 delta provides balanced risk/reward, stop loss protects against revenue growth surprise
🚨 IMPORTANT NOTES
Katy AI shows NEUTRAL primary trend but strong bearish composite factors (-1.6 score)
Exceptional revenue growth (+4315%) could trigger upside surprise despite poor EPS history
0% beat rate suggests consistent underperformance but creates potential for mean reversion
Position size should be reduced given mixed signals and high volatility environment
📊 TRADE DETAILS 📊
🎯 Instrument: SPOT
🔀 Direction: PUT (SHORT)
🎯 Strike: 572.50
💵 Entry Price: 5.50
🎯 Profit Target: 11.00
🛑 Stop Loss: 3.30
📅 Expiry: 2025-11-07
📏 Size: 2.0
📈 Confidence: 60%
⏰ Entry Timing: N/A
🕒 Signal Time: 2025-11-03 13:52:39 EST
⚠️ MODERATE RISK WARNING: Consider reducing position size due to moderate confidence level.
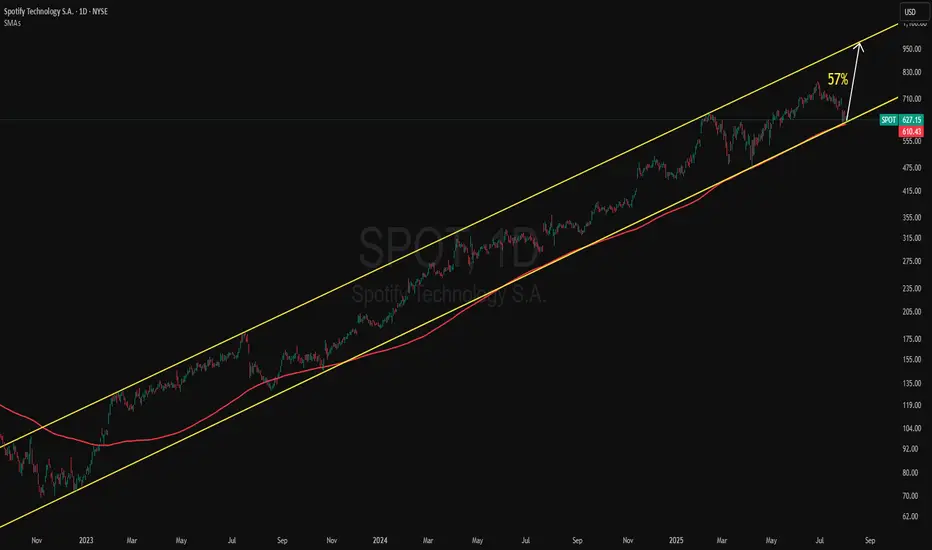
top in on SPOTWE HAVEN'T Seen any major correction since 2022 with a run of over 800% a correction wouldn't be surprising . ABC correction looks to be in play to invalidate i would like to see a bounce to 730.00 otherwise we should expect a 22% correction also we are starting to break a significant trend line.

Leading Audio Streaming Innovator Capturing Global Market: BUYBuy Reason: Spotify’s leadership in audio streaming combined with diverse content offerings and expanding user base drives growth potential. Its investments in podcasting and AI-driven personalization offer future revenue streams and competitive edge.
Why I like Spotify stockI'm going to explain the reason I believe Spotify is a good investment, there's a few reasons. I'm basically using Spotify as a defensive anchor in my portfolio. First I'm going to explain the fundamentals, and the formula for this never changes. The discounted cash flow model, is a mathematical formula used to value companies based on the expected revenues they will generate over a number of years. I have made my own model for the stock, and compared it with others models. The number I have come up with is $700 per share, meaning that anything less than $700 per share I would consider the company undervalued. This is my margin of safety I will not pay more than the perceived intrinsic value for the company, but the opportunity last week to buy shares at $680 was attractive to me so I added to my position, quite a substantial chunk of my portfolio is on Spotify.
Another reason I like the stock despite because I'm looking at the capital actually needed in the business. Whether that's a good investment for me depends on how much I paid for the business, in the end. Some great businesses operate on negative capital, subscribers pay in advance, there are no fixed assets to speak of, the receivables are not that much, and the inventory is nothing. Basically what I'm trying to say is that great consumer businesses need relatively small amounts of capital to run. I like this kind of businesses but so does the rest of the world and so they can become very competitive. I believe Spotify has a competitive advantage in their business model that's relatively defendable considering how long they've been around.
From a technical standpoint the stock has been in a range for a couple months, a break out to one direction or the other is inevitable eventually. My price target for the short term, maybe the next 12 months is $800, I'm going to just hold the stock, with no stop loss, because this is not a trade, to me this is an investment. I've had the stock in my portfolio for a few months and have been pleasantly surprised by how well it balances with some of my other positions. Monitoring my portfolio daily, I really enjoy just watching the markets and listening to some Spotify.
End of 3years of uptrend soon !?- NYSE:SPOT has been in an uptrend for last 3 years. It appears that it's running out of gas.
- NYSE:SPOT has sneakily increasing price of subscription for the last two years continuously which has propped up the numbers.
- I believe it will enter in correction territory very soon as soon as the next year.
- There are lot of gaps unfilled while it was on the uptrend.
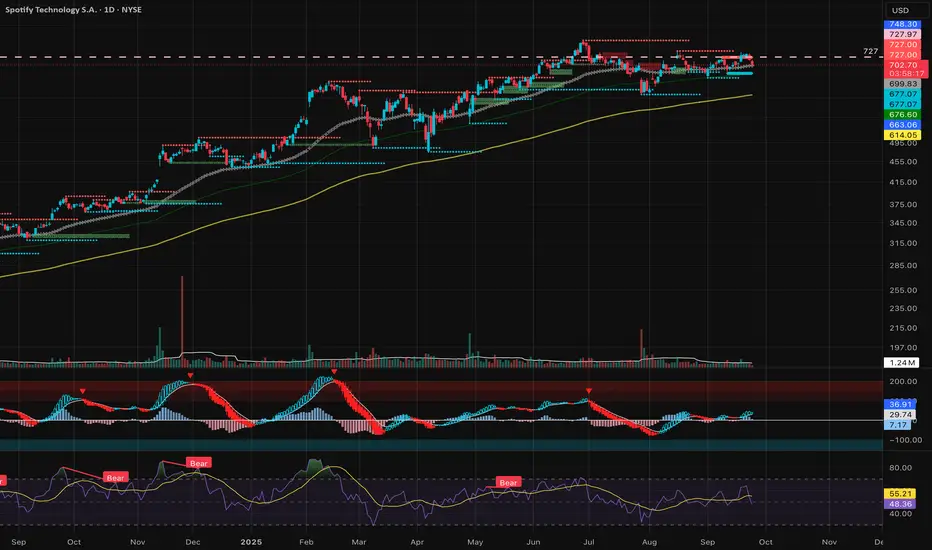
Spotify: Another breakout?Daily
An ascending trendline and higher highs formation confirm the uptrend.
Resistance: 765.49
Support: 675.47
MACD moving in bullish area
RSI bullish
Scenarios:
Bullish: if it closes above 727 and confirms with volume, we could see a breakout. However, SPOT failed to break out here. Might retest 706 - 700 before that.
Bearish: if it goes below 688 and loses support at 676.66.
No Trade active
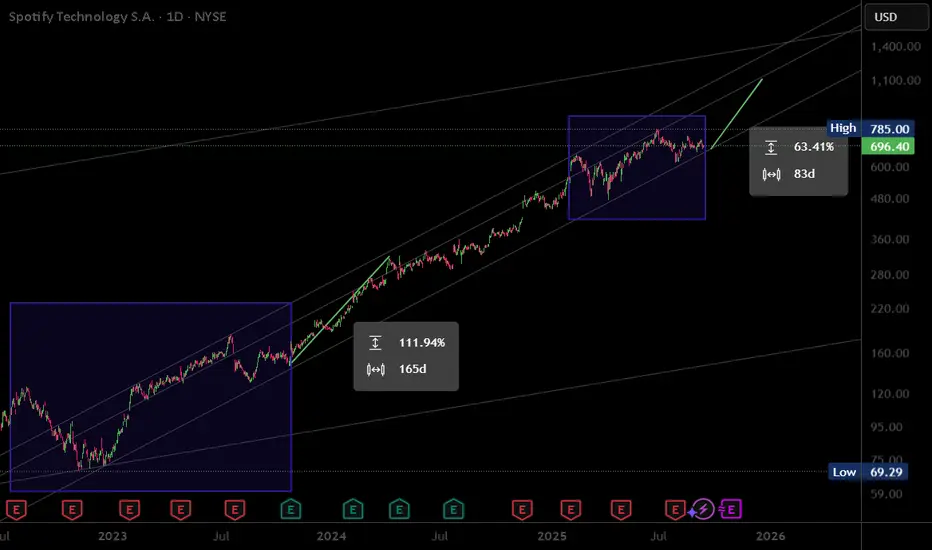
Spotify: Potential Continuation PatternsSpotify rallied to a new high early in the summer. Now, after a period of consolidation, some traders may expect further upside.
The first pattern on today’s chart is the series of lower highs between June 27 and September 9. The streaming-media company pushed above the falling trendline on Thursday, which could suggest buyers are returning.
Second is the August 15 (weekly) close of $732.81, which SPOT is now challenging. That could also be viewed as a potential breakout level.
Third, Bollinger Band Width narrowed to its lowest reading since October. The 50-day simple moving average (SMA) is also near its 100-day SMA. Those points highlight the calm price action. Could a period of movement come next?
Next, the 8-day exponential moving average (EMA) recently crossed over the 21-day EMA. Prices have remained above the rising 100-day SMA. Those signals may be consistent with short- and long-term uptrends.
TradeStation has, for decades, advanced the trading industry, providing access to stocks, options and futures. If you're born to trade, we could be for you. See our Overview for more.
Past performance, whether actual or indicated by historical tests of strategies, is no guarantee of future performance or success. There is a possibility that you may sustain a loss equal to or greater than your entire investment regardless of which asset class you trade (equities, options or futures); therefore, you should not invest or risk money that you cannot afford to lose. Online trading is not suitable for all investors. View the document titled Characteristics and Risks of Standardized Options at www.TradeStation.com . Before trading any asset class, customers must read the relevant risk disclosure statements on www.TradeStation.com . System access and trade placement and execution may be delayed or fail due to market volatility and volume, quote delays, system and software errors, Internet traffic, outages and other factors.
Securities and futures trading is offered to self-directed customers by TradeStation Securities, Inc., a broker-dealer registered with the Securities and Exchange Commission and a futures commission merchant licensed with the Commodity Futures Trading Commission). TradeStation Securities is a member of the Financial Industry Regulatory Authority, the National Futures Association, and a number of exchanges.
TradeStation Securities, Inc. and TradeStation Technologies, Inc. are each wholly owned subsidiaries of TradeStation Group, Inc., both operating, and providing products and services, under the TradeStation brand and trademark. When applying for, or purchasing, accounts, subscriptions, products and services, it is important that you know which company you will be dealing with. Visit www.TradeStation.com for further important information explaining what this means.

Previously after price made a pattern like this, it went up.In the rectangles I see similar patterns. After the first one the price went up. The earnings pattern similar too. We'll see the next earnings report. I also drew trend lines and/or price channels.
This Is Why Spotify Is In The Radar Of Everyone NowThis Is Why Spotify Is In The Radar Of Everyone Now
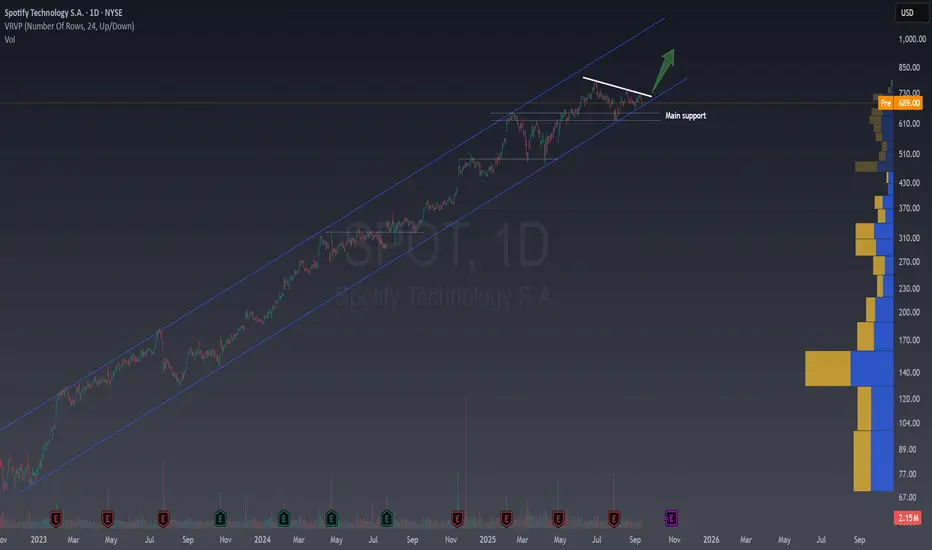
NYSE:SPOT has been respecting a strong ascending channel, now testing a key resistance (white line) which could be part of a triangle chart pattern.
🔼 Bullish case : A breakout above resistance could trigger strong momentum and drive price to new ATHs. 🚀
🔽 Bearish case: If the channel is lost, price may fall to the main support, opening the door for a more lateral or bearish phase if that support is also lost.
Let’s add the fundamental context:
📈 Strong Revenue Growth
Spotify has been steadily increasing revenue through premium subscriptions and advertising. Ad revenue has been particularly strong, showing resilience in a slowing economy.
🌍 User Base Expansion
MAUs continue to grow globally, with double-digit YoY increases, supporting long-term growth.
💵 Profitability Improvements
After years of heavy investment, Spotify has recently reported positive operating margins, which has been a key driver of the rally.
⚖️ Analyst Consensus
The stock is now trading close to the average Wall Street target price ($719) . This means that while the business is improving, analysts are cautious on valuation, explaining why the price is fighting at current levels.
⚠️ Trading plan idea:
Breakout above resistance → bullish play, but manage risk as upside could be capped by valuation and previous ATH acting as resistance. A 10% rally is very probable after the break.
Breakdown of the channel → wait for lower entry near main support seeking for a pullback to the channel. If you are bearish, then wait for the break of the main support to short it. This is an easy 20% correction.
in short... Short SPOTTechnically we are in a distribution phase.
Price battling around 50MA, once it fails it gonna test 200MA and bounce a little but gonna continue slide further more
Target 1 - 600
Target 2 - 500
Stop Loss - 760
No wonder if it goes further down to 400 or 300, we'll revisit this later.

When to buy the dip of Spotify?
Prices are at strong support, coinciding also with a 50% retracement level
A slight rise in RSI is a bullish sign
The convergence of the 50 and 20 day EMAs could be a source of resistance
Conclusion: let prices break above the 50 and 20 EMAs and wait for a retracement before buying

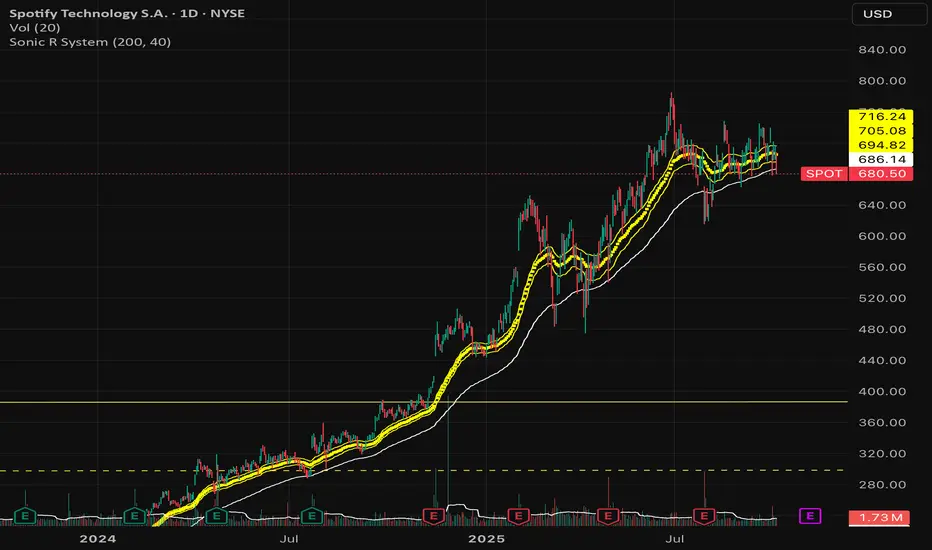
SPOT: Rebounding Off the 150 SMA -- Upper Channel Next?SPOT (Spotify) has been trading within a well-defined ascending parallel channel since late 2022. The recent dip brought price action close to the lower boundary of the channel, right at the 150-day moving average, which acted as support several times in the past.
This confluence between trendline and moving average support suggests potential for a bounce — possibly back toward the upper range of the channel.
SPOTIFY-Turn the Music Up!NYSE:SPOT
Why did profit drop?
Spotify reported an operating loss of $75M — at first glance, that looks bad. But there’s logic behind it:
• Increased spending on marketing and podcast development (long-term investment)
• Higher royalty payments — short-term pressure
• Expansion of features and product offerings — costs now, growth later
What’s good?
• Revenue up 17% YoY — Spotify keeps growing steadily
• Premium subscribers +14% — user base continues to expand
• Streaming cost per user is decreasing
• Podcasts and audio ads growing faster than expected
• Announced $1B share buyback program
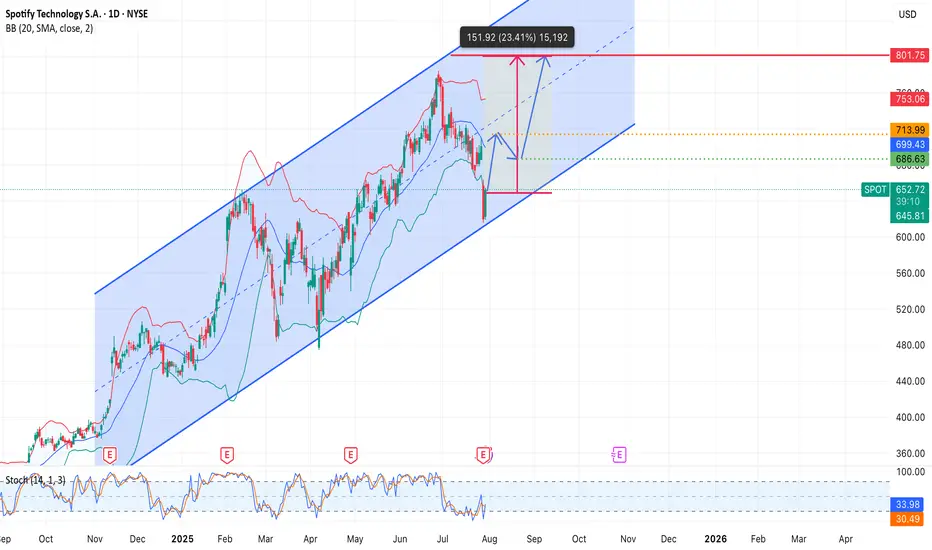
Technically:
• Bounce from the bottom of the rising channel — strong support
• Upside potential to $800 (~+23%) if trend holds
Spotify is investing in growth. Yes, it hurts earnings now, but markets care more about direction than past numbers. And right now, the arrow points up.
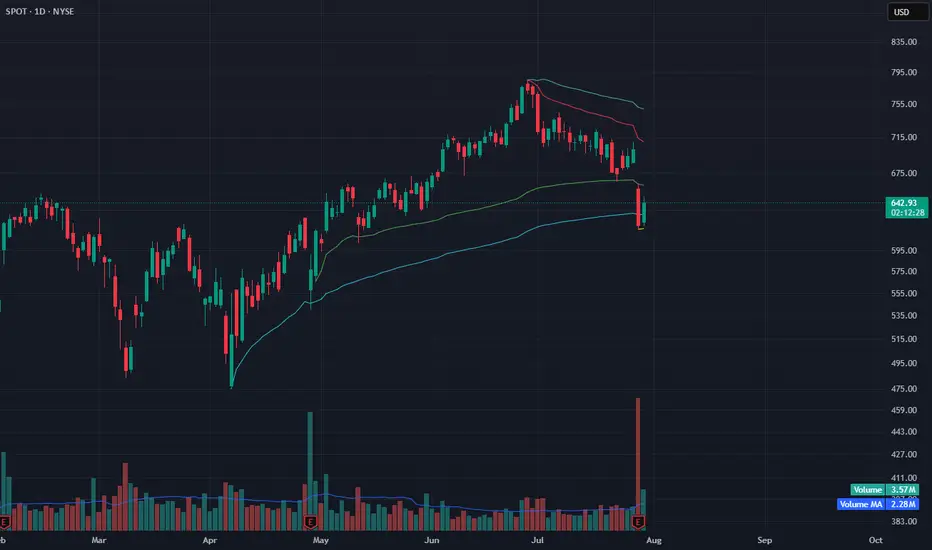
SPOT Reversing at VWAP Support – Signs of Seller ExhaustionAfter a sharp drop, SPOT is showing early signs of reversal at a key anchored VWAP support zone. The intraday bounce occurred on low volume, which may indicate seller exhaustion rather than aggressive dip-buying.
Price is holding near the blue VWAP anchored from the April low, a level that previously acted as dynamic support. Although today’s bounce lacks volume strength (3.53M vs. 2.28M MA), the selling pressure appears to be cooling off.
If SPOT can reclaim $665–670 in the coming sessions with improving volume, a recovery toward $700+ is possible. However, failure to hold above $640 may resume downside momentum.
Indicators used:
Anchored VWAP (support holding from prior pivot)
Volume (low, signaling possible seller fatigue)
Price structure (early reversal after steep correction)
Entry idea: Watch for reclaim of $665
Target: $700–715
Stop: Below $638 or new low
ShortifyI don't post all my trade ideas ahead of time but I will share another short position that I executed before posting, this time in Spotify.
Short entered at $770, stop lost at $790.
Added to my position when we lost the monthly level of support.
The end of the 5 Wave Supercycle.
Trailing stop loss, I don't like shorting solid companies but this one got overextended.
I am short several positions, including Palantir, DuoLingo and commodities like cocoa.
Not financial advice, do what's best for you

Raising the bar for SpotifySpotify has been my favorite stock so far this year. Primarily because resilience in uncertain economies. Subscription-based services, especially freemium models, are seen as defensive. Spotify is the number one music streaming service in the world and unless that changes people will keep using it every single day in their lives.
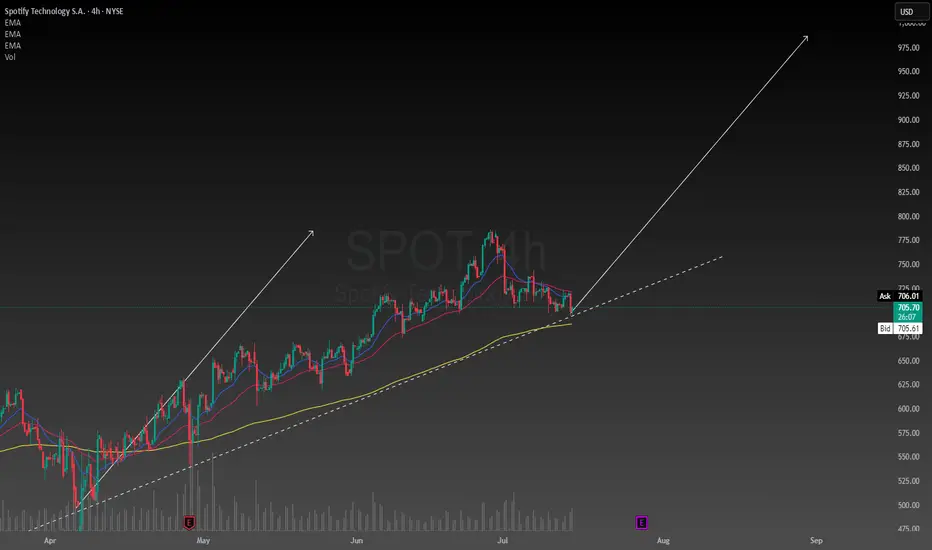
They will generate revenues based on advertisements and subscriptions which are in my opinion reasonable and conducive of a strong business model. I am raising my price target to $985. This is not unreasonable considering the intrinsic value of the stock is between $400 and $2900. I am confident Spotify will find ways to stay ahead of its competitors and dominate the music streaming industry. While keeping its customers happy and loyal.
Spotify's Valuation Is Red-Lining (Rating Downgrade)📈 Spotify's Remarkable Comeback
Spotify NYSE:SPOT has transformed itself from a money-losing audio platform into a disciplined, profit-generating tech firm. Through smarter podcast investments, layoffs, and better monetization strategies, the company recently swung from red ink to positive free cash flow and strong earnings — a major shift for long-frustrated shareholders.
This operational turnaround helped fuel a massive rally: Spotify shares have surged nearly 140% since May 2024.
💵 Financials Look Strong... for Now
Revenue jumped from $15 billion to $17.4 billion over the past year — a 16% increase. Spotify also improved gross margins from 25% to 31.6%, while net margins turned positive at 7%. Bottom-line earnings exploded from a $119 million loss to $1.25 billion in profit.
These gains came from several smart moves:
- Reduced payouts to creators (from 75% to 70%)
- AI-generated content, like white noise playlists, cutting royalty costs
- Ad growth in podcasts and better ad tech
- Higher efficiency in infrastructure and operations
Analysts now expect Spotify’s earnings to grow another 74% this year, 45% in 2026, and 30% in 2027.
💰 But Valuation Is Stretched
Despite the impressive financial performance, Spotify's stock appears overheated. It now trades at:
117x trailing earnings
71x forward earnings
37x estimated 2027 earnings
These multiples are far above historical norms — and could spell trouble if growth slows even slightly. The company is running out of levers to improve margins further, and rising operational costs may start to weigh on profits.
Spotify also trades at its highest-ever price-to-sales ratio, indicating elevated investor expectations. If the company underdelivers, the stock could face a significant correction.
⚖️ Our Take: Time to Hold, Not Buy
We still believe in Spotify's long-term story. Its subscription model, improving margins, and global scale offer compelling advantages. But after this big run-up, the stock no longer offers favorable risk-reward.
We’re downgrading from "Strong Buy" to "Hold", suggesting investors with gains may want to trim positions and wait for a more attractive entry point.
📌 Bottom Line: Spotify has executed well — but the stock price now reflects near-perfect performance. A pause, or pullback, wouldn’t surprise us.

Bullish Strength candle close above Bollinger Band midline.Nice price cross over and close above the midline of the Bollinger Band. Long entry at open on 7/7/25. Expecting volume to follow thru with average or even better above average on green candle. Target is upper BB line and then $785. This could happen fairly quickly in the bull market.
As always, because I like to catch the momentum thrust, I will be looking at call options.
Good luck

Spotify is the most beautiful chart of the yearI made chat GPT write this because i was too lazy;
ps. (The intrinsic value for the stock right now is between $400 and $2900)
Q. Why is Spotify stock doing so good this year.
A.
1. First-ever full-year profit in 2024
Spotify swung to a €1.1 billion net profit in 2024—its first annual profit—on the back of cost-cutting, layoffs, and effective pricing. Margin improvements (gross margin hit 30–32%) and leaner operating expenses fueled this turnaround.
2. Robust user growth and pricing power
Monthly Active Users (MAUs) rose 10–12% year-over-year to roughly 675–700 million, with 263–268 million premium subscribers
Spotify has successfully raised subscription prices—and free users haven't objected, demonstrating strong loyalty and pricing resilience.
3. Diverse revenue mix
Spotify’s expanding beyond music—podcasts, audiobooks, video podcasts, and AI-powered ad tools are creating new monetization channels. Podcast ad tech and AI-enabled features like “AI Ads” and smart playlists enhance advertiser value.
4. Analyst upgrades and bullish sentiment
Pivotal Research just raised its price target to $900, praising Spotify’s dominance in audio streaming, user-friendly UI, under‑penetrated global markets, and ad business improvements. Evercore ISI and others raised targets to near $750 and reaffirmed outperform ratings. Most analysts rate SPOT a Buy.
5. Strategic partnerships & scalable economics
A renewed deal with Universal boosted confidence in Spotify’s content licensing and pipeline. Hedge fund accumulation and strong ROI (ROIC ~23%) reflect effective capital use.
6. Resilience in uncertain economies
Subscription-based services, especially freemium models, are seen as defensive in slower economies. With strong retention (“stickiness” due to loyalty and seamless experience), Spotify keeps users even with higher prices.

SPOT Weekly Options Trade — June 15, 2025🎧 SPOT Weekly Options Trade — June 15, 2025
💡 Ticker: SPOT
🎯 Strategy: Bullish Swing — Call Option
📅 Expiry: June 20, 2025
⏱ Entry Timing: Market Open
📈 Confidence: 70%
🔍 Analysis Summary
All four models (Grok, Llama, Gemini, DeepSeek) indicate strong bullish momentum on SPOT based on:
✅ Above all key EMAs (5-min and daily)
🔁 Bullish RSI, MACD, and Bollinger Band alignment
📢 Catalyst: Evercore ISI upgrade to $750
📊 Notable call open interest in OTM strikes
⚠️ Max Pain: $665 — a known drag, but outweighed short-term by momentum and the upgrade catalyst.
✅ Recommended Trade
🛒 Trade Type: Long CALL (Naked)
🎯 Strike: $740
💵 Entry Price: ~$4.25
📅 Expiry: June 20, 2025 (Weekly)
📈 Profit Target: ~$8.50 (100% gain)
🛑 Stop Loss: ~$2.10 (50% loss)
🔍 Why $740? It's the sweet spot between DeepSeek’s speculative $780 and Grok's expensive $725—offering leverage with decent odds.
⚠️ Risks & Watchouts
🧲 Max Pain gravity at $665 — may cap gains closer to expiry
📉 Rejection at $714–$718 resistance range
🌪 Elevated VIX = potential for wide intraday swings
📏 Stick to small sizing (risking <2% of portfolio) due to premium volatility
🎯 Bottom Line: Strong bullish setup, solid catalyst, and technicals support a move higher. Enter on strength near open, manage tightly, and take profits on a double.

Spotify: Target Zone AheadSpotify has already come quite close to our turquoise Short Target Zone (coordinates: $725.67–$829.30). In our primary scenario, we continue to expect further upside in the near term, as the projected peak of wave B should materialize within this zone—a range that could present opportunities to lock in long-side gains or initiate short positions. Once the top is in place, we anticipate a more pronounced downward move. The focus then shifts to the magenta Target Zone (coordinates: $452.69–$390.93), which we consider a potential accumulation range for new long positions. That said, we’re also monitoring an alternative path, currently assigned a 36% probability. In that scenario, magenta wave alt.(5) would already be underway—meaning prices would bypass the magenta zone altogether.
📈 Over 190 precise analyses, clear entry points, and defined Target Zones - that's what we do.
