$WDAY Earnings Crash Setup – Bears Loading Puts!
## 🚨🔥 \ NASDAQ:WDAY Earnings Crash Setup – Bears Loading Puts! 🔥🚨
📉 **Workday (WDAY)** reports **AMC today** and the market is flashing **BEARISH**.
🔎 **Why Bears Are Hungry**
* ❌ Slowing enterprise spend = weak revenue
* ⚠️ Margins squeezed by rising costs
* 📊 Options flow: **Heavy \$195 PUTS (2,389 contracts!)**
* 💻 SaaS weakness in risk-off market
* ⚡ Key zone: \$210–220 resistance
🎯 **Trade Plan**
* 📌 Direction: **PUT**
* 🎯 Strike: **\$195**
* ⏳ Exp: **08/22/25**
* 💵 Entry: **\$0.95**
* 🚀 Target: **\$2.85+ (200% gain)**
* 🛑 Stop: **\$0.48**
* 📦 Size: 2 contracts
⚖️ **Conviction: BEARISH 85%**
👉 Watching for drop to **\$192–195** if earnings disappoint.
---
🔖 **Tags / Hashtags:**
\#WDAY #Earnings #Options #PutPlay #BearishSetup #Trading #Stocks #StockMarket #EarningsPlay
Trade ideas

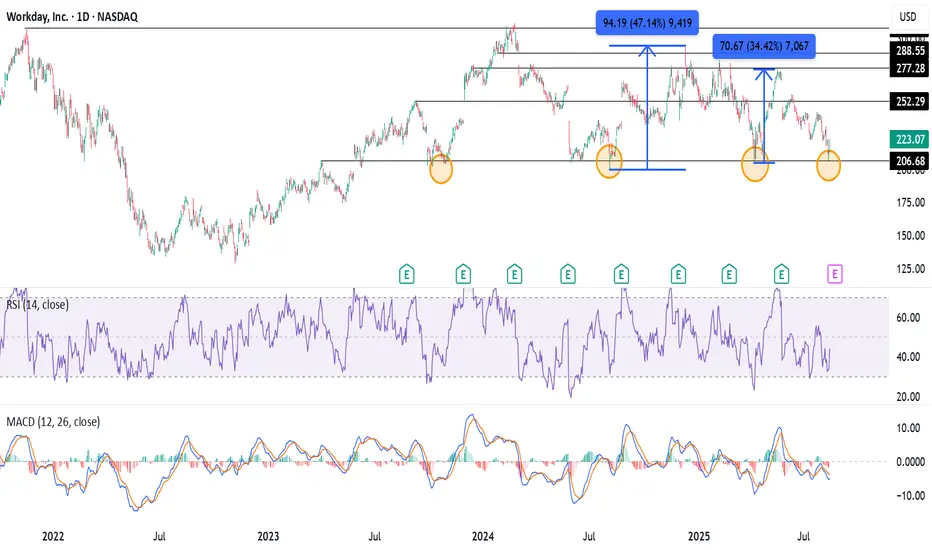
Has WDAY Formed Support Around $200?The first time WDAY crossed $300 was way back in November 2021, when the bullish trend, which started after the 2020 fall, made the stock rise almost 200%. The stock retested its ATH and managed to create a new ATH just above $311 in February 2024, but failed to sustain above it.
Since then, the stock has corrected and tested $200 multiple times in August 2024, April 2025, and now in August 2025. The $200 seems to be a strong support base. On previous occasions, when the price tested $200, the stock rose ~47% from August to December 2024 and ~34% in April-May 2025.
The price has now once again retested its strong support base around $200, with a low of $206.77, followed by a pin-bar day candlestick on August 12. The bulls seem to have come at the right time, as the price rose 3.95% on the following session.
The support base $200 with a pin-bar candle followed by a bullish momentum on the next day sets the perfect long setup for the trade.
Potential Swing Targets - $250-252, $275-277, and $288-290.
Stop-loss around $200-198.
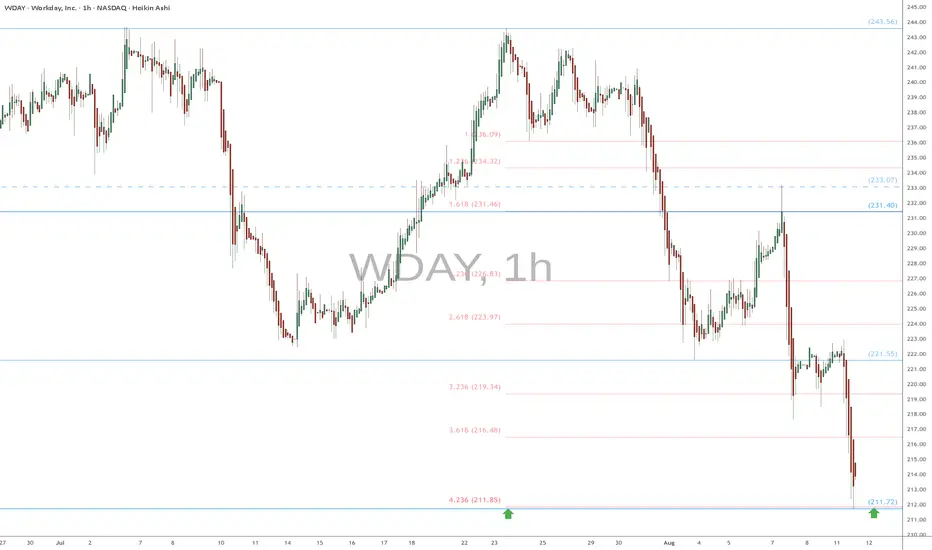
WDAY eyes on $211: Double Fib may give a Bounce if not BottomWDAY has been in a correction for some time now.
Last dip stopped abruptly at double fibs $211.72/85
Looking for this to hold but have stop loss just below.
.
See "Related Publications" for EXACT tops and bottoms ------->>>>>>>>>>>
WDAY – Workday Inc. (1H, Long)"WDAY’s coming off a solid beat in May—EPS popped over 11% above estimates, revenue nudged higher too. Now we’re bouncing clean off demand ahead of another report in just over a week. Could see a pre-earnings drift toward supply, but I’m not marrying the trade through earnings—too many gap ghosts in the past."
WDAY’s been sliding from its \$288 highs back toward a heavy **Demand Zone** near \$201–\$203. We’ve now seen a rejection wick and a bounce to \$215, suggesting early accumulation. The upcoming earnings report could be the catalyst to propel it toward the **Supply Zone** at \$267–\$276.
**📅 Earnings Context**
* **Previous Earnings (Q1 FY2026 – May 22, 2025)**:
* **EPS (Reported):** \$2.23 vs. \$2.007 estimate (**+11.08% surprise**)
* **Revenue (Reported):** \$2.24B vs. \$2.22B estimate (**+1.0% surprise**)
* **Takeaway:** Strong EPS beat, slight revenue beat. Margins and growth remained solid, boosting investor confidence.
* **Next Earnings (Q2 FY2026 – Aug 21, 2025)**:
* **EPS Estimate:** \$2.113
* **Revenue Estimate:** \$2.34B
* **Focus:** Subscription growth, AI product integration updates, margin trajectory. Market reaction could be sharp given last quarter’s strong beat.
### **Trade Setup**
* **Demand Zone:** \$201.4 – \$203.3
* **Supply Zone:** \$267.2 – \$275.9
* **Entry:** \$215.20 (current bid)
* **Stop Loss:** \$201.41 (below demand zone)
* **Take Profit:** \$273.60 (supply zone top)
* **Risk/Reward:** \~4.23:1
* **Trade Management:**
* Move SL to break-even at \~\$240 (1:1 RR)
* Consider scaling out before Aug 21 to reduce earnings gap risk.
*"Risk comes from not knowing what you’re doing."* — Warren Buffett
**⚠ Disclaimer:**
This is an educational trade plan, not financial advice. Manage your risk, and always decide if holding through earnings fits your strategy.

Quick View: $WDAY- On the Hourly chart, attempt of bullish crossover at the same level of the breakout of the Box.
- The daily is still bearish with negative price action.

Shorting $wday After Earnings - Price Action BasedI've been closely monitoring this stock for the past week, waiting for it to hit the 270 level. With earnings coming up (or just passing), the stock has now broken above that 270 price point. This presents a great opportunity to enter a position, and I’m looking at puts as my primary strategy.
Here’s the reasoning: I believe institutions are heavily positioned around this 270 level, and they’ll likely start unloading shares to retail traders. Retail traders tend to buy into the earnings hype, assuming the positive news will lead to further gains. This creates a classic trap that will likely reverse once those institutional sellers start exiting their positions.
For me, the earnings news doesn’t matter much. I’m focused purely on price action and the data it provides. I’ve been waiting for this exact scenario, and the earnings report has now pushed the stock to the level I’ve been targeting. I believe the current price point won’t hold, so I'm positioning myself with puts, expecting a pullback in the near future.
I’ve been tracking this play for a while, and I’m confident in this move. It’s all about capitalizing on the market’s reaction rather than getting caught up in the earnings narrative. If you’ve been following my other trade ideas, you’ll see that my approach has been quite effective in navigating the market. Let’s see how this one plays out!
Remember to always trade your plan, and good luck to everyone in the markets!
Workday is working up to something special! 58% UpsideWorkday - NASDAQ:WDAY
We have a falling wedge breakout with a successful retest pushing into a Multi-Year Cup&Handle breakout!
We have a great catalyst as well. They've just been added to the S&P500 AMEX:SPY , which sent this stock to $287.26 after hours on Friday. With that move we most likely break above the -20 area on the Williams R% and start to form our Williams Consolidation Box.
H5 Indicator is green and we are launching off the AVP shelf into ATH's territory.
Will look for a pullback this week in order to enter, targeting previous resistance to turn into support at $265-$275 area.
🎯$310 🎯$490
Multi-year timeframe but will get there much faster IMO.
NFA

WDAY - Long trade ideaWDAY responding good along with rest of the market.
Long anywhere here
Stop Loss - 225
Target 1 - 265
Target 2 - 286
Target 3 - 308 (after a drama)

wday longmicro accumulation structure about to spring from the low volume node. This one is pretty clear to me, NFA,

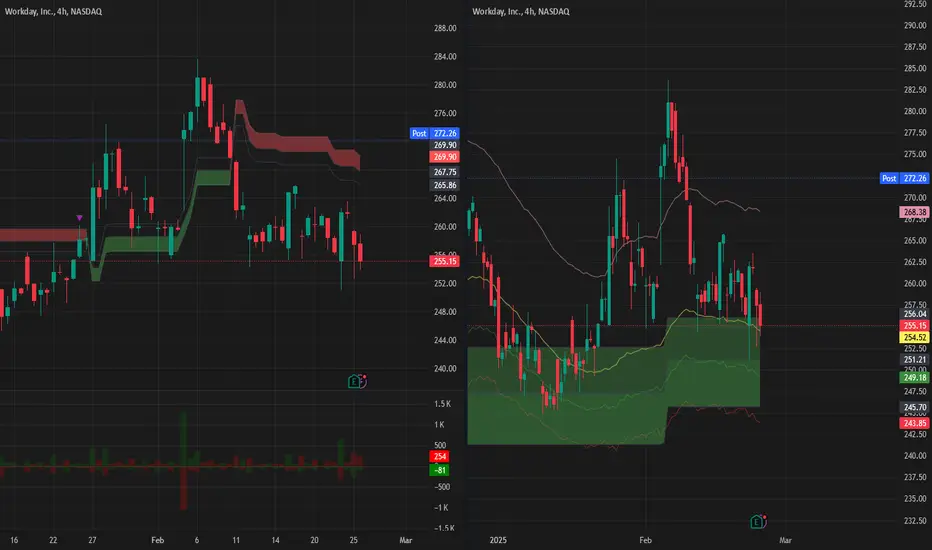
INTU Trade Idea Post EarningsTrade Plan
1. Bullish Trade Scenario
Setup:
Main Level to Watch: A break and close above $263.66. This level is key for continuation and could signal further upside.
Entry Point: Enter on a pullback to the closing price of the earnings day, around $259.96.
Stop Loss: Set below the low of the day (LOD) at $254.52. This places your stop just below a significant intraday support level, minimizing risk.
Profit Targets:
First Target: $275 (a potential area of resistance or psychological level)
Second Target: $295 (a higher target, assuming strong continuation)
Risk-to-Reward (R/R):
Risking about $6 per share for a potential first target at $275 gives you approximately 2.36R. If the price reaches $295, the R/R increases even further.
Considerations for the Bullish Trade:
Positive Earnings Report: The earnings were bullish, suggesting potential for further upside.
Strong Buyers Support: The steady buying throughout the day and the close above VWAP indicate strong buyer interest.
Gapped Up with Volume: The gap-up and subsequent market cap increase demonstrate a strong market reaction to earnings, but also indicate some profit-taking potential after such a big move.
2. Bearish Trade Scenario
Setup:
Main Level to Watch: A break below the LOD at $254.52. This could signal weakness or a potential fill of the earnings gap.
Entry Point: Enter a short position on a break of the LOD at $254.52.
Stop Loss: Set above the closing price of the earnings day at $260.79. This gives some room above the recent support turned resistance if the stock reverses.
Risk-to-Reward (R/R):
Risking about $6.27 per share with the potential for a gap fill or further downside.
Considerations for the Bearish Trade:
Overextension Risk: The stock gapped significantly from $232 to $262, adding over $10 billion in market cap overnight. This might indicate overextension and potential for a pullback.
Potential Profit-Taking: After a substantial gap up, there's often some profit-taking which could lead to a correction or retracement to lower levels.
Unpredictability of Stock Reactions: Despite bullish earnings, stocks can be unpredictable, and any market sentiment or macroeconomic factors could cause a sell-off.
Earnings Recap:
Key Financial Highlights
Total Net Sales:
Current Quarter: $2.085 billion
Year-Ago Quarter: $1.787 billion
YoY Growth: 16.7%
Subscription Services Revenue:
Current Quarter: $1.9 billion
Year-Ago Quarter: $1.62 billion
YoY Growth: 17.3%
12-Month Revenue Backlog: $6.8 billion, up 16.1% YoY
Total Revenue Backlog: $21.58 billion, up 20.9% YoY
Professional Services Revenue:
Current Quarter: $182 million
Year-Ago Quarter: $163 million
YoY Growth: 11.7%
Profitability and Efficiency
Operating Income:
Current Quarter: $111 million
Year-Ago Quarter: $36 million
YoY Growth: 208.3%
Non-GAAP Operating Income:
Current Quarter: $518 million
Year-Ago Quarter: $421 million
YoY Growth: 23%
Non-GAAP Operating Margin: Improved from 23.6% to 24.9%
Cash Flow and Liquidity
Operating Cash Flow:
Current Quarter: $571 million
Year-Ago Quarter: $425 million
YoY Growth: 34.4%
Share Repurchases:
1.4 million shares repurchased for $309 million
Cash Position:
Cash and Equivalents: $7.37 billion
Long-Term Debt: $2.98 billion

8/22/24 - $wday - avoiding the $snow fall effect8/22/24 :: VROCKSTAR :: NASDAQ:WDAY
avoiding the NYSE:SNOW fall effect
- a ton of that cash is stock comp. finally people are starting to wake up to what i've been hammering for a while. stock comp matters when it's more than 100% of "free" cash flow and you're just stuck buying back your employees bags that are dumping it the moment they get it.
- i do think NASDAQ:WDAY is possibly less of an offender than NYSE:SNOW in this situation (on SBC) but it's still meaningful.
- 30x next year PE on 15% growth so 2x PEG? still high. 3.5% fcf gen on low teens top line growth - perhaps better than cash - but i still have other names that look better.
- 7x sales for 15% growth when co's are saying B2B is weak and we're facing an unclear macro situation in the weeks/ months ahead and with Uncle Jerome set to speak on Friday?
- I'd say any up move here is probably quite limited unless they smash. and frankly i'm not close enough to have that POV (i look at so much stuff). and any down move is probably a tough one to dip buy with conviction unless we're talking >20%. so i don't want to be stuck say... taking the L or be the first one to monetize a pop on a beat. i just avoid these situations. frankly in a normal functioning market i'd probably short it at this pt. but it's a setup that i'm comfortable watching on the sidelines.
if you're long it, you better have an edge or conviction. bc i think the market has given you a nice oppty to exit in the last two weeks including this afternoon. sometimes you don't get that luxury. think about it, okay? anon?
V

WDAY - any more juice left on the short side?Bear Flags all the way. This is at value level already but the Volume Shelf Gap can push this a little more downside.
If 198 breaks here, this can see 170 and 140 quick.
If the broader market continues the sell off, this can see further lows.
Target #1 170
Target #2 140
Stop loss - 229

LONG WDAY - BULLISH REVERSALWhy I think a bullish reversal is coming:
1. Doji in a downtrend
2. Stoch <20 : extreme oversold
3. At major demand zone
Risk reward is 1:6
Stop is below doji candle low

WDAY: Break of H&S NecklineWorkday closed below the head and shoulders neckline this week so I definitely would expect a move lower, potentially filling the gap from November. It's oversold now though, so maybe a move similar to the ghost pattern- could totally keep sinking though.
Sitting on my hands for the time being, but my plan is to short once it's not oversold complemented with weak price action.
GL

Workday Stock Slides 14% Amid Soft Subscription Revenue GuidanceWorkday shares ( NASDAQ:WDAY ) fell 14% in extended trading on Thursday after the company provided softer-than-expected current-quarter and full-year subscription revenue guidance. The company lowered its full-year subscription revenue forecast due to elevated sales scrutiny and lower customer headcount growth. Workday ( NASDAQ:WDAY ) also announced a partnership with the Defense Intelligence Agency to modernize the government agency's human resources efforts. The company's updated subscription-revenue guidance reflects the elevated sales scrutiny and lower customer-headcount growth experienced during the quarter. However, Workday ( NASDAQ:WDAY ) said its increased efficiencies helped boost its annual adjusted operating margin by half a percentage point to 25%.
For the three-month period ending April 30, the company posted net sales of $1.99 billion, slightly ahead of the consensus view. On the earnings front, it posted an adjusted profit of $1.74 per share, surpassing analysts' expectations of $1.58 a share. Workday ( NASDAQ:WDAY ) announced late Thursday that the Defense Intelligence Agency (DIA) had selected it to modernize its human resources efforts, helping the company expand its footprint into the public sector.
Workday ( NASDAQ:WDAY ) shares have trended higher since completing a double bottom pattern in November 2022, with momentum accelerating after the 50-day moving average crossed above the 200-day MA to generate a golden cross signal early last year. Investors should monitor how the stock responds to support near a key horizontal line around $238 that closely aligns with a significant November-price gap. A decisive close below this crucial level could lead to a deeper pullback to longer-term support at the $205 region.

3 Reasons Why ...This Stock Is A Good BuyAm trying to understand candle stick patterns and so about a month
ago I got a book from Kindle about candle stick patterns
--
I used my last savings to buy this book because I was so interested in
learning about chart patterns
--
Combing chart patterns with the rocket booster strategy Is the ultimate way to trade
let me give you 3 reasons why:
--
- The price is above the 50 MA
- The price is above the 200 MA
- The price is going to go up or "boost up" tomorrow
--
If you want to learn more about the rocket booster strategy
then rocket boost this post for more information
--
Disclaimer: Trading is risky you will lose money from trading please learn risk management

5/23/24 - $wday - tough setup, just watching the PM print only5/23/24 - vrockstar - NASDAQ:WDAY - not the best setup into the print, high teens sales and EPS growth (~16% this year) gets you 40x PE and 7.5x sales, 2-3% fcf yield (without a stock comp illusion). basically this stock is priced for perfection here, which if you see recent prints... sales hasn't been beating by a lot. a lot of these enterprise names have had tough sledding this Q. on the converse, NASDAQ:MNDY had a nice move - and these things are decent comps, which might indicate a similar song *it rhymes* right?
i'm going to be on the sidelines. i'd like to own this, but it's hard to dip buy with conviction at this valuation on a miss. and it's hard for me to chase higher too. that keeps me watching only. gl to the holders. lmk if you have a diff POV.

Workday BUY on strength!!!!Workday is a stock that has been heavily penalized by the declines of recent weeks. The price rose strongly above the 200 EMA and left behind a strong accumulation of volumes (strong support). On the strength of today, I bought this stock at the close. The low volume area above today's closing price is very likely to be violently covered. I forward my analysis for educational purposes ONLY, do not imitate my operations. The undersigned is not responsible for any losses suffered.

WORKDAY possible reversal & low-risk high-reward setupA few confluences:
- Horizontal support
- Trend lines
- Hammer on rising volume
- Overall the stock outperforms the Index in IBD Style terms
- 61% Fib retracement
- Reverse or Hidden Divergence
If that works - you have a low-risk high-reward setup.
If it doesn't - we'd understand that quickly and move on.

WDAY even though PLTR is BetterFundamentals:
Workday (WDAY) and Palantir Technologies (PLTR ) are in the same industry, but PLTR is the better growth stock currently. PLTR is a YJ growth stock. WDAY does not meet any parameters in my filters. It is not a super stock. However, it is a healthy growth stock in a good industry. "Sometimes a stock does go up simply because the company is doing well and everybody is aware of it." (Darvas). Earnings are great and sales have been accelerating. Workday's company's quarterly report comes out in 4 days.
Technicals:
Weekly:
uHd on heavy volume
extremes indicator
a-b-c pullback
weekly trendline
horizontal support
61.8% fib
candle pattern looks like it will be either a doji or a hammer with high volume
Daily
uRd
extremes indicator
window/gap support
61.8%fib with morning star
a-b-c completion of a down Crown pattern
Comment:
SL is under 200. Target is 350.

h and S breakShort on Wday as the h and s break happens. waiting for retest.
*Not a financial advice. charts drawn here is only for educational purposes.*

WDAY 1d Chart, Q2 2024Workday with an interesting chart - obvious head and shoulders with an obvious gap below it. RSI looks meandering, but considering it's recent trend something tells me its too obvious, but we'll see.
If this breaks down, I would guess it retests the 230-240 area after the filling the gap. If it bounces, look to the 278-283 area for resistance.

WDAY charted for 18MarIf we break above this 272.45 level, then a move up to 280 is possible.
Open up below 263.65, look to short down to 252.66
