Symmetrical TriangleA S Triangle can go either way/up or down
WDAY broke up from an ascending Triangle and had quite a rally
Back to where we started from almost. )o:
I have found the market is not to be taken for granted and a strong rally can be followed by a tough decline...moves are not always repeated in the near term
The top trendline of prior A Triangle is at 199.09 and may provide support
There is also a gap there which may provide support
The symmetrical triangle, which can also be referred to as a coil, usually forms during a trend as a continuation pattern. The pattern contains at least two lower highs and two higher lows. When these points are connected, the lines converge as they are extended and the symmetrical triangle takes shape. You could also think of it as a contracting wedge, wide at the beginning and narrowing over time.
While there are instances when symmetrical triangles mark important trend reversals, they more often mark a continuation of the current trend. Regardless of the nature of the pattern, continuation or reversal, the direction of the next major move can only be determined after a valid breakout.
Not a recommendation
Trade ideas
$WDAY broke out before earningsMade the breakout just minutes before earnings after the close. Let's see if it holds in tomorrow's trading session.

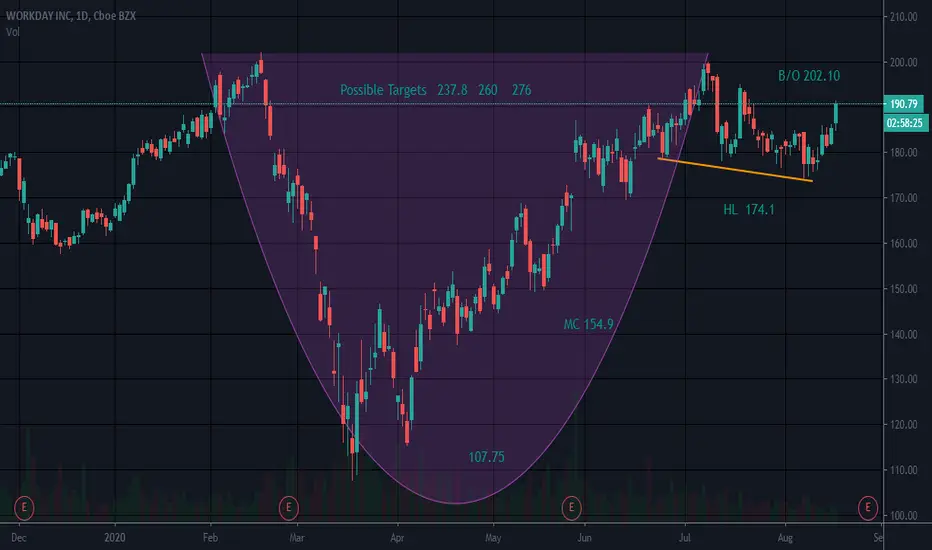
$WDAY setting up for its next run higher$WDAY is building a very constructive pattern possibly setting the stage for another run higher.
* Decreasing volume within the pattern structure
* 6 small candle stick bodies in the last 7 days indicates contraction in volatility (the calm before the next move)
* 3 higher lows (identified with green lines on the chart) indicates buyers stepping in and seeing value at higher prices
The red dotted line on the chart is the high back from July 2018. A daily close above that level will also break the down trending trend line and trigger a long trade entry.

ascending triangle to retest c&h resistancecup and handle failed to push past resistance on October 13. trying again with earnings coming up this week while forming an ascending tringle.


WDAY Longer term Wave (iii) Bullish Our WDAY longer term holdings is moving in and out of money. We are looking for a wave iii push higher into 275 once this consolidation is complete. The daily count shows we could be in a sideways market here but we will be holding on to our long-term holdings in long WDAY positions.

+30% profit in 14 days ( OLD chance ) in August I TRADED IT .Market is generous for good students and ruthless for bad ones.
It takes years to learn how to spot the best patterns and trade them (CORRECTLY) .
Don't rush your process of learning , stay humble and get a mentor or education .
If you have patience market will reward you always generously .. If you aren't the market gonna beat ur a## and makes you broke with a blink of an eye .
BTW, i don't post all my ideas here . I post only some.

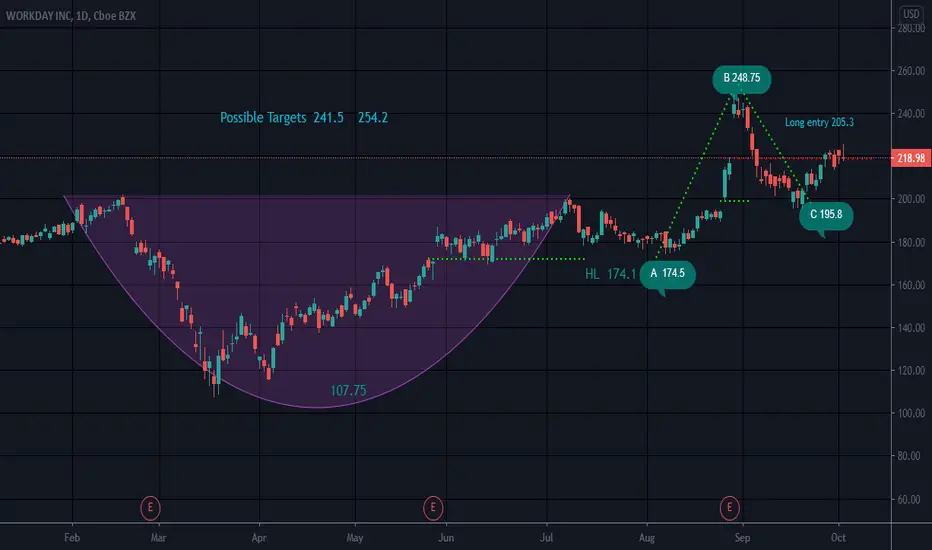
Cup and Handle Ascending TriangleWDAY had a super fast rally and a deep pull back
Support at top of A Triangle would be strong
I am hoping it does not pull back that far but has pulled back further than i thought it would already
Kinda looking like it may pull back to initial gap up (but could be a mirage) (o:
Long entry is higher than the support I see. But we all se something different/don't we?
Long when support is found
Be safe
Not a recommendation

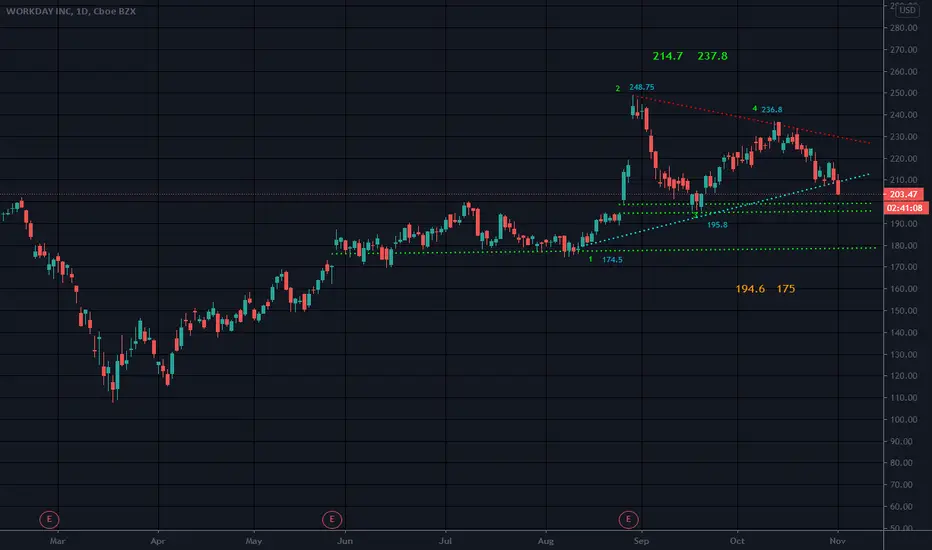
ABC BullishPossible Stop below 195.8
Possible T2: 290 to 316
WDAY also was in an ascending triangle pattern that broke to the upside at 202ish but will also provide support.
Broke from a C&H pattern so the handle low will also serve as support
Seems to be hitting R from prior gap up at 218ish
Catch this if you want it at a price that works for you
Not a recommendation
WDAY: WorkdayProvides cloud based applications for finance and human resources.
Stable company, sales ang growth. Good prospects in the next two years.

WDAY Long Setup, Trade Update Our long entry on WDAY was triggered moving in and out of money but the focus is on larger degree wave (5) move that might target the 290-300 level. Notice a breakout and a minor pullback that is a good zone for additional longs on WDAY. Look to hold on to existing Long position on WDAY into Dec 2020.

WDAY Retest/RemountWDAY had previously broken out from a resistance level of 200 range and had run significantly upward. That 200 range now acts as support. It has come down back from the breakout levels to test support again. It has remounted back over 200 and bounced off 50 simple moving average. I'm looking for bullishness in this name now back to 215 and beyond.


Cup and Handle Gap Ascending triangleHopefully the tail of a red candle has filled the gap up at earnings at 201ish from a few weeks ago. Top of A triangle has provided support. I should add first target may now be 217.6ish due to R at gap that WDAY will encounter
WDAY was flying..then it seems like it says to itself.."I left a gaps down there and I have to go fill them" lol..bummer!
Filled gap at 217ish on way own and made it all the way back to b/o level and looks to have filled it with a tail of a candle
Maybe a classic case of going up too much too fast. Now there will be R at 217ish though
I think it will return to duty now that gaps are filled. At least I hope so. I sold this day after earnings because it was overbought and I missed a big move. But it is back again so watching.
Watch for R overhead and trade safely
Not a recommendation


Cup and HandleWDAY seems to have completed fall from rising wedge, but changed handle low in process
Not a recommendation
Bullish on WDAYTextbook breakout in WDAY on Earnings Surprise. Those are NOT Robinhood volumes, those are institutional/hedge fund volumes. Going long on Monday.

earnings beat, guidance boost+boost price target+Co-CEO PromotesWorkday Promotes Chano Fernandez to Co-CEO
earnings beat, guidance boost
Workday reported a second-quarter net loss of $28 million, or 12 cents a share, on sales of $1.06 billion, up from $888 million a year ago. After adjusting for stock-based compensation and other factors reported earnings of 84 cents a share, up from 44 cents a share in the same quarter the year before.
As a result of our strong Q2 performance, we are raising our fiscal 2021 subscription revenue guidance to a range of $3.73 billion to $3.74 billion,"
finance.yahoo.com
Jefferies boosted its price target on Workday from $180 to $195
We remain fundamental fans of WDAY's broad product portfolio and believe that spend will inevitably come back as we recover
Salesforce.com (CRM) soared 26% to a record high after the company reported a strong July quarter and gave a bullish forecast.
www.fool.com
move to the cloud is ongoing and even challenged industries are seeing the benefits and cost savings of modern cloud applications.
realmoney.thestreet.com

Huge opportunity over here!So, my dudes!
Today is the day, we might break out from the current "Head and Shoulder" Pattern.
IF we have a high volume and manage to stay above the former resistance level then the sign will be more bullish than ever.
The price target is calculated in the following way: Neckline high - Head low = x, Target = x + Neckline high (304.97)

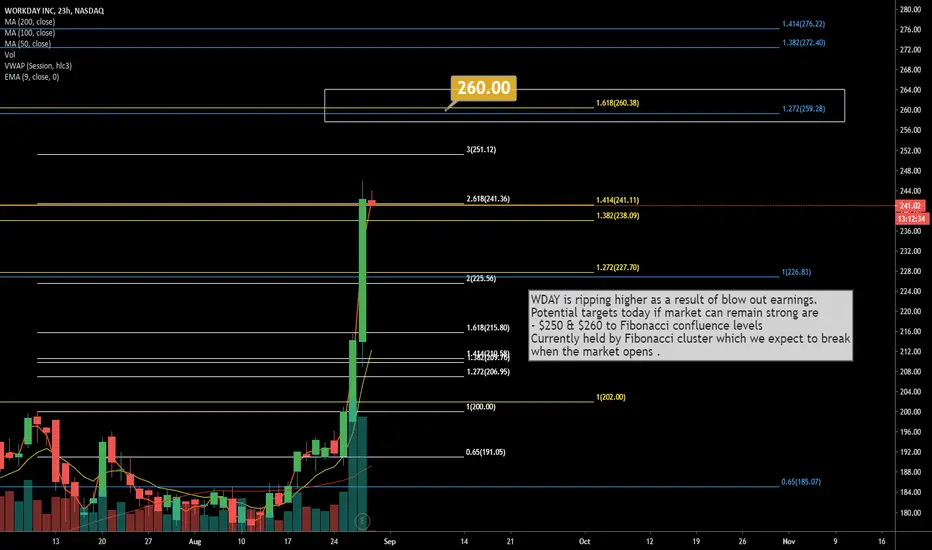
$WDAY $260 Target for Workday
WDAY is ripping higher as a result of blow out earnings.
Potential targets today if market can remain strong are
- $250 & $260 to Fibonacci confluence levels
Currently held by Fibonacci cluster which we expect to break
when the market opens .
PLEASE GIVE US A LIKE IF YOU FIND OUR CONTENT HELPFUL, THANK YOU.
WDAYNice follow through after gap up and good earnings. 226-228 would be next range with ATH at 226.83.

WDAY: Ascending Triangle, Could be confirmed tomorrow.Ascending Triangle
May confirm tomorrow.
Pros
Descending Volume
No resistance above at all!
Volume on break out
Broke 200MA on volume in May
250RSI above 50
PPS above 50MA and 200MA
RS above 0 and climbing
R/R ratio above 19, Very High
Cons
200MA Flat
Targets:
PT1 = 221,76
PT2 = 300,97
