If this aint a sign to buy SOFIA, see you at 64$ LONG TERM.Im talking 1-2yrs from now, but i see us touching 45$ EOY, nice fakeout. Weak hands gone? Everything is bullish again. BULL FLAG weekly daily 4H. November earnings should be great, plus bullish news with trump (we got 3 more yrs). Wish i bought shares at 16 instead of 21 when i was buying calls.
Time to hold heavy. 400 shares 21.20$ avg
Poised for new highs , i see 37-39$ easily eoy , 45$ is blowing expectations.
Trade ideas

SOFI: Buyers in Control? Heading Toward $31?SOFI is showing strength as AVWAP and HVN hold as key support — a clear sign that buyers are in control. 📊
If momentum continues, we could see a push toward the $31 target zone in the coming weeks.
👉 What’s your take — breakout incoming or another retest of support first?
Based on :
- Fundamental analysis
- Avwap and HVN levels
- Quantitative analysis

SOFI Easy Short into Earnings Been trading sofi for almost all year now its how ive made my living. with that being said we should see a gap down. most these shares were accumulated around 18-19 bucks retail wise anyways.

$SOFI Bounce and then measured move to $40.00?NASDAQ:SOFI
*POSTED TWO DAYS AGO BUT REMOVED.*
This setup is very interesting.
Earnings catalyst end of month with potential S&P 500 inclusion towards the end of year.
Max pain at $22.45 support, but would like to see it back above the 20-day MA ($27.21).
A bounce from here could just be the start the measured move to $40.00+.

Bulls vs the BearsWith Sofi displaying bearish divergences on the weekly chart. We take a look at the 4hr chart and anticipate a breakout. A bearish breakout may open the floodgates for the Bears with their next challenge point around the 24.00 range. Bullish breakout for the bulls will be business as usual with their challenge point 26.00, battling a EMA cluster.

Candle ClosesIs the wait for the Bears over? it seems SOFI is being challenged at a key level. If we get a bearish candle close this week lower than last week, combined with a bearish MACD(Chris Moody), combined with the bearish divergences; the bears shall rejoice. Bulls are still in the fight and need price to overcome the 29$ price range.

SOFI Technical Outlook: A Rising WedgeStructure and Pattern Recognition
SOFI has recently completed a significant run within a rising channel but is now showing signs of exhaustion. Price action has formed a rising wedge pattern, followed by a break of structure (BoS) to the downside. This shift suggests momentum could be transitioning from bullish expansion into corrective territory, providing an early indication of potential downside continuation.
Key Levels and Setups
The stock is trading near $26.40, having rejected the channel’s upper boundary. The immediate level of interest lies at the $24.50–$25.00 zone, which previously acted as short-term support but now risks flipping into resistance. A sustained rejection here would open room for a move toward the $22 liquidity zone (LQ), aligning with the highlighted short target.
Volume Profile and Momentum
The volume profile shows strong acceptance around the $22 level, reinforcing its importance as a near-term magnet for price. Momentum indicators confirm weakening buying pressure after extended upside, and the breakdown below structure adds weight to the short bias. With broader market uncertainty still lingering, the technicals suggest that sellers may retain control in the near term.
Outlook and Scenarios
Bearish Case: A confirmed rejection at $25 resistance would validate the short thesis, targeting $22 for a projected ~15% downside move.
Bullish Case: Reclaiming $27 and breaking back into the channel would neutralize the short setup and potentially re-open the path toward the highs near $30.
Conclusion
SOFI is at an inflection point, with the technical structure now favoring a corrective pullback. While the broader uptrend remains intact over the long term, short-term risks point lower. Active traders may view $25 as the key pivot zone to define risk and direction in the days ahead.

SoFi Technologies Is Up 200%+ Since April. What Its Chart SaysFinancial platform SOFI has gained more than 200% since its April near-term low and some 240% over the past 12 months. Where does its chart say it can go from here?
Let's check it out:
SoFi's Fundamental Analysis
"Noto with the tackle." I can remember those words ringing down over and over again years ago from the PA at West Point's Michie Stadium when Anthony Noto -- now SoFi's CEO -- was a college-football player for the U.S. Military Academy.
He was a middle linebacker in the late 1980s, and I remember him well from that era.
I didn't go to West Point, but am a big fan of Army football and a long-time season-ticket holder.
Yes, I enlisted in the Marine Corps out of high school, but my dad was an Army officer, and I grew up rooting for the Army team in college sports. (I would eventually end up in the Army as a National Guard member many, many years later after a 22-year break in service.)
I've been impressed with Noto ever since I became aware of him decades ago. He was aggressive as a college-football player. He was all over the field. Easy to root for.
And decades later, he's running perhaps the most well-known U.S. online financial-services company.
But does that make for a good stock? Let's look first at SOFI's financials.
The company last reported results on July 29 for Q2, and should report Q3 numbers in about a month.
For Q2, SoFi posted $0.08 in GAAP earnings per share on $854.9 million of total revenue (or $858.2 million of adjusted net revenue).
These top and bottom-line numbers all beat analyst expectations quite decisively. They also compared quite well to $0.01 for the year-ago period while reflecting year-over-year revenue growth of 43% GAAP and 44% adjusted.
Fee-based revenue was up 72% to $378 million, while membership increased by 34% to 11.7 million people and product growth gained 34%.
The firm's business units all did well, but its Financial Services division really moved the football.
Financial Services generated $362.5 million of net revenue (+106% year over year). That drove a segment-contribution profit of $188.2 million (up 241% y/y) on a 52% contribution margin, up from 31% a year earlier.
Separately, SOFI's technology platform generated net revenue of $109.6 million (+15% y/y). This produced a segment-contribution profit of $33.2 million (+7% year over year) on a contribution margin that dropped from 33% to 30%.
Meanwhile, lending generated $443.5 million of net revenue, up 30% from the same period last year. That produced a segment-contribution profit of $244.7 million (+24%) on a contribution margin that dropped from 58% to 55%.
As for the current period, the Street is looking for SoFi to report $0.08 of Q3 GAAP EPS on about $880.2 million in revenue. Those results would compare to $0.05 GAAP EPS a year ago, while showing 27% in year-over-year revenue growth.
Of the 10 sell-side analysts that I am aware of that cover SOFI, all of them have revised their Q3 earnings estimates higher since the period began.
SoFi's Technical Analysis
Here we have SOFI's year-to-date chart running through Wednesday afternoon:
Readers will see that SOFI developed an "inverse head-and-shoulders" pattern of bullish reversal with a $15 pivot this past spring, as marked with a red jagged lines and pink shaded area above.
That set-up generated a breakout and upward-sloping trend illustrated here by an Andrews' Pitchfork model (the purple lines and purple-shaded area at the chart's right).
The stock is currently struggling with breaking out beyond this pitchfork model's upper trendline.
Now let's look even closer by zooming in on just SOFI's past five months running through Wednesday afternoon:
Towards the top of that pitchfork (which I removed so as to declutter the chart), the stock formed an "ascending triangle" (a bullish pattern of continuance) with a $27 pivot. This is denoted by the black lines at the above chart's right.
Meanwhile, SoFi's Relative Strength Index (or "RSI," the gray line at the chart's top) is quite robust, but isn't quite at the point of expressing a technically overbought condition.
Similarly, the daily Moving Average Convergence Divergence indication (or "MACD," denoted by a black and gold line and blue bars at the chart's bottom) is postured bullishly, with all three components of that item well above zero.
That said, the histogram of the 9-day Exponential Moving Average (or "EMA," marked with blue bars) appears to have rounded.
Still, the 12-day EMA (the black line) remains above the 26-day EMA (the gold line). That's considered bullish.
However, both of those lines have turned downward, and the 12-day line looks like it could meet and potentially cross below the 26-day line. That would be a bearish signal.
Options Options
Options traders who are bullish on SoFi might choose to employ a "buy-write" set-up in this scenario.
This strategy, also known as a "covered call," involves buying shares of the stock and selling an equivalent amount of calls. Here's an example:
-- Purchase 100 shares of SOFI at or close to $26.
-- Sell (write) one Oct. 31 $33 call for about $0.50. This call will likely expire after SOFI has released Q3 earnings.
Selling the call will reduce the trader's net basis to $25.50. There's no downside protection, but there's an artificially created lower entry point.
If the shares are called away at $33, the trader will recognize a 29.4% profit.
Conversely, options traders who are bearish might consider a bear-put spread.
This can be set up by buying a put while simultaneously selling a second put at a lower strike price. Here's an example:
-- Purchase one Oct. 31 $25 put for about $1.65.
-- Sell (write) one Oct. 31 $22 put for roughly $0.65.
Traders in this example will have gotten a bear-put spread for a $1 net debit, which is also the maximum theoretical loss on this set-up. The trader is spending $1 to try to receive $3 -- a 200% potential profit.
(Moomoo Technologies Inc. Markets Commentator Stephen “Sarge” Guilfoyle was long SOFI at the time of writing this column.)
This article discusses technical analysis, other approaches, including fundamental analysis, may offer very different views. The examples provided are for illustrative purposes only and are not intended to be reflective of the results you can expect to achieve. Specific security charts used are for illustrative purposes only and are not a recommendation, offer to sell, or a solicitation of an offer to buy any security. Past investment performance does not indicate or guarantee future success. Returns will vary, and all investments carry risks, including loss of principal. This content is also not a research report and is not intended to serve as the basis for any investment decision. The information contained in this article does not purport to be a complete description of the securities, markets, or developments referred to in this material. Moomoo and its affiliates make no representation or warranty as to the article's adequacy, completeness, accuracy or timeliness for any particular purpose of the above content. Furthermore, there is no guarantee that any statements, estimates, price targets, opinions or forecasts provided herein will prove to be correct.
Options trading is risky and not appropriate for everyone. Read the Options Disclosure Document ( j.moomoo.com ) before trading. Options are complex and you may quickly lose the entire investment. Supporting docs for any claims will be furnished upon request.
Options trading subject to eligibility requirements. Strategies available will depend on options level approved.
Maximum potential loss and profit for options are calculated based on the single leg or an entire multi-leg trade remaining intact until expiration with no option contracts being exercised or assigned. These figures do not account for a portion of a multi-leg strategy being changed or removed or the trader assuming a short or long position in the underlying stock at or before expiration. Therefore, it is possible to lose more than the theoretical max loss of a strategy.
Moomoo is a financial information and trading app offered by Moomoo Technologies Inc. In the U.S., investment products and services on Moomoo are offered by Moomoo Financial Inc., Member FINRA/SIPC.
TradingView is an independent third party not affiliated with Moomoo Financial Inc., Moomoo Technologies Inc., or its affiliates. Moomoo Financial Inc. and its affiliates do not endorse, represent or warrant the completeness and accuracy of the data and information available on the TradingView platform and are not responsible for any services provided by the third-party platform.

Why Going Long on SoFi Stock SoFi Technologies (SOFI) is at a pivotal moment, presenting a strong long opportunity as it enters the 5th wave of an Elliott Wave cycle. This final leg typically brings explosive upside momentum, signaling a potential breakout.
While a brief dip below $10 is possible, this could act as a springboard for a powerful rally toward $20 and beyond. The stock's bullish structure, combined with SoFi's growing financial services business, makes it an attractive bet for long-term investors.
With momentum building, now may be the perfect time to go long on SoFi before the next surge begins.
🚨 This is not financial advice. Do your own due diligence (DD) before making any investment decisions. 🚨

SOFI poised for bullish breakout: Strong growth builds momentum Current Price: $29.51
Direction: LONG
Targets:
- T1 = $32.00
- T2 = $35.00
Stop Levels:
- S1 = $28.50
- S2 = $27.00
**Wisdom of Professional Traders:**
This analysis draws insights from thousands of professional traders evaluating trends in SOFI. These professionals emphasize SOFI’s continuous growth in its loan origination business, strategic partnerships, and its ability to capitalize on rising consumer demand for digital financial solutions. Collective consensus highlights SOFI's resilience in delivering robust growth metrics amidst volatility, making it a compelling bullish contender for 2025. The wisdom of the crowds pinpoints recent momentum and key fundamental drivers, reducing bias and sharpening focus on actionable trade opportunities in SOFI.
**Key Insights:**
SOFI Technologies has been transforming its footprint in fintech with its distinct integrated product model ranging from personal loans to banking services. This comes at an important time when digital banking adoption is accelerating globally, allowing SOFI to tap into new markets efficiently in 2025. Analysts point to SOFI's consistent performance in scaling its loan origination volumes despite a fluid interest rate environment. Additionally, recent investments in technology enhancements and an improved member acquisition strategy are garnering attention in professional circles, with much of the sentiment skewing positively.
Technically, SOFI is consolidating near major support levels after a breakout above medium-term resistance zones around $28.50, creating a strong base for further moves toward $35.00. With earnings upgrades and a bullish RSI indicator now tracking above 60, traders are positioning aggressively to take advantage of upward trajectory opportunities. Such coordinated momentum from institutional and retail investors is rare and signals significant upside potential.
**Recent Performance:**
SOFI’s stock price has shown resilience over the third quarter of 2025, recovering strongly after pushing past resistance levels at $28. The price has steadily climbed, with trading volume visibly increasing on days when news around SOFI’s lending business emerged. In the past month, SOFI achieved gains of over 8%, benefiting from strong earnings reports and broader fintech sector tailwinds. The stock has formed higher lows consistently, reinforcing the trend strength heading into Q4 2025.
**Expert Analysis:**
Market experts are bullish on SOFI’s strategic positioning in the market compared to peers such as PayPal and Block, suggesting it holds untapped upside due to its focus on expanding personal and student lending, along with digital financial services offerings. SOFI’s member growth numbers, reported at nearly a double-digit percentage increase in Q3, have significantly advanced its revenue potential. On the technical front, SOFI's MACD indicator crossed upward last week, confirming bullish momentum and potential for the continuation of its rally. The expert consensus supports long-term gains, with SOFI projected to outpace general fintech performance into year-end 2025.
**News Impact:**
Recent reports of SOFI completing a high-profile partnership with major digital platforms to enhance its product distribution have propelled its growth narrative. This news complements SOFI’s ongoing traction in the student loan market given regulatory reforms reinstating payments after pandemic-related pauses. The company’s successful cost containment measures amid rising interest rates further strengthen its outlook. These updates have positively influenced trader sentiment, contributing to higher trading volumes and broader institutional interest.
**Trading Recommendation:**
Take a bullish position on SOFI as recent earnings momentum and strategic expansions align with global fintech growth trends. The stock is well-positioned for a breakout, with technical strength and improved guidance supporting gains into Q4 2025. Current price action suggests an attractive entry near $29.51, with potential upside to $35.00. Maintain close attention to stop levels at $27.00 to manage risk effectively while taking advantage of upward volatility.
Do you want to save hours every week? Register for the free weekly update in your language!

Is Sofi about to pull of a Palantir to over $100 ?!🔹 Technical Structure
SoFi has built a multi-year rounded bottom base from $4.27 lows (2022–2023) to the $26 rim resistance (2025).
Pattern depth: ~$22.
Conservative measured move target: ~$48–50.
Supercycle stretch target: ~$100–150 (a repeat of the 500% magnitude move from the base, similar to Palantir’s trajectory).
This mirrors Palantir’s 2020–2023 cup base, where a long accumulation under $23 eventually broke out, launching into a magnificent run once the resistance gave way.
🔹 Palantir Analogy
Palantir’s Setup:
Bottom $6.00, rim $30
Multi-year base, AI narrative catalyst.
Broke out in late 2023, surged to $185, fulfilling its measured move.
SoFi’s Setup:
Bottom $4.27, rim $26.
Multi-year rounded base, fintech adoption catalyst.
Currently pressing resistance; breakout would align it with Palantir’s pre-explosion stage.
👉 Both charts share the same accumulation → breakout → exponential expansion cycle.
🔹 Fundamentals Supporting the Breakout
Q2 2025 Results:
Net Revenue: $855M (+43–44% YoY) — strongest growth in two years.
Adjusted EBITDA: $249M (+81%), ~29% margin.
Net Income: $97M GAAP profit, EPS $0.08 (+700% YoY).
Members: 11.7M (+34% YoY).
Products: 17.1M (+34% YoY).
Raised Guidance: Full-year revenue ~$3.375B, EPS ~$0.31.
Growth Outlook (2026+):
Revenue CAGR ~18–20% through 2026.
EPS CAGR ~20–25% expected.
Forecast by 2028: Revenue ~$5.1B, Net Income ~$950M.
Strategic Strengths:
Expanding ecosystem (banking, lending, investing, insurance).
Cross-sell flywheel → increasing monetization per user.
Scalability proven with profitability and margin expansion.
Rate cuts + digital adoption = macro tailwinds.
🔹 Why $100 Is Plausible
Technical Base Magnitude: Rounded bottom projects $48, but history shows supercycles often extend beyond measured targets
Fundamentals: Tripling revenue, scaling profits, ecosystem expansion.
Macro Liquidity: Lower rates + fintech adoption cycle provide tailwinds.
Valuation Expansion: With EPS trending toward ~$4–5 by 2030, premium multiples could justify triple-digit valuations.
Comparative Proof: Palantir’s breakout validated that multi-year fintech/tech bases can lead to 300–500% runs when catalysts align.
✅ Conclusion:
SoFi’s rounded base breakout mirrors Palantir’s 2020–2023 accumulation. With accelerating fundamentals (revenue growth, profitability, ecosystem leverage), and macro tailwinds (rate cuts, fintech adoption), SoFi could realistically run to $48–50 in the base case, with $100+ as a stretch target if Palantir’s roadmap repeats.

RisingSofi is approaching it's critical resistance of 28.28. If it breaks through, new highs will be made. Or will we get a pullback back before then?

Mastering the Edge: How Risk and Leverage Shape WinnersIn my last post, we discovered how expectancy works like a compass — giving us direction and helping us see the road ahead of our trading account. But a compass alone won’t move you forward. To actually get anywhere, you need an engine.
And that engine is risk management.
Many traders spend years looking for the “perfect” trading system, only to ruin it by stepping too hard on the gas. They don’t blow up because their strategy was flawed — they blow up because their risk was.
Risk per Trade: The Accelerator and the Brake
Think of risk per trade as the pressure you put on the accelerator. Risk too little, and your system barely moves. Risk too much, and you spin out of control.
When you risk a fixed fraction of your account, every trade slightly changes the size of the next one. This creates compounding — the same principle that builds fortunes when handled with care, but wipes accounts when abused.
The key takeaway is simple: risk is the throttle of your system. Push it wisely.
Drawdowns: The Valleys You Can’t Avoid
Every journey has valleys and peaks, and trading is no different. A drawdown is simply the distance between your highest equity peak and the valley that follows.
It’s not something you can avoid. Every trader, no matter how skilled, will walk through valleys. What matters is how deep they go — and whether you can climb back out. The bigger your risk per trade, the deeper those valleys will be.
Leverage: The Amplifier
Leverage doesn’t change your system; it amplifies it. It’s like turning up the volume on your speakers. A little more volume makes the music clearer. Too much, and the sound distorts, eventually blowing out the speakers.
In trading, leverage multiplies your effective risk. That means it can quickly push you beyond the “sweet spot” where your system grows steadily, into a dangerous zone where volatility eats away at your gains.
The point is not to avoid leverage altogether, but to respect it. Used wisely, it enhances your edge. Used carelessly, it magnifies every weakness until it breaks you.
Risk of Ruin: The Hidden Monster
Even with a profitable edge, there’s always a monster lurking in the shadows: risk of ruin.
In simple terms, risk of ruin is the probability that you’ll blow up your account before your trading edge has enough time to show itself. It’s not about whether your system works — it’s about whether you survive long enough to let it work.
Here’s the practical catch: leverage amplifies both your gains and your losses. And because losses are inevitable, leverage makes your drawdowns deeper. The real question every trader should ask is: will this amplified drawdown knock me out of the game too soon?
That’s why using leverage wisely is non-negotiable. Even a solid system can collapse if pushed beyond its limits. The trade-off is clear: grow steadily but safely, or chase faster growth and risk snapping the system in half.
Now, for those who like to peek under the hood, there is actually a scientific way to estimate the “sweet spot” for risk and leverage. Traders and mathematicians call it the Kelly Criterion. In this post we don’t go into formulas, but if you want to see the numbers, the simulations, and even play with your own scenarios, you’ll find a complete Python notebook in this GitHub repo (github.com).
Bringing It All Together
A trading system with an edge is like a powerful engine. But without managing the fuel (risk), the throttle (leverage), and the terrain (drawdowns), even the best engine can explode before reaching its destination.
This is why risk management isn’t just a technical detail — it’s survival. And here’s the truth: every profitable trader in the world, whether they know it or not, follows these principles. Some arrive at it through mathematics and statistics, others apply it intuitively. What outsiders often call “the touch” or “the magic” of a great trader is nothing mystical at all — It’s nothing more than the consistent application of probabilistic thinking, whether done consciously or unconsciously.
Strip away the charts, the buzzwords, and the noise, and you’ll always find the same foundation underneath: probability, expectancy, and risk control. Apply them consciously with tools and simulations, or apply them instinctively — either way, they are the invisible framework that separates survival from ruin, and consistency from chaos.
And if you want to see this foundation in motion, not as abstract ideas but as living numbers and scenarios, the GitHub notebook is there for you. It’s a way to pull back the curtain and watch how expectancy, Kelly criterion, leverage, and drawdowns truly shape the future of your trading account.
SOFI 1H + GEX Game Plan for Tue, Sep 16SOFI Charging Toward 28–29 Gamma Zone — Will the Bulls Keep Control? 🚀
Market Structure (1-Hour View)
* Strong advance: SOFI extended its breakout, now consolidating near 27.7–28 inside a steep rising channel.
* Trend context: Short-term trendline support sits near 26.5–26.6, with broader demand around 25.8.
* Momentum: MACD is cooling after a strong run; Stoch RSI near mid-level shows room for another push if buyers stay active.
Key Levels to Watch
* Resistance: 28.0 (immediate lid), 28.5–29.0 (gamma cluster and call wall zone), and 30.0 as stretch target.
* Support: 26.6, 25.8, with deeper downside near 24.5 (gamma/put pivot).
GEX Read (Sep 16)
* Highest positive NETGEX / Gamma resistance: 29.0
* 2nd Call Wall: 28.5, 3rd Call Wall: 30.0.
* Put walls / magnets: 24.5, 23.5, and 21.0.
* Options sentiment: Calls ~65%, IVR ~18.3, IVx ~67 → bullish skew with moderately high implied volatility.
Implication:
* Dealers may attempt to pin SOFI between 26.5 and 29 while awaiting fresh flows.
* A decisive hourly close >28.0 opens a path to 28.5–29.0 and possibly 30.0.
* A loss of 26.5 could lead to a quick slide toward 25.8 → 24.5.
Trade Scenarios
1) Bullish Breakout
* Trigger: 1H close >28.0 with strong volume.
* Entry: 28.1 on retest/hold.
* Targets: 28.5 → 29.0 → 30.0.
* Stop: Below 27.5.
* Options: 28/29 or 28/30 call debit spread expiring this week.
2) Range Fade
* Trigger: Failure to hold above 28.0 with clear rejection wicks.
* Entry: 27.9–28.0 short.
* Targets: 26.8 → 26.5.
* Stop: Above 28.3.
* Options: 28P or 28/26.5 put spread for a quick pullback.
3) Breakdown
* Trigger: 1H close <26.5 with failed retest.
* Entry: 26.4 short.
* Targets: 25.8 → 24.5.
* Stop: Back above 26.8.
* Options: 26/24.5 put spread for a deeper corrective move.
Scalping & Swing Notes
* Early session watch 27.6–28.0 pivot: acceptance above invites longs, repeated rejections favor shorts.
* EMA/VWAP retests near 27.3–27.5 can give low-risk buys if trend resumes.
Risk & Management
* With IV moderate-to-high, debit call spreads provide better risk/reward than straight calls.
* Always scale partial profits at first target and trail stops to lock gains.
This analysis is for educational purposes only and does not constitute financial advice. Always trade with a plan and manage risk carefully.

SOFI - 4hr TAThe "Front-Side" & "Back-Side" support levels reference FVG but labeled as such to simplify the candle being tested.
Backside candle in an accumulation range is the first candle in the range. When it is tested I expect a bigger bounce.
IF that EXPECTATION is not met THEN I expect price to target the Frontside candle or last candle in the range and hold through trend. (order block basically)
If at any point ( on lower timeframes) do distribution candles close under the swinglow of that frontside candle, Price is likely targeting the next range and I expect an influx of volume to confirm the moves direction.
likewise for the Inverse.
Backside candle in a Distribution range is the first candle.
Frontside candle is the last candle in the range.
(always from Left to Right.)

will SOFI be the HOOD of 2026?SOFI breaking out to all time highs.
Blue sky above.
Will NASDAQ:SOFI repeat what NASDAQ:HOOD did in 2025?
Both of them are in the top 10 momentum stocks of 2025.

SOFI: Bullish Momentum Poised for Breakout Amid Fintech Growth
Current Price: $26.55
Direction: LONG
Targets:
- T1 = $28.50
- T2 = $30.00
Stop Levels:
- S1 = $25.50
- S2 = $24.50
**Wisdom of Professional Traders:**
This analysis synthesizes insights from thousands of professional traders and market experts, utilizing collective intelligence to pinpoint SOFI’s high-probability trading setup. By aggregating trader wisdom and institutional insights, this approach identifies consensus opportunities that reduce cognitive biases and enhance the accuracy of outcomes in fintech equity trading. SOFI, with its ongoing innovation and sector leadership, has emerged as a standout player.
**Key Insights:**
SOFI’s strategic expansion into diversified financial services has been applauded by traders for its alignment with long-term market trends. Its ecosystem approach integrates lending, savings, investing, and payment solutions under a digital-first platform, maximizing customer engagement across growth demographics such as millennials and Gen Z. Recent earnings show year-over-year revenue growth driven by increased customer acquisition and operational efficiency, underscoring its transformation into a scalable enterprise.
From a technical standpoint, SOFI's chart signals are increasingly bullish, with significant support at $25. Key indicators like RSI and MACD reflect upward momentum, suggesting that price action may challenge the overhead resistance zone near $27.50. As fintech competition intensifies, professional traders view SOFI’s adaptability and technology-first service delivery model as durable competitive advantages.
**Recent Performance:**
SOFI has shown steady gains, rebounding strongly from sector-wide weakness earlier this quarter. The stock has displayed resilience, consolidating above $25 while outperforming other fintech peers. Its ability to maintain elevated trading volumes during rallies signals persistent institutional interest. Moreover, the stock is trending above its 50-day moving average, reinforcing bullish conviction among traders seeking short-term upside opportunities.
**Expert Analysis:**
Analysts have repeatedly highlighted SOFI's dual competitive edge as both a banking institution and technology innovator. Macro trends — including easing financial regulation and increased digital service adoption — are strengthening SOFI's outlook. Experts believe its position in the student loan and private lending segments could expand further, driven by proactive government policies. From a technical perspective, the stock is building momentum to test its $27.50 resistance line. Should this level break, it opens the door for a rally toward $30, supported by upward volume trends and strong institutional backing.
**News Impact:**
Recent news surrounding increased sector investment in fintech platforms, coupled with SOFI’s announcements of new membership incentives and mortgage programs, provide substantial tailwinds. Regulatory clarity regarding lending practices has also reduced SOFI’s compliance risks, enabling it to focus on growth via expanded product offerings. These headlines bolster broader sentiment, affirming SOFI’s path toward greater market dominance.
**Trading Recommendation:**
SOFI presents a compelling long opportunity based on its strong fundamental progress and bullish technical signals. A breakout above the critical resistance at $27.50 is likely to propel prices toward our targets of $28.50 and $30.00. Risk should be mitigated with conservative stop-loss levels set at $25.50 and $24.50, allowing flexibility while protecting downside exposure. With sector trends favoring innovation-driven financial solutions, SOFI remains a high-potential trade for investors seeking exposure to fintech leaders.
Do you want to save hours every week?

SoFi Technologies (SOFI) – Prepping for Liftoff?Analysis Overview:
The chart suggests that SOFI may be setting up for a major bullish reversal, but confirmation is still needed. Let’s break it down:
Key Bullish Factors:
✅ Optimal Trade Entry (OTE)
Price is currently sitting at an OTE level, a premium zone for long setups often used by smart money. These zones historically mark powerful reversal points.
✅ Monthly Fair Value Gap (FVG) Respected
The stock tapped into a monthly FVG—a high-probability demand zone—suggesting institutional interest. A break and close above this zone would strengthen the bullish case significantly.
✅ 30 Moving Average (MA) as Confirmation
Price is still below the 30MA. A clear break and close above the 30MA would serve as the first strong confirmation that buyers are regaining control.
✅ Massive Upside Potential
If this plays out, the first target is the previous buy-side liquidity at $18.33, and if momentum sustains, we could even see a long-term move toward the all-time high at $28.54—a potential 228% gain from current levels.
What We Want to See Before Full Confidence:
🔹 Price to break and close above the 30MA
🔹 Clear displacement through the Monthly FVG
🔹 Sustained bullish volume stepping in
Conclusion:
SOFI could be gearing up for a powerful upside run, but let the market confirm it. Watch the 30MA and how price behaves around the FVG. If those get respected and price pushes higher—this could be a sleeper play to watch in 2025.
🧠 As always... DYOR (Do Your Own Research)!

SOFI Market Preview for Monday, September 8
Price Action & Market Structure
* SOFI is trading near 25.6–25.7, bouncing back after a strong dip recovery.
* Price broke above a falling wedge, now consolidating right at resistance levels.
* As long as 25.3–25.0 holds, structure favors upside continuation toward higher gamma walls.
Key Levels
* Resistance (Upside Caps):
* 25.7–26.0 → immediate resistance zone.
* 26.5 → local supply level.
* 27.0–27.5 → Major Gamma Wall & Call resistance.
* 28.0 → Higher Call Wall.
* Support (Downside Floors):
* 25.3 → intraday breakout retest level.
* 25.0 → HVL + Put support (strong anchor).
* 24.2–24.0 → secondary Put Wall support.
* 23.5–23.0 → deeper downside cushion.
Options Sentiment (GEX & IV)
* GEX: Skewed toward Calls (45.6%), showing bullish option positioning.
* IVR: Low at 13.0, meaning options market isn’t pricing aggressive volatility.
* Gamma Walls:
* 27.0 = Highest Call Wall resistance.
* 25.0 = Strong Put Support.
Indicators
* MACD (15m): Bullish crossover, momentum still supportive.
* Stoch RSI: Cooling from overbought, suggesting possible small pullback before continuation.
Scenarios for Today
Bullish Case (favored if 25.3–25.0 holds):
* Hold support above 25.3, push through 25.7–26.0.
* Targets: 26.5 → 27.0 Gamma Wall, with possible extension to 27.5–28.0 if volume expands.
Bearish Case (if 25.3 fails):
* Breakdown below 25.3 drags price back toward 25.0 HVL.
* If 25.0 fails, deeper retrace to 24.2–24.0 zone.
Trading Thoughts
* Longs: Favor dip entries near 25.3–25.0, targeting 26.5–27.0.
* Shorts: Fade rejections at 26.0–26.5, stops above 27.0.
* Stops:
* Longs → below 24.8.
* Shorts → above 27.0.
Summary
SOFI is showing bullish recovery momentum, consolidating just below 26.0 resistance. Options sentiment favors upside, with bulls targeting 27.0–27.5 Gamma Wall. As long as 25.0 holds as support, bias stays bullish; a breakdown flips bias to bearish with risk toward 24.0–23.5.
⚠️ This analysis is for educational purposes only, not financial advice. Always confirm setups with live order flow.

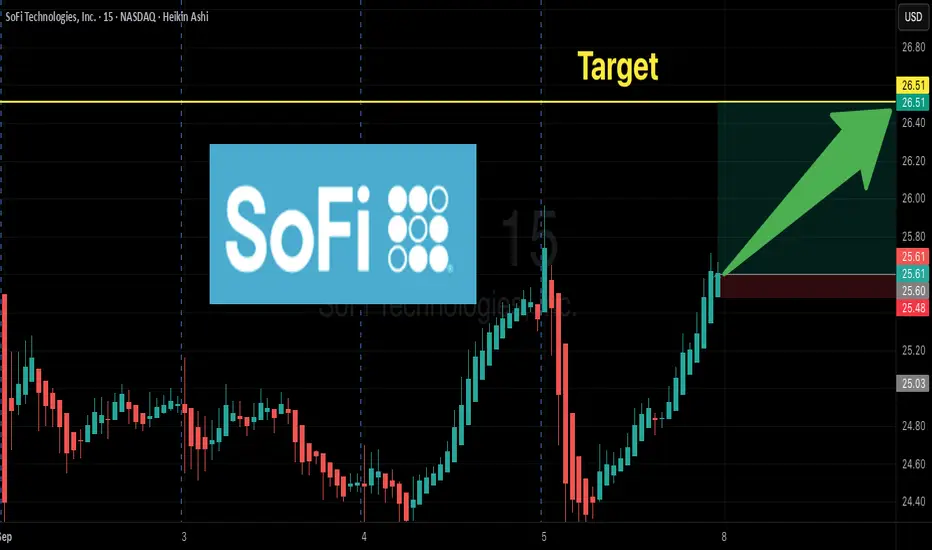
SOFI $26.50Call – 100% Profit Potential in 5 Days?
🚀 **SOFI Weekly Bullish Alert! \$26 Call Play 💎🔥**
📈 **Strong Call Flow + Rising RSI → Short-Term Bounce Potential!**
**Trade Snapshot:**
* **Instrument:** SOFI
* **Strategy:** Buy Call (single-leg, naked)
* **Strike:** \$26.50
* **Expiry:** 2025-09-12 (Weekly)
* **Entry Price:** \$0.65 (ask at open)
* **Profit Target:** \$1.30 (+100%)
* **Stop Loss:** \$0.33 (50%)
* **Size:** 1 contract
* **Confidence:** 75%
**Rationale:**
* 🔹 Daily & Weekly RSI bullish; strong momentum
* 🔹 Call/Put ratio = 1.80 → institutional bullish skew
* 🔹 Low VIX → cheap premium for a tactical short-term play
* 🔹 Weak weekly volume → risk-managed sizing & tight stop required
**Key Notes:**
* Exit by Thursday to avoid Friday gamma/time-decay
* Watch pre-market gap; stand aside if weak follow-through
* Partial profit-taking possible at +50% (\$0.98)
📊 **Summary:** Strong institutional bullish options flow + rising momentum make \$26 calls a high-probability short-term trade. Risk-managed, tactical entry, 100% profit target.
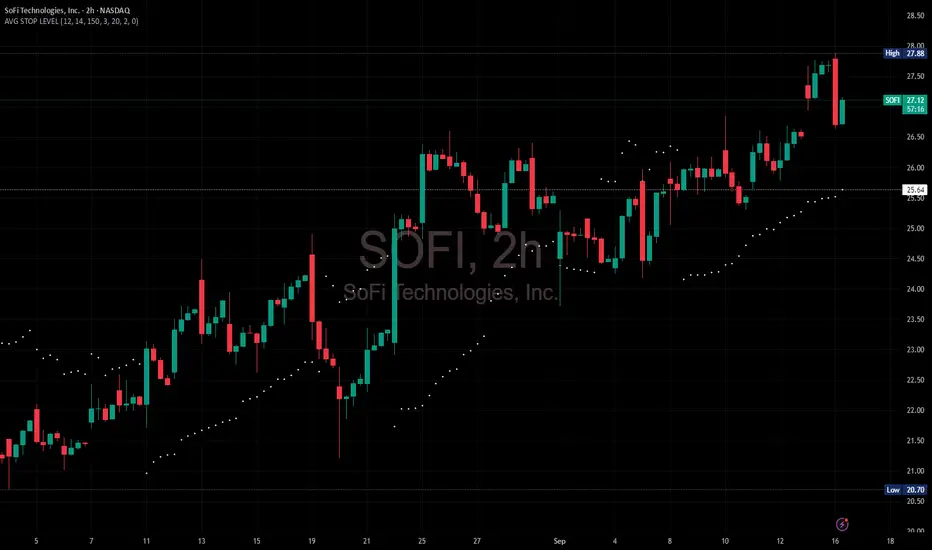
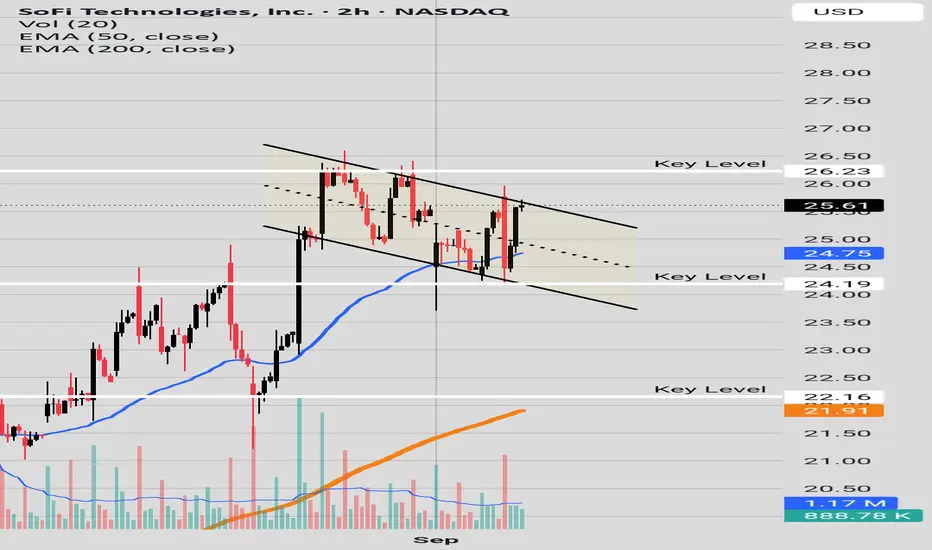
Break out neededSofi has bearish divergence on the weekly chart. But on the 2 hr chart we see a possible bullish flag forming, If price does not break out we may see a return to the 50 EMA in blue around 24.75. Please see chart for key levels.
SOFI $25 CALLS — Lotto Gamma Play into Friday
# 🚀 SOFI Lotto Gamma Play (Sep 4, 2025) 🚀
💡 Strong call flow (C/P = 2.0) but weak volume + falling RSI → HIGH RISK lotto setup
📊 **Market Snapshot**
* 📉 **RSI:** Daily 56.6 / Weekly 79.3 → both falling (momentum fading)
* 📊 **Volume:** 0.6x prior week → low institutional support
* 🔥 **Options Flow:** Strong bullish (heavy calls)
* 🛡️ **VIX:** \~15.7 → low vol regime (favorable for speculation)
* ⚠️ **1 DTE Risk:** High gamma / theta → premium can go to zero fast
---
## ✅ Trade Idea (high-risk scalp)
* 🎯 **Instrument:** SOFI
* 🔀 **Direction:** CALL (long)
* 💵 **Strike:** 25.00
* 📅 **Expiry:** 2025-09-05 (1 DTE)
* 💰 **Entry Price:** 0.22 (ask at open)
* 🎯 **Profit Target:** 0.44 (+100%)
* 🛑 **Stop Loss:** 0.11 (-50%)
* 📏 **Size:** 1 contract only (tiny risk)
* ⏰ **Max Hold:** Exit by **Friday EOD**
⚡ Confidence: **60%** → Lotto play, not a trend trade
---
### 🔖 Hashtags
\#SOFI #OptionsTrading #DayTrading #0DTE #GammaSqueeze #CallOptions #StockMarket #ScalpTrade #TradingSetup #FlowTrade

Nail BiterWe have a wedge shape consolidation.
The 200 EMA recently cross the 50 EMA, which at times is a bearish sign.
The wedge shape is facing resistance from the 200EMA and 50EMA.
The RSI is still under 50.
The Bulls and the Bears are going at it.
Watch out for direction of breakout.
Please see chart for key levels.
