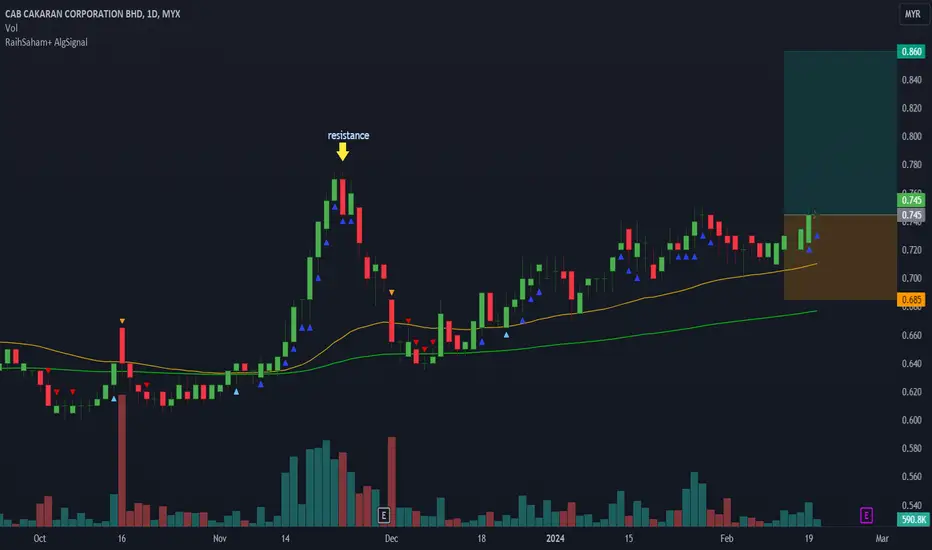
Potential to go hgherThe chart shows that the counter has potential to go higher. the estimated price will be BO:0.795,SL:0.76,TP:0.835
Next report date
—
Report period
—
EPS estimate
—
Revenue estimate
—
0.115 MYR
75.47 M MYR
2.30 B MYR
179.70 M
About CAB Cakaran Corp. Bhd.
Sector
Industry
CEO
Hoon Phong Chuah
Website
Headquarters
Perai
Founded
2002
ISIN
MYL7174OO005
FIGI
BBG000DFZZK3
CAB Cakaran Corp. Bhd. is an investment holding company, which engages in the production of food products for domestic and international markets. It operates through the following business segments: Investment Holding, Integrated Poultry, Fast Food Business, Retailing, and Drone Services. The company was founded on June 20, 2002 and is headquartered in Perai, Malaysia.
Related stocks

CAB, AlgoSignal reveals potential uptrendSeveral indicators within my algorithmic system are signaling a potential uptrend. These include:
- Increased volume: Activity is picking up, suggesting growing interest and potential momentum.
- Mid- to long-term uptrend: Both the 50-day and 150-day exponential moving averages are pointing upward,
triangle patternCAB follow the triangle pattern, cut lost point should be set around 0.61/0.615 . 9 month QR in good result but share price just maintain around the range, it is not a good sign. anyway its in the chart pattern for me to follow. make clear that I do not hold any position. only a study case.

CAB : Filter 3 has appeared at M15The appearance of filter 3 indicates a strong breakout signal with price and volume confirming the upward momentum.
The MACD crossing above the zero line is often considered a bullish signal.
If the price breaks F3's high, it is more likely the price will make new high.
TAYOR.

CAB VCP SetupPrevious CAPITALA and KPPROP VCP got good return (~30%). Hopefully some of you manage to get that ride too.
Here you go for another VCP candidate:
C1: -21%
C2: -8%
C3: -4%
Note on the recent price/volume action. Brewing for something.
Let's see the upcoming movement.


CAB is going for the last leg up for RAYA festivalBased on EWO, it is possible that CAB is going for the last leg of smaller W-5 to TP area in blue line.
This is in sync with chicken price hike especially during festival.
Next would be a retracement, it could be shallow or deep retracement and based on the current hype, it should be shallow.
Ha

CAB in ABC formation.CAB in ABC formation.
Rebounded at EMA100 and Fibo618 at 0.490.
Probable EP is at 0.490 to retest EMA100 and Fibo618.
Probable TP is 52wh at 0.565.
Probable CL is below EMA200 and Fibo786 at 0.465.
This is for study purposed only and not an investment call.


See all ideas
Summarizing what the indicators are suggesting.
Neutral
SellBuy
Strong sellStrong buy
Strong sellSellNeutralBuyStrong buy
Neutral
SellBuy
Strong sellStrong buy
Strong sellSellNeutralBuyStrong buy
Neutral
SellBuy
Strong sellStrong buy
Strong sellSellNeutralBuyStrong buy
An aggregate view of professional's ratings.
Neutral
SellBuy
Strong sellStrong buy
Strong sellSellNeutralBuyStrong buy
Neutral
SellBuy
Strong sellStrong buy
Strong sellSellNeutralBuyStrong buy
Neutral
SellBuy
Strong sellStrong buy
Strong sellSellNeutralBuyStrong buy
Displays a symbol's price movements over previous years to identify recurring trends.
Frequently Asked Questions
The current price of CAB is 0.860 MYR — it has increased by 4.88% in the past 24 hours. Watch CAB Cakaran Corp. Bhd. stock price performance more closely on the chart.
Depending on the exchange, the stock ticker may vary. For instance, on MYX exchange CAB Cakaran Corp. Bhd. stocks are traded under the ticker CAB.
CAB stock has risen by 6.83% compared to the previous week, the month change is a 10.26% rise, over the last year CAB Cakaran Corp. Bhd. has showed a 38.71% increase.
We've gathered analysts' opinions on CAB Cakaran Corp. Bhd. future price: according to them, CAB price has a max estimate of 1.21 MYR and a min estimate of 1.21 MYR. Watch CAB chart and read a more detailed CAB Cakaran Corp. Bhd. stock forecast: see what analysts think of CAB Cakaran Corp. Bhd. and suggest that you do with its stocks.
CAB stock is 4.85% volatile and has beta coefficient of 1.28. Track CAB Cakaran Corp. Bhd. stock price on the chart and check out the list of the most volatile stocks — is CAB Cakaran Corp. Bhd. there?
Today CAB Cakaran Corp. Bhd. has the market capitalization of 603.16 M, it has increased by 0.63% over the last week.
Yes, you can track CAB Cakaran Corp. Bhd. financials in yearly and quarterly reports right on TradingView.
CAB Cakaran Corp. Bhd. is going to release the next earnings report on Nov 27, 2025. Keep track of upcoming events with our Earnings Calendar.
CAB net income for the last quarter is 22.72 M MYR, while the quarter before that showed 19.75 M MYR of net income which accounts for 15.06% change. Track more CAB Cakaran Corp. Bhd. financial stats to get the full picture.
Yes, CAB dividends are paid annually. The last dividend per share was 0.01 MYR. As of today, Dividend Yield (TTM)% is 1.16%. Tracking CAB Cakaran Corp. Bhd. dividends might help you take more informed decisions.
CAB Cakaran Corp. Bhd. dividend yield was 1.59% in 2024, and payout ratio reached 9.29%. The year before the numbers were 0.79% and 3.27% correspondingly. See high-dividend stocks and find more opportunities for your portfolio.
As of Nov 2, 2025, the company has 4.61 K employees. See our rating of the largest employees — is CAB Cakaran Corp. Bhd. on this list?
EBITDA measures a company's operating performance, its growth signifies an improvement in the efficiency of a company. CAB Cakaran Corp. Bhd. EBITDA is 178.35 M MYR, and current EBITDA margin is 6.03%. See more stats in CAB Cakaran Corp. Bhd. financial statements.
Like other stocks, CAB shares are traded on stock exchanges, e.g. Nasdaq, Nyse, Euronext, and the easiest way to buy them is through an online stock broker. To do this, you need to open an account and follow a broker's procedures, then start trading. You can trade CAB Cakaran Corp. Bhd. stock right from TradingView charts — choose your broker and connect to your account.
Investing in stocks requires a comprehensive research: you should carefully study all the available data, e.g. company's financials, related news, and its technical analysis. So CAB Cakaran Corp. Bhd. technincal analysis shows the strong buy rating today, and its 1 week rating is strong buy. Since market conditions are prone to changes, it's worth looking a bit further into the future — according to the 1 month rating CAB Cakaran Corp. Bhd. stock shows the strong buy signal. See more of CAB Cakaran Corp. Bhd. technicals for a more comprehensive analysis.
If you're still not sure, try looking for inspiration in our curated watchlists.
If you're still not sure, try looking for inspiration in our curated watchlists.