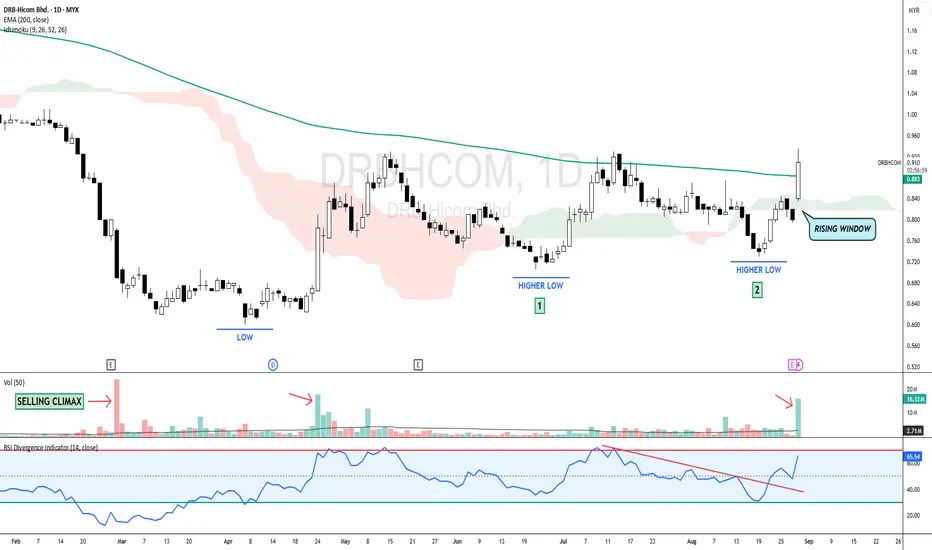
DRBHCOM - BREAKOUT EMA 200 with VOLUME !DRBHCOM - CURRENT PRICE : RM0.910
DRBHCOM broke out EMA 200 with high trading volume. At the same time, the stock is also above ICHIMOKU CLOUD. Take note that the lows in price are getting higher - indicating demand is increasing. This bullish scenario is also supported by recent breakout down trendline in RSI oscillator. RSI is rising and currently at 65.54.
Take note also that there is a double bottom chart pattern with the second low is slightly higher than previous low.
There is possibility that the price may trend higher in near term. Rising window low RM0.820 may acts as strong support.
ENTRY PRICE : RM0.900 - RM0.910
TARGET : RM0.980 and RM1.09
SUPPORT : RM0.820
Notes : The company just announced its QUARTER REPORT. For more details, please visit their website. Previously I had wrote technical report for the company (already hit my both targets). I share the link below here.
Trade ideas
Right time to buyThis shows that the chart is in an uptrend phase which is good to buy.The indicator laso shows that it will increase in price and moving up.The trading plan is BO:1.18,SL:1.02,TP:1.3

DRBHCOM - The LOW is getting HIGHER !DRBHCOM - CURRENT PRICE : RM0.815
The stock made a HIGHER LOW recently - this may consider as a half portion of new uptrend is completed. A breakout above RM0.930 will form the higher high structure - which confirm the new uptrend phase.
For short term trading purposes, short term traders may anticipate to buy if the stock breakout nearest resistance of RM0.830 - which will give an entry point at RM0.835. So this is a pending breakout stock. Nearest target will be RM0.870 and RM0.910. While support will be RM0.795. Take note also that MACD give a bullish hint.
ENTRY PRICE : RM0.835
TARGET : RM0.870 and RM0.910
SUPPORT : RM0.795
Notes : If the stock breakout RM0.930 in the future, it is a sign of strong bullish momentum (strong uptrend). So at that particular time, trend follower traders may anticipate to buy at RM0.935 - RM0.940.

DRB Hicom. Good billions of investment? 30/August/23I must be reading chart wrongly as no matter how many time I reviewing its all time history chart it still shown a "Very Big bearish Triangle" waiting for........

DRBHCOM 1619 good chance?trend potential triangle show the buy point, the current price is above the long term downtrend red band, is it a potential reversal from bearish to bullish?
refer to GDMM, green candle is going up from the bottom, potential a short term buying chance.
from chart pattern, this buy point is from the higher low, i predict there is still a chance to go up in future.


DRBHCOM has the potential to go upGreat QR result shown last Feb 24.
The best car sales news just released last week.
The price just retraced and cross Ichi cloud.
Therefore, DRBHCOM has the potential to go up.


DRB-HICOM PRICE ACTION MOVEMENT FORECAST DAILYLong, recommended stop loss 1.945, and target to reach 2.235.


New uptrend in the making!On the brink of reversing the downtrend that started since mid 2019, and forming a base with a target as shown in ABCD chart pattern. With all major local automakers reporting highest sales in month of July in year 2020, this might just be the catalyst. Cheers.....
Disclaimer: Not a recommendation to buy or sell. Trade at own risk.


DRB HICOM DRB HICOM , NAMPAK AKAN BERSINAR SEKIAN LAMA MENYEPI..
LAST CANDLE DAPAT MENUTUP GAP ,
MOMEMTUM KENAIKAN MAKIN MENGUATKAN UNTUK RIDE .. WATCH OUT JAGA CL
JIKA MINGGU DEPAN BERJAYA MELEPASI 200MA .. AKAN TERUS BERTAHAN ...

Incentive for local vehicle purchaseGovernment's announcement today 100% tax incentive for local assembled cars coincide with the launch locally assembled X70 earlier of the year will definitely support its sales barring inactivity during mco, furthermore with the anticipated launch of X50 will support its sales volume for the year and thus its profitability. Immediate upside TP2.10


<TradeVSA> Opportunity in DRB & DRB-C94 Strength in the chart:
1. Short term reversal
2. Pentagon triggered with volume
Disclaimer
This information only serves as reference information and does not constitute a buy or sell call. Conduct your own research and assessment before deciding to buy or sell any stock


3 Major Sign of Weakness in Inari and Why You Should KnowIdentify the background and intention of the Smart Money helps you as a VSA trader to plan your trading plan better.
Follow the footprints of the Smart Money.
Send us your preference stock to review based on TradeVSA chart by comment at below.
Disclaimer
This information only serves as reference information and does not constitute a buy or sell call. Conduct your own research and assessment before deciding to buy or sell any stock
