Trade ideas

EASY123 Prediction @MYX GDEXPrediction: Sideway to Rally (When it breaks 0.425)
Target Price: R1=0.41-44, R2=0.48-51, R3=0.58-63
Support/Cut Loss: S1=0.35, S2=0.33
*Trend direction: UPTREND - Higher-High & Higher-Low positive movement
*Sideways movement and supported strongly along our Lifeline (Redline)
*Turning points (White-candle) have appeared on 22-Jun, 08 & 29-Jul, an indication of the price revert to upward direction.
*Acceleration (White-diamond) signaled on 06 & 21-Aug, an indication of strong momentum.
*Take-off zone (Yellow-candle & Bell-alert) appeared on 21-Aug, an indication of price rally zone to be started.
*Disclaimer: This is not a Buy or Sell suggestion but solely sharing the information...Trade at your own risk.
*Preference Strategy: Swing trading (Follow the BUY/SELL Signal respectively).
*Reminder TP & CL is an individual preference & decision. No fixed rule or guideline for it.
*If you are interested in our trading template. Feel free to drop us a message, we are happy to share with you.
Signal's Interpretation:
BUY Signal:-
*Green-Background = Uptrend
*BT-Yellow-Diamond = Bottom signal.
*Green-Upward-Triangle = Potentially a Bottom signal.
*White-Diamond = Strong upward momentum accelerator.
*White-Candle = Turning point or a trend reversal.
*Yellow-Candle + Alert-Bell = Potential Price take-off area.
SELL Signal:-
*Red-Background = Downtrend.
*Red-Dot = Potentially a Top signal.
*Blue-Candle = Potential price selling off area.


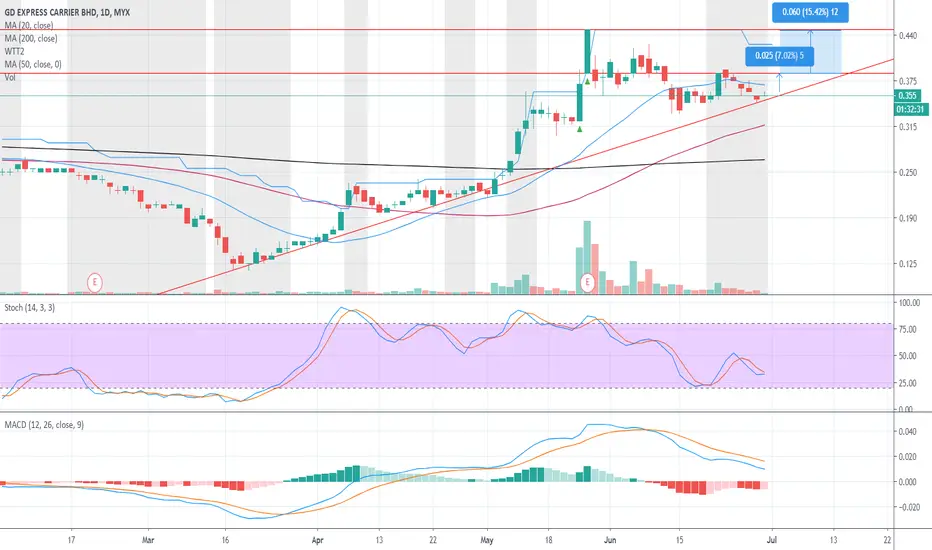
MACD Line Above Centreline (Strong Movement), Ascending TriangleThe support and resistance of GDEX are 0.335 and 0.38 respectively.
It is observed that the MACD line of GDEX is above the centreline indicating some degree of strength in the price movement.
Ascending Triangle identified at 29 Jul 2020.
This pattern is still in the process of forming.
Possible bullish price movement towards the resistance 0.385 within the next 71 days (ETA 8 Oct 2020)
Resistance 2 : 0.385
Resistance 1 : 0.380
Support 1 : 0.300
Support 2 : 0.330

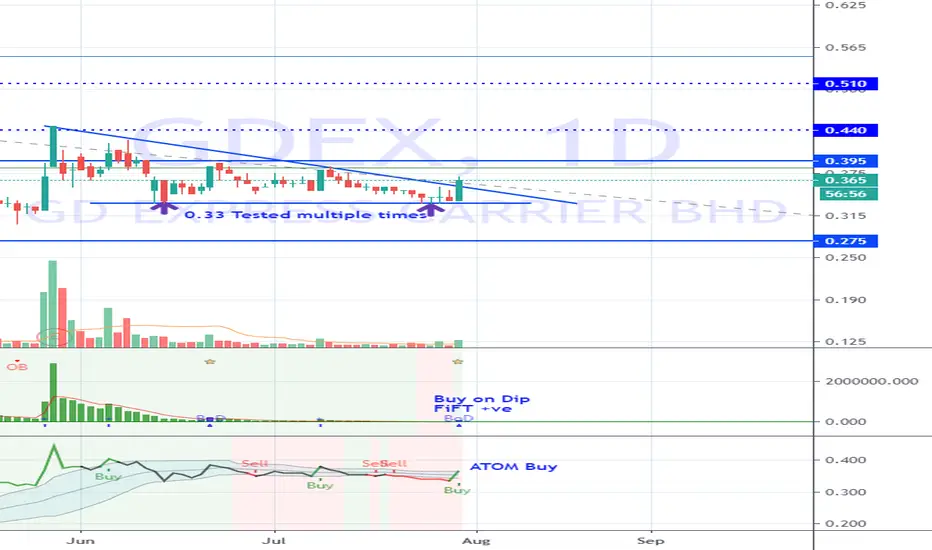
GDEX - Potential BoD ?Monitor ..
Lately POS and GDEX are very active. Volume relatively higher but still low.
Fast Turtle Buy signal appear.
0.33 tested many times..
ATOM Buy
FiFT +ve with BoD if price able to maintain above 0.355
DISCLAIMER: This analysis is for educational purposes only. It is based on my personal view from a technical standpoint. Trade at your own risk and judgement.

GDEX - Rise after the announcement of MCOHi, good evening guys.
There will be possibility Logistic will be active back after the correction.
This is because of the announcement regarding MCO that has been made at 4pm had triggered this company.
From the pattern, i see an opportunity to grow long. Almost 3months from the fresh breakout, and the descending triangle has formed. The price decrease as the volume shrink.
I see the strong support should be hold the price at RM0.330 and the first resistance need to aware of at RM0.355.
I had checked the chart based on multiple indicators and oscillators to double confirm the chart.

GDEX - not only it has recover from Covid19 but even betterCovid19 hit transport sector just like any other sector, for GDEX the lowest price is 0.115 on 1th Mar 2020.
Support level before Covid19 at 0.26, and now after Covid19 its last price is 0.355.
It reached 52W high 0.445 on 27th May.
Based on STOCH we can see trend changing.
Afterall GDEX is a good place to put our money in, who on earth don't buy online? It even better after Covid19 because people spend more while staying at home, and they dont prefer to go out for shopping.

GDEX - RepostMy view on this counter. Price already retest triangle pattern area but failed to make new HH. Expect price to go lower into decision point area for entry as there are FTR - Fail to return which failed / leaving only shadow to retest demand zone area/decision point .MIN SL if breakout the zone.

GDEXMy view on this counter. Price already retest triangle pattern area but failed to make new HH. Expect price to go lower into decision point area for entry. MIN SL

Where is this going?If price close and trade on the orange zone it will be a down trending which clearly buy is not an option

GDEX Trading Analysis from Newbie.Yellow : MA6
Red : MA20
Green : MA50
Blue : MA200
1. MA200 is below MA50. MA50 is below MA20. The Monitor Line is appear. So, the counter is in Stage 2 and Uptrend.
2. MA6 starting go below the candle body. The price starting continue to go higher.
3. SmartMCDX : Red is Banker. The Red is start to buy.
4. Trendline : the candle is starting to breakout.
5. Volume : The volume is more than 10M.
My personal trading plan;
1. wait for pullback at 0.37 and i will entry at this price.
2. i will hold the position until MA6 start go on top of the candle body, then i will sell.
Thank You.


14 jun KAUNTER TRANSPORTATIONWebsite : Link
Corporate Name : GD EXPRESS CARRIER BERHAD
Symbol & Code : GDEX (0078)
Board : MAIN
Shariah : Shariah Compliant Compliant
Sector : Transportation & Logistics
Sub-Sector : Transportation & Logistics Services
Dengan peningkatan pembelian online. Gdex mampu menjana pendapatan dengan trend sekarang.
support dia area 0.36
resistance midterm di area 0.445

Ichimoku studiesBuy condition on 08.05.2020:
price and chikou is > all(MA 200, cloud, TK)
future cloud is green
T>K
Stop Loss:
MA / Tenkan / Kijun / flat cloud
Sell condition:
Volume bar decreases. sell the next day, 15th.
I think we can analyze the at least previous 3 volume bars.
continuous green volume might indicates accumulation.
maybe this can filter false breakout.

Ichimoku studiesBuy condition on 08.01.2018:
price and chikou is > all(MA 200, cloud, TK)
future cloud is green
T>K
Stop Loss:
MA / Tenkan / Kijun / flat cloud
Sell condition:
Volume bar decreases.
Hit stop loss the next day.
However it's breakeven.
False breakout.
Conclusion:
Need to find a way to avoid false breakout.

Ichimoku StudiesBuy condition on 22.09.2016:
price and chikou is > all(MA 200, cloud, TK)
future cloud is green
T>K
Stop Loss:
MA / Tenkan / Kijun / FLAT CLOUD
Sell condition:
Volume bar decreases on 27th. so sell on 28.
Trend: Breakout

Ichimoku studiesBuy condition on 15.03.2017:
price and chikou is > all(MA 200, cloud, TK)
future cloud is green
T>K
Stop Loss:
MA / Tenkan / Kijun
Sell condition:
Volume bar decreases on 20th. so sell on 21.
Trend: breakout


Gdex - BODEP : 375
CL : 365
S : 370
R1 : 400
R2 : 430
Number of Share: 5.641b
Sector : Transportation & Logistics


GDEX: JUST DRAW THE LINE! IT'S A LONG STRATEGYR1: 0.405
R2: 0.415
GDEX currently on fibo retracement for some profit taking. I think it will continue "jalan yang lurus yang membawa keuntungan" in the next day forward. haha..:)
"make it simple & profit"
