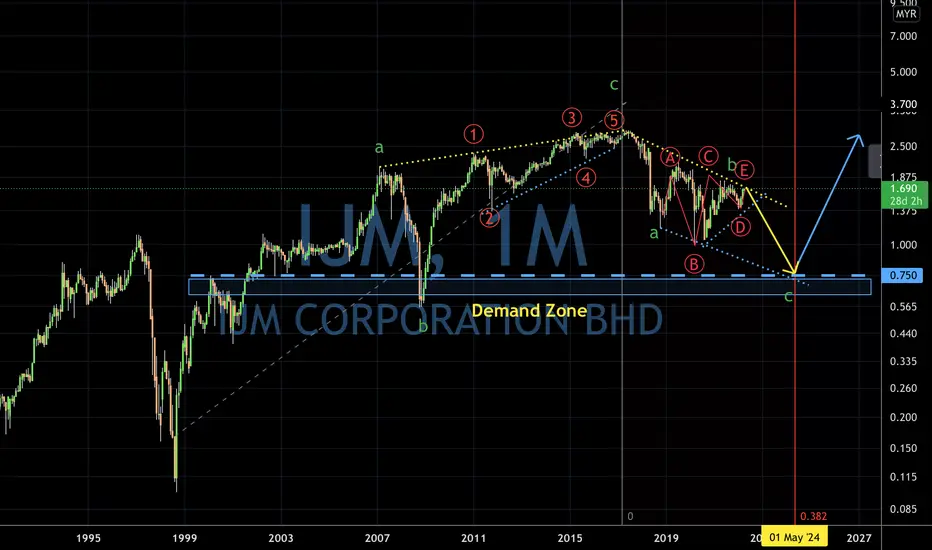
IJM movement had spoken### Technical Analysis of IJM Corporation Berhad (IJM)
**As of July 29, 2025**
---
#### **1. Trend Analysis**
- **Current Price Trend**:
- IJM is in a **bullish trend** on the medium-to-long-term timeframe.
- Key observations:
- **Higher Highs & Higher Lows**: The stock has con
Next report date
—
Report period
—
EPS estimate
—
Revenue estimate
—
0.12 MYR
403.38 M MYR
6.25 B MYR
2.56 B
About IJM Corporation Berhad
Sector
Industry
CEO
Chun Fai Lee
Website
Headquarters
Petaling Jaya
Founded
1983
ISIN
MYL3336OO004
FIGI
BBG000BF3ZS2
IJM Corp. Bhd. engages in the construction and investment holding activities. It operates through the following segments: Construction, Property Development, Manufacturing and Quarrying, Plantation, and Infrastructure. The Property Development segment focuses on the development of land into vacant lots, residential, commercial, and industrial buildings. The Manufacturing and Quarrying segment produces and sells concrete products and includes quarrying activities. The Plantation segment cultivates the oil palms, mills fresh fruit bunches, and trades crude palm oil. The Infrastructure segment comprises of tollway, port operations, and telecommunications. The company was founded on July 16, 1983 and is headquartered in Petaling Jaya, Malaysia.
Related stocks

IJM - Wave 1 in progressJust let Wave 1 make a move first, and then we wait for entry after completion of Wave 2.This is just my view on EW.
Not recommended to trade based on my view.
TAYOR.

IJM - Completion of Corrective Wave EMajor Trend : Retracement
Minor Trend : Retracement
Note: In my opinion, the Wave C of Wave E is completed. Next wave could be Wave 1 of new uptrend.
This is just my point of view. Not recommended to buy or sell.

IJM, at bottom? Or ...The stock continues to decline, showing no clear signs of a reversal yet. The price remains in a downtrend, with each move lower reinforcing the bearish momentum.
At the moment, 2.10 serves as the key support level, where buyers may attempt to defend the price. On the upside, the nearest resistance

Monitor for Breakout continuation or Trend reversalUsing a higher timeframe (Weekly) to analyse the chart because it is in a consolidation stage.
RSI is at about 65 % & it is trading above the 3 EMAs, 20 - 50 -200.
For monitoring when it tests the Resistance.

IJM: MA lines ready...waiting correction completemajor 3rd wave, now waiting completion of correction sub-wave 4

IJM elliotwave updated 1/April/22IJM as one of the construction’s “conglomerate” in Malaysia probably “reflected “ earlier on economy slowdown and “react” slower on economy recovery....
IJM elliotwave updated 1/April/22IJM as one of the construction’s “conglomerate” in Malaysia probably “reflected “ earlier on economy slowdown and “react” slower on economy recovery....

IJM trendline support and resistanceClear indication for support and resistance at trendline in weekly chart, as shown here looking at stochastic.
Disclaimer: This is for educational purpose only, not a buy call.

IJM VCP SETUPIJM is developing VCP with below contraction:
C1: -17%
C2: -13%
C3: -6%
C4: -4%
The path is my prediction on the price movement. Let's see if it can stand firm on the moving average trendline or not.
There are movement is construction related stock. SUNWAY and WCT development also pretty nice.

See all ideas
Summarizing what the indicators are suggesting.
Neutral
SellBuy
Strong sellStrong buy
Strong sellSellNeutralBuyStrong buy
Neutral
SellBuy
Strong sellStrong buy
Strong sellSellNeutralBuyStrong buy
Neutral
SellBuy
Strong sellStrong buy
Strong sellSellNeutralBuyStrong buy
An aggregate view of professional's ratings.
Neutral
SellBuy
Strong sellStrong buy
Strong sellSellNeutralBuyStrong buy
Neutral
SellBuy
Strong sellStrong buy
Strong sellSellNeutralBuyStrong buy
Neutral
SellBuy
Strong sellStrong buy
Strong sellSellNeutralBuyStrong buy
Displays a symbol's price movements over previous years to identify recurring trends.
Frequently Asked Questions
The current price of IJM is 2.47 MYR — it has increased by 3.73% in the past 24 hours. Watch IJM Corporation Berhad stock price performance more closely on the chart.
Depending on the exchange, the stock ticker may vary. For instance, on MYX exchange IJM Corporation Berhad stocks are traded under the ticker IJM.
IJM stock has risen by 4.17% compared to the previous week, the month change is a −8.76% fall, over the last year IJM Corporation Berhad has showed a −19.28% decrease.
We've gathered analysts' opinions on IJM Corporation Berhad future price: according to them, IJM price has a max estimate of 4.00 MYR and a min estimate of 2.77 MYR. Watch IJM chart and read a more detailed IJM Corporation Berhad stock forecast: see what analysts think of IJM Corporation Berhad and suggest that you do with its stocks.
IJM stock is 2.03% volatile and has beta coefficient of 1.26. Track IJM Corporation Berhad stock price on the chart and check out the list of the most volatile stocks — is IJM Corporation Berhad there?
Today IJM Corporation Berhad has the market capitalization of 8.45 B, it has decreased by −2.03% over the last week.
Yes, you can track IJM Corporation Berhad financials in yearly and quarterly reports right on TradingView.
IJM Corporation Berhad is going to release the next earnings report on Nov 27, 2025. Keep track of upcoming events with our Earnings Calendar.
IJM net income for the last quarter is 95.60 M MYR, while the quarter before that showed 128.95 M MYR of net income which accounts for −25.86% change. Track more IJM Corporation Berhad financial stats to get the full picture.
IJM Corporation Berhad dividend yield was 3.33% in 2024, and payout ratio reached 60.87%. The year before the numbers were 2.88% and 40.91% correspondingly. See high-dividend stocks and find more opportunities for your portfolio.
As of Nov 13, 2025, the company has 3.6 K employees. See our rating of the largest employees — is IJM Corporation Berhad on this list?
EBITDA measures a company's operating performance, its growth signifies an improvement in the efficiency of a company. IJM Corporation Berhad EBITDA is 1.31 B MYR, and current EBITDA margin is 21.71%. See more stats in IJM Corporation Berhad financial statements.
Like other stocks, IJM shares are traded on stock exchanges, e.g. Nasdaq, Nyse, Euronext, and the easiest way to buy them is through an online stock broker. To do this, you need to open an account and follow a broker's procedures, then start trading. You can trade IJM Corporation Berhad stock right from TradingView charts — choose your broker and connect to your account.
Investing in stocks requires a comprehensive research: you should carefully study all the available data, e.g. company's financials, related news, and its technical analysis. So IJM Corporation Berhad technincal analysis shows the sell today, and its 1 week rating is sell. Since market conditions are prone to changes, it's worth looking a bit further into the future — according to the 1 month rating IJM Corporation Berhad stock shows the neutral signal. See more of IJM Corporation Berhad technicals for a more comprehensive analysis.
If you're still not sure, try looking for inspiration in our curated watchlists.
If you're still not sure, try looking for inspiration in our curated watchlists.