KAREX - Bullish sentimentThe price is trading above the Kumo, indicating a bullish sentiment.
The Tenkan-sen and Kijun-sen have a bullish crossover, supporting upward momentum.
The Chikou Span is above the price, reinforcing bullish confirmation.
NT (0.900): This level is immediate support and has been tested as a pullback
Karex Bhd.
No trades
Next report date
—
Report period
—
EPS estimate
—
Revenue estimate
—
0.005 MYR
208.00 K MYR
498.41 M MYR
427.75 M
About Karex Bhd.
Sector
Industry
CEO
Miah Kiat Goh
Website
Headquarters
Port Klang
Founded
1988
IPO date
Nov 6, 2013
IPO offer price
0.58 USD
Identifiers
2
ISIN:MYL5247OO001
Karex Bhd. is an investment holding company, which engages in the manufacture and sale of sexual wellness, medical, and health related products. The firm offers condoms, personal lubricants, probe covers, and foley balloon catheters. It operates through the following segments: Sexual Wellness, Medical, and Others. The company was founded by Huang Chiat Goh in 1988 and is headquartered in Port Klang, Malaysia.
Related stocks

Karex, how traders and inventor react?The stock began its pullback on February 18th but faced heavy selling pressure on February 28th, resulting in a sharp decline. It broke multiple support levels and recorded a significant 16% loss, signaling strong bearish momentum.
The MACD remains in a downward crossover (DC) and is below the zero

KAREX, another wave soon?Gained > 8% since the first post about Karex on 15/7.
Another wave coming soon?
It won't be my EP at this moment, as still OS.
Let it build the momentum. Maybe happen anytime begin next week onwards.
Let see what happen next. To follow up again.
Disclaimer: Mentioned stocks are solely based on o


Karex vs Topglove. Apple vs Orange? 29/Sept/22Karex as world largest condom producer + main “supplier” for Durex.. Some “compare” it with glove stock. E.g topglove. As both are the “biggest player” of “rubber”products..One should have the “same fate” of the others. Just 1 question. Does human need “standard SOP/ protocol “ during sex activities

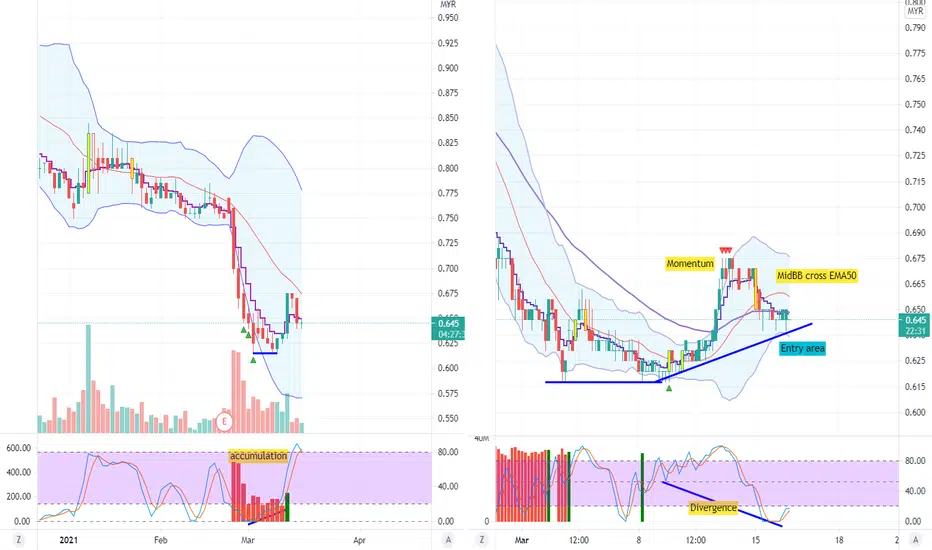
**Non-shariah**KAREX Good time to Entry BuyBuying Checklist
Daily TF
1. Bank accumulation exists.
2. Stochastic bullish divergence.
3. Price cross above EMA6
1H TF
4. MidBB cross EMA50.
5. Momentum Buy (Price close outside BB)
6. Stochastic Bullish continuation divergence.
Why entry now? Because 1H stochastic is oversold!
According to Ho
KAREX Target LONGAs we can see the candle seems like losing the volume already (candle become smaller) .Possible for long if there are reversal signal or double bottom pattern form at support area . SL after break support and TP at nearest resistant to be safe.


KarexImmediate Support Zone: 0.66-0.70
Immediate Resistance Zone: 0.80-815
Look for the entry opportunity near to Support Support zone by Using VT Stoch. indicator
Forecast next quarterly report to be release around end Nov 2020 will be further improved.
(Disclaimer: for demonstrate own planned trade re

See all ideas
Summarizing what the indicators are suggesting.
Neutral
SellBuy
Strong sellStrong buy
Strong sellSellNeutralBuyStrong buy
Neutral
SellBuy
Strong sellStrong buy
Strong sellSellNeutralBuyStrong buy
Neutral
SellBuy
Strong sellStrong buy
Strong sellSellNeutralBuyStrong buy
An aggregate view of professional's ratings.
Neutral
SellBuy
Strong sellStrong buy
Strong sellSellNeutralBuyStrong buy
Neutral
SellBuy
Strong sellStrong buy
Strong sellSellNeutralBuyStrong buy
Neutral
SellBuy
Strong sellStrong buy
Strong sellSellNeutralBuyStrong buy
Displays a symbol's price movements over previous years to identify recurring trends.
Frequently Asked Questions
The current price of KAREX is 0.740 MYR — it has increased by 0.70% in the past 24 hours. Watch Karex Bhd. stock price performance more closely on the chart.
Depending on the exchange, the stock ticker may vary. For instance, on MYX exchange Karex Bhd. stocks are traded under the ticker KAREX.
KAREX stock has fallen by −5.88% compared to the previous week, the month change is a −16.28% fall, over the last year Karex Bhd. has showed a −18.68% decrease.
We've gathered analysts' opinions on Karex Bhd. future price: according to them, KAREX price has a max estimate of 1.05 MYR and a min estimate of 0.47 MYR. Watch KAREX chart and read a more detailed Karex Bhd. stock forecast: see what analysts think of Karex Bhd. and suggest that you do with its stocks.
KAREX reached its all-time high on Jan 11, 2016 with the price of 3.160 MYR, and its all-time low was 0.260 MYR and was reached on Mar 19, 2020. View more price dynamics on KAREX chart.
See other stocks reaching their highest and lowest prices.
See other stocks reaching their highest and lowest prices.
KAREX stock is 2.76% volatile and has beta coefficient of 0.66. Track Karex Bhd. stock price on the chart and check out the list of the most volatile stocks — is Karex Bhd. there?
Today Karex Bhd. has the market capitalization of 758.49 M, it has decreased by −5.37% over the last week.
Yes, you can track Karex Bhd. financials in yearly and quarterly reports right on TradingView.
Karex Bhd. is going to release the next earnings report on Feb 23, 2026. Keep track of upcoming events with our Earnings Calendar.
KAREX net income for the last quarter is 4.60 M MYR, while the quarter before that showed −9.46 M MYR of net income which accounts for 148.59% change. Track more Karex Bhd. financial stats to get the full picture.
Karex Bhd. dividend yield was 1.39% in 2025, and payout ratio reached 5.00 K%. The year before the numbers were 1.86% and 67.57% correspondingly. See high-dividend stocks and find more opportunities for your portfolio.
As of Dec 11, 2025, the company has 3.49 K employees. See our rating of the largest employees — is Karex Bhd. on this list?
EBITDA measures a company's operating performance, its growth signifies an improvement in the efficiency of a company. Karex Bhd. EBITDA is 29.50 M MYR, and current EBITDA margin is 10.06%. See more stats in Karex Bhd. financial statements.
Like other stocks, KAREX shares are traded on stock exchanges, e.g. Nasdaq, Nyse, Euronext, and the easiest way to buy them is through an online stock broker. To do this, you need to open an account and follow a broker's procedures, then start trading. You can trade Karex Bhd. stock right from TradingView charts — choose your broker and connect to your account.
Investing in stocks requires a comprehensive research: you should carefully study all the available data, e.g. company's financials, related news, and its technical analysis. So Karex Bhd. technincal analysis shows the sell today, and its 1 week rating is sell. Since market conditions are prone to changes, it's worth looking a bit further into the future — according to the 1 month rating Karex Bhd. stock shows the sell signal. See more of Karex Bhd. technicals for a more comprehensive analysis.
If you're still not sure, try looking for inspiration in our curated watchlists.
If you're still not sure, try looking for inspiration in our curated watchlists.