MCLEAN - LOOKING FOR BULLISH SENTIMENTTrend Structure (N Wave)
Price formed an ABC correction (A–B–C) and rebounded from point (C), aligning with the uptrend support line.
The immediate resistance is around 0.320 (Tenkan & Kijun levels).
Ichimoku
Price at 0.310 is sitting just above the NT support (0.300).
Kumo: Price is retesting the top of the thin Kumo area. A close above 0.310–0.315 would strengthen the bullish stance.
Chikou Span: Hovering near candles, needs a clearer breakout to confirm trend continuation.
Bullish Case
If price holds above 0.300 (NT) and breaks 0.315–0.320, momentum could push towards 0.370 (N projection).
Further upside to 0.420 (V projection) if volume expands and Kumo breakout sustains.
Price is showing signs of resuming its uptrend after a corrective ABC wave. The NT level at 0.300 is a key pivot: holding above it maintains the bullish outlook, with 0.370 (N) as the first projection target and 0.420 (V) as an extended target. However, a breakdown below NT and the uptrendline could weaken the bullish scenario.
Bearish Risk
A breakdown below 0.300 (NT) may invalidate the bullish N-wave, with possible retest at the trendline near 0.285–0.290.
Losing that trendline could shift bias to bearish.
Entry Zone: Around 0.305–0.315 (if support holds).
Stop Loss: Below 0.295 (to protect against false breakout).
Targets:
TP1: 0.370 (N)
TP2: 0.420 (V)
Trade ideas

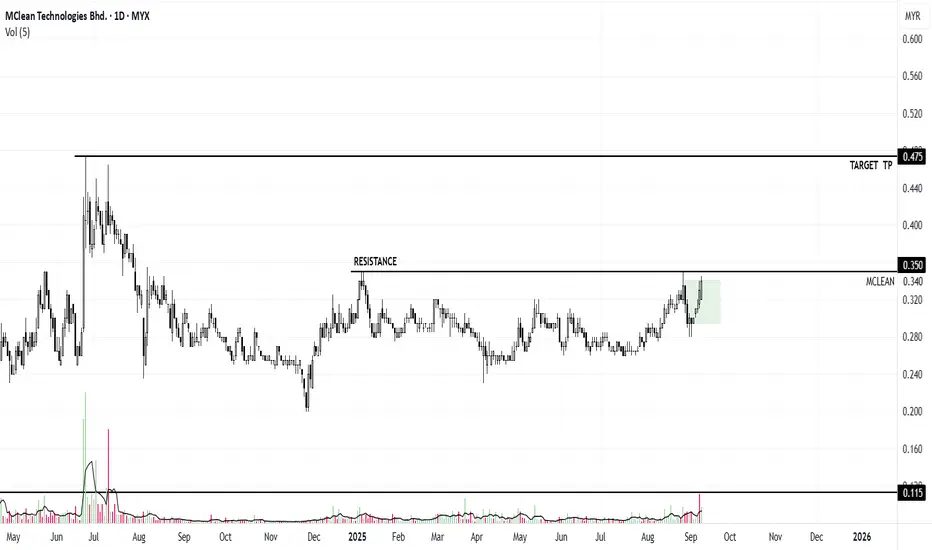
PREDICT BOX TRADING SET UP - PVA - PRICE DIRECTIONPredict
price will break zone /R / box with volume
will test Resistance / TP TARGET
duration monitoring - 2 to 4 weeks
TFW - Top Volume


UPDATE IDEA PREDICT PRICE DIRECTION ONLYUpdate only
hit TP Target !!!!
Monitor next price volume action


PRICE DIRECTION PREDICTIONPREDICT
trend - uptrend
need to BO R with volume to hit TP TARGET
duration monitoring - 1 month
MCLEAN - Looking for a strong bullish momentumN wave with E, N & NT projection.
The price indicates bullish momentum as it has recently pushed upward.
The Tenkan-sen is above the Kijun-sen, indicating a bullish trend. The price has broken through the cloud, confirming further upward movement.
Consider entering a long position around 0.310, especially if the price shows a breakout above the NT projection (0.325) with strong volume.
Confirmation: Look for a bullish candlestick close above 0.325 to validate this entry.
Set a stop-loss at 0.295, just below the previous swing low, to manage risk effectively.
Monitor market news and trends that could impact McLean Technologies, particularly in the tech or manufacturing sectors.
Watch for confirmation from volume indicators; increasing volume on upward price movements will help validate bullish sentiment.
Keep an eye on the Kumo for any potential shifts in market structure, particularly if the price breaks above it decisively, which would indicate a strong bullish outlook.
Note:
1. Analysis for education purposes only.
2. Trade at your own risk.

MCLEAN TECHNOLOGIES BERHAD - [MCLEAN]Mclean Technologies Berhad
Trend : The overall trend appears bearish in the medium term. The price has been making lower highs and lower lows since mid-July.
Support and Resistance :
###Key support level around 0.235-0.240 MYR
###Resistance levels at around 0.360 MYR and 0.420 MYR
Moving Averages : The stock is trading below both the short-term (likely 20-day) and long-term (likely 50-day) moving averages, indicating bearish sentiment.
Volume : There are sporadic volume spikes, particularly noticeable in late July and early August, which could indicate increased interest or significant events.
Price Action : The stock has shown high volatility, with sharp drops followed by quick rebounds. Most recently, there was a significant drop to the support level around 0.235 MYR, followed by a sharp rebound.
Bollinger Bands : The price has been touching the lower Bollinger Band frequently, suggesting oversold conditions at times.
Recent Movement : There's been a recent upward movement from the support level, but it's encountering resistance around the 0.340-0.360 MYR range.
Potential Patterns : There might be a potential double bottom forming at the 0.235-0.240 MYR level, which could indicate a possible trend reversal if confirmed.
Overall, the stock appears to be in a downtrend but showing signs of potential stabilization or reversal. Traders should watch for a confirmed break above resistance or a breakdown below support for clearer directional signals.

MYX:MCLEAN - Analysist on price movementPrice in between "Tenkan" Sen and "Kijun Sen" which is "Kijun Sen" as support and "Tenkan Sen" as resistance. Price need to break "Tenkan Sen" and 0.295 to reach target N & E within stipulated time based on Wave, Price & Time Theory
Note:
Just a study for learning purposes.
Trade at your own risk.

long for mcleanthe price have break the trendline in H4 and the previous rsi has achieved 70%. i think its time to buy

MCLEAN ABOUT TO END CORRECTION WAVESeems like MCLEAN about to end the correction wave after the end of wave 5 . Stochastic shows price is currently OVERSOLD while RSI is around the middle suggesting healthy upward potential in near future. TRADE AT YOUR OWN RISK

Mclean (21/04/2021)21-04-2021
Counter : Mclean
Sector : Commercial Services, Miscellaneous Commercial Services
- Just breakout symmetrical triangle on Daily Timeframe
- Nearest Support at 0.450
- Have momentum to test resistance at 0.540
- Pattern Diamond up shows that the price can go until 0.595 unless it break below 0.435, the pattern will cancel.
- MACD crossing up above 0 and RSI above 50 sign of uptrend.
- MCDX shows good momentum of smart money coming in.


Mclean breakout with Volume Solid Volume Spike above average, entered before market close.
Rebound on critical channel support,
SL at 400
#TAYOR

MCLEAN Swing IdeaAs you can see the price is in an uptrend and also have crossed above the 20 MA, if the price managed to break above the trendline the price might go up to RM 0.5 - 0.525, but if the price does not break above the trendline the price might follow the trend range

MCLEAN - Pre Consolidation Breakout (Bullish Reversal)O INVESTMENT ADVICE IS PROVIDED EXCEPT FOR TECHNICAL ANALYSIS PURPOSE.
DISCLAIMER
Please consider your own interpretation of Opportunity & Risk. The author of this post strictly follows the Malaysian Security Commission ( SC ) Guidelines on the prohibition of Investment Advice by unlicensed parties. Any examples shall use historical charts without any recommendations and not to cause inducement to the public to take action or position (e.g. buy, sell or hold) regarding a particular class, sector, or instrument in relation to securities or derivatives. The author will never provide any investment or trading advice as the activity of giving investment advice is likely to be considered as a regulated activity under the Capital Markets and Services Act 2007 ( CMSA ). All posts made in Tradingview do not include any communications involving providing recommendations or opinions or includes any material, content or any statement which are likely to induce a person to take any action or position (e.g. buy, sell or hold) regarding a particular class, sector, or instrument in relation to securities or derivatives that is likely to be considered as “advising others concerning securities or derivatives”. The author will not recklessly make any statement, promise or forecast that is misleading, false or deceptive to induce or attempt to induce another person to deal in securities or derivatives. None of information posted in post can be used as investment decisions. Do not trade solely on the information posted. Trade at your own risk and judgement. A trader could potentially lose all money. Only risk capital that can be lost without jeopardizing ones financial security of lifestyle. Please seek licensed professional guidance if you plan to invest your capital seriously.


MCLEAN AnalysisDisclaimer: This is not a buy call but for learning purpose
Analysis
Quite far from major support (8% risk)
Will it rebound and create this beautiful channel?


