IDEA PREDICT PRICE DIRECTION ONLY via TFW TFW
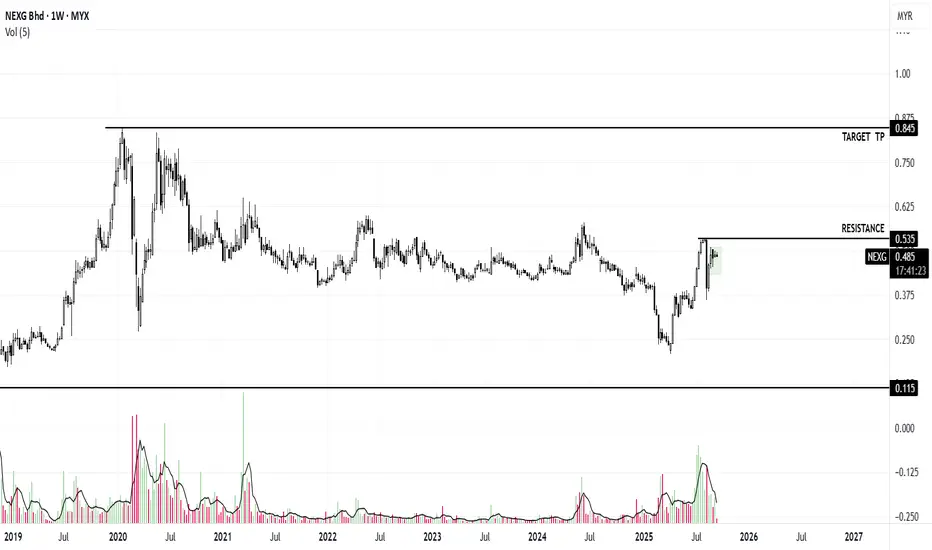
Trend - uptrend
chart pattern - bull
duration monitoring - 1 to 6 month
Next report date
—
Report period
—
EPS estimate
—
Revenue estimate
—
0.050 MYR
115.55 M MYR
373.45 M MYR
1.18 B
About NEXG Bhd
Sector
Industry
CEO
Abu Hanifah bin Noordin
Website
Headquarters
Kuala Lumpur
Founded
2008
ISIN
MYL5216OO006
FIGI
BBG0038LDPJ8
IPO date
Aug 3, 2012
IPO offer price
0.64 USD
NexG Bhd. is an investment holding company, which engages in the provision of management services. It operates through the following segments: Customised Smart Card Solutions (CSCS), Manufacturing, and Investment Holding. The CSCS segment focuses on large scale customized software and hardware systems for secure ID, total smart card solutions, and ICT project management. The Manufacturing segment manufactures cards and booklets. The Investment Holding segment consists of investment holding and provision of management services to the group of companies. The company was founded by Datuk Haji Abu Hanifah bin Noordin on March 13, 2008 and is headquartered in Kuala Lumpur, Malaysia.
Related stocks
NEXG - Looking for potential bullish sentiment.N wave with N, V & NT projection.
The stock has been in a downtrend until mid-March 2025, bottoming around 0.22 MYR.
Since then, a recovery wave formed with a classic ABC corrective pattern:
(A) bottom in mid-April
(B) a peak near 0.39 MYR
(C) a higher low near 0.30 in early May
The price recently m

Nexg.. Where you goingWhat should trader choose...
1..Green Arrow
2..Red Arrow
Choice make trader we are

See all ideas
Summarizing what the indicators are suggesting.
Neutral
SellBuy
Strong sellStrong buy
Strong sellSellNeutralBuyStrong buy
Neutral
SellBuy
Strong sellStrong buy
Strong sellSellNeutralBuyStrong buy
Neutral
SellBuy
Strong sellStrong buy
Strong sellSellNeutralBuyStrong buy
An aggregate view of professional's ratings.
Neutral
SellBuy
Strong sellStrong buy
Strong sellSellNeutralBuyStrong buy
Neutral
SellBuy
Strong sellStrong buy
Strong sellSellNeutralBuyStrong buy
Neutral
SellBuy
Strong sellStrong buy
Strong sellSellNeutralBuyStrong buy
Displays a symbol's price movements over previous years to identify recurring trends.
AVEM
Avantis Emerging Markets Equity Ucits ETF AccumUSDWeight
0.02%
Market value
22.77 K
USD
AVEE
Avantis Emerging Markets Small Cap Equity ETFWeight
0.04%
Market value
22.67 K
USD
Explore more ETFs
Frequently Asked Questions
The current price of NEXG is 0.400 MYR — it has increased by 3.90% in the past 24 hours. Watch NEXG Bhd stock price performance more closely on the chart.
Depending on the exchange, the stock ticker may vary. For instance, on MYX exchange NEXG Bhd stocks are traded under the ticker NEXG.
NEXG stock has risen by 33.33% compared to the previous week, the last month showed zero change in price, over the last year NEXG Bhd has showed a −1.23% decrease.
We've gathered analysts' opinions on NEXG Bhd future price: according to them, NEXG price has a max estimate of 0.85 MYR and a min estimate of 0.46 MYR. Watch NEXG chart and read a more detailed NEXG Bhd stock forecast: see what analysts think of NEXG Bhd and suggest that you do with its stocks.
NEXG reached its all-time high on Apr 1, 2014 with the price of 1.220 MYR, and its all-time low was 0.065 MYR and was reached on Apr 19, 2013. View more price dynamics on NEXG chart.
See other stocks reaching their highest and lowest prices.
See other stocks reaching their highest and lowest prices.
NEXG stock is 9.09% volatile and has beta coefficient of 1.72. Track NEXG Bhd stock price on the chart and check out the list of the most volatile stocks — is NEXG Bhd there?
Yes, you can track NEXG Bhd financials in yearly and quarterly reports right on TradingView.
NEXG Bhd is going to release the next earnings report on Dec 2, 2025. Keep track of upcoming events with our Earnings Calendar.
NEXG net income for the last quarter is 64.88 M MYR, while the quarter before that showed 43.81 M MYR of net income which accounts for 48.10% change. Track more NEXG Bhd financial stats to get the full picture.
NEXG Bhd dividend yield was 3.06% in 2024, and payout ratio reached 18.07%. The year before the numbers were 6.82% and 91.46% correspondingly. See high-dividend stocks and find more opportunities for your portfolio.
EBITDA measures a company's operating performance, its growth signifies an improvement in the efficiency of a company. NEXG Bhd EBITDA is 156.66 M MYR, and current EBITDA margin is 42.19%. See more stats in NEXG Bhd financial statements.
Like other stocks, NEXG shares are traded on stock exchanges, e.g. Nasdaq, Nyse, Euronext, and the easiest way to buy them is through an online stock broker. To do this, you need to open an account and follow a broker's procedures, then start trading. You can trade NEXG Bhd stock right from TradingView charts — choose your broker and connect to your account.
Investing in stocks requires a comprehensive research: you should carefully study all the available data, e.g. company's financials, related news, and its technical analysis. So NEXG Bhd technincal analysis shows the buy rating today, and its 1 week rating is sell. Since market conditions are prone to changes, it's worth looking a bit further into the future — according to the 1 month rating NEXG Bhd stock shows the sell signal. See more of NEXG Bhd technicals for a more comprehensive analysis.
If you're still not sure, try looking for inspiration in our curated watchlists.
If you're still not sure, try looking for inspiration in our curated watchlists.