TASHIN ATR crosses slow MA in MTFsCan try TASHIN as its ATR has crossed the slow MA in MTFs. TP at recent swing high and CL at trialing ATR.
−0.010 MYR
−1.10 M MYR
372.84 M MYR
348.59 M
About Tashin Holdings Bhd.
Sector
Industry
CEO
Choon Teik Lim
Website
Headquarters
Prai
Founded
2017
ISIN
MYQ0211OO001
FIGI
BBG00PK9PCC5
Tashin Holdings Bhd. is an investment company, which engages in the processing and manufacture of steel products. Its products include slit coils, steel sheets, steel pipes, steel plate, flat and square bar, expanded metal, checkered plate, and c purlin. The company was founded on August 14, 2017 and is headquartered in Prai, Malaysia.
Related stocks


Extremely powerful set up done- TASHIN HOLDINGS BERHADMarket sentiment on Friday is really weak, we notice a very interesting counter that undergoing strong set up.
TASHIN is involved in steel related products which expected to benefited from current commodity bull run, evidenced by improving profit margin in recent QR.
Share price experienced re-accum


BURSA:TASHIN 29/09/2021TP = as per TP01 Line
Support = as per Support Line
Stop Loss = as per Stop Loss Line

Price uptrend, possible to go higherPrice expect to move higher if can maintain above support area EMA50 @ 0.58.
Resistance price around 0.67

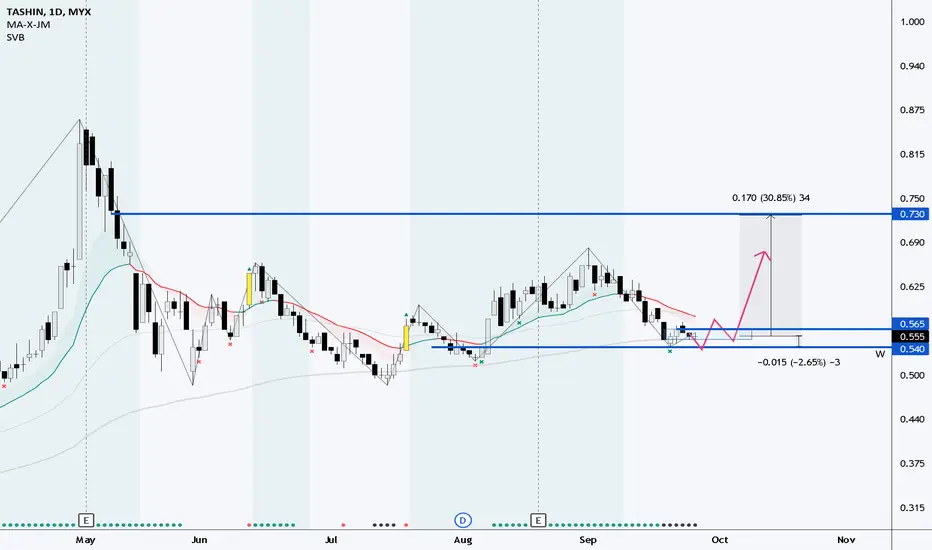
Steel counter at compression stage Buy only if close above 0.565 with stop loss below weekly support
Tashin day chartgo long- sengkou span A has crossed above senkou span B.however the angle is not steep. price traded above Kumo, and clear skies overhead. chikou has crossed above the Kumo and seeing no resistance overhead. RSI & dmi showing good momentum. RRR definitely worth it!
Tp - 0.85
SL 3- 0.55 below

UPTREND TASHINTurnaround company with consecutive increasing sales and profit.Strong sector company.


See all ideas
Summarizing what the indicators are suggesting.
Oscillators
Neutral
SellBuy
Strong sellStrong buy
Strong sellSellNeutralBuyStrong buy
Oscillators
Neutral
SellBuy
Strong sellStrong buy
Strong sellSellNeutralBuyStrong buy
Summary
Neutral
SellBuy
Strong sellStrong buy
Strong sellSellNeutralBuyStrong buy
Summary
Neutral
SellBuy
Strong sellStrong buy
Strong sellSellNeutralBuyStrong buy
Summary
Neutral
SellBuy
Strong sellStrong buy
Strong sellSellNeutralBuyStrong buy
Moving Averages
Neutral
SellBuy
Strong sellStrong buy
Strong sellSellNeutralBuyStrong buy
Moving Averages
Neutral
SellBuy
Strong sellStrong buy
Strong sellSellNeutralBuyStrong buy
Displays a symbol's price movements over previous years to identify recurring trends.
Frequently Asked Questions
The current price of TASHIN is 0.210 MYR — it has decreased by −4.55% in the past 24 hours. Watch Tashin Holdings Bhd. stock price performance more closely on the chart.
Depending on the exchange, the stock ticker may vary. For instance, on MYX exchange Tashin Holdings Bhd. stocks are traded under the ticker TASHIN.
TASHIN stock has fallen by −10.64% compared to the previous week, the month change is a −2.33% fall, over the last year Tashin Holdings Bhd. has showed a −34.38% decrease.
TASHIN reached its all-time high on Apr 30, 2021 with the price of 0.870 MYR, and its all-time low was 0.095 MYR and was reached on Mar 17, 2020. View more price dynamics on TASHIN chart.
See other stocks reaching their highest and lowest prices.
See other stocks reaching their highest and lowest prices.
TASHIN stock is 7.32% volatile and has beta coefficient of 0.31. Track Tashin Holdings Bhd. stock price on the chart and check out the list of the most volatile stocks — is Tashin Holdings Bhd. there?
Yes, you can track Tashin Holdings Bhd. financials in yearly and quarterly reports right on TradingView.
TASHIN net income for the last quarter is 88.00 K MYR, while the quarter before that showed 240.00 K MYR of net income which accounts for −63.33% change. Track more Tashin Holdings Bhd. financial stats to get the full picture.
Yes, TASHIN dividends are paid annually. The last dividend per share was 0.01 MYR. As of today, Dividend Yield (TTM)% is 7.14%. Tracking Tashin Holdings Bhd. dividends might help you take more informed decisions.
As of Nov 9, 2025, the company has 286 employees. See our rating of the largest employees — is Tashin Holdings Bhd. on this list?
EBITDA measures a company's operating performance, its growth signifies an improvement in the efficiency of a company. Tashin Holdings Bhd. EBITDA is 4.84 M MYR, and current EBITDA margin is 1.47%. See more stats in Tashin Holdings Bhd. financial statements.
Like other stocks, TASHIN shares are traded on stock exchanges, e.g. Nasdaq, Nyse, Euronext, and the easiest way to buy them is through an online stock broker. To do this, you need to open an account and follow a broker's procedures, then start trading. You can trade Tashin Holdings Bhd. stock right from TradingView charts — choose your broker and connect to your account.
Investing in stocks requires a comprehensive research: you should carefully study all the available data, e.g. company's financials, related news, and its technical analysis. So Tashin Holdings Bhd. technincal analysis shows the strong sell today, and its 1 week rating is strong sell. Since market conditions are prone to changes, it's worth looking a bit further into the future — according to the 1 month rating Tashin Holdings Bhd. stock shows the strong sell signal. See more of Tashin Holdings Bhd. technicals for a more comprehensive analysis.
If you're still not sure, try looking for inspiration in our curated watchlists.
If you're still not sure, try looking for inspiration in our curated watchlists.