VSTECS Bhd.
No trades
0.24 MYR
70.57 M MYR
2.90 B MYR
89.65 M
About VSTECS Bhd.
Sector
Industry
CEO
Jan Hsung Soong
Website
Headquarters
Petaling Jaya
Founded
1985
IPO date
Mar 19, 2010
IPO offer price
0.44 USD
Identifiers
2
ISIN:MYL5162OO002
VSTECS Bhd. is an investment holding company. It operates through the following segments: Information and Communication Technology (ICT) Distribution, Enterprise Systems, and ICT Services. The ICT Distribution segment focuses on consumer ICT products to resellers including retailers. The Enterprise Systems segment includes commercial and enterprise ICT products to resellers such as system integrators and corporate dealers. The company was founded by Sen Chin Foo and Chiang Quan Teo in 1985 and is headquartered in Petaling Jaya, Malaysia.
Related stocks
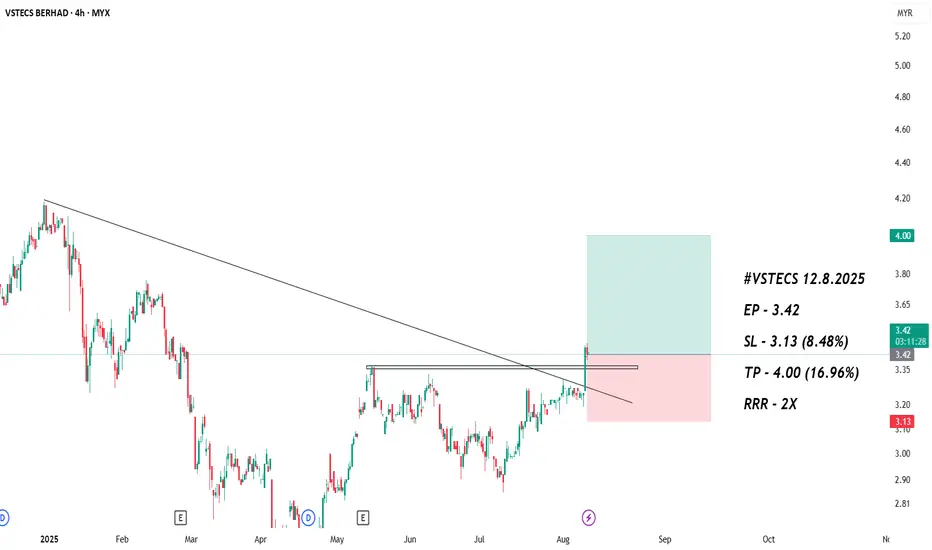
VSTECS, looking for next support?The price has closed below the moving average (MA) line, signaling potential weakness in the trend. Additionally, the MACD indicator is below zero, reinforcing a bearish sentiment. However, a key downtrend line remains in play, and a breakout above this resistance level could shift momentum.
On the


VSTECS 1h chart : first range expansion after a consolidation
limit up a few days ago
formed a Wykoff's Spring in uptrend box
today set up :
range expansion after a consolidation
break new 52 weeks high

VSTECS : Breakout Opening Range High after down days streak
limit up 5 days ago.
subsequently , pullback with 4 days down streaks.
today on reversal day ( day 5 after the momentum limit up day ) :
- gap down during market opening
- mark the opening range high ( 5min )
entry :
- on breakout from 5min Opening Range High
- initial stop loss : below the openi

VSTECS : set ups with three line break chartusing concepts from the book Beyond Candlesticks by Steve Nison
- Three Line Break Chart
- " white suite with black shoes "
- record sessions
- black turnaround lines

VSTECS TECHNCIAL ANALYSISTechnical analysis for VSTECS Stock based on Trend Analysis, Chart Pattern and VPA

CHEAT SETUP VSTECSFundamentally strong company.quarterly QOQ shows decreasing sales and profit,But still increasing YOY.Currently forming cheat setup.Wait for upward breakout of base (rectangle) with high volume to confirm setup.

Close monitor the movement. Shall need more confirmation Close monitor and analysis the confirmation.
It is a good picks and overall this stock have momentum Health Uptrend and Retrace.
Grab at better price with Risk appetize.

<TradeVSA> Re-accumulation with VCP. Ready for Breakout?Sign of Strength in the chart:
1. Re-accumulation with VCP setup
2. NS signal near support
3. Weekly chart holding at support
Case Study:
1. VSTECS
2. DNEX
3. PIE
Disclaimer
This information only serves as reference information and does not constitute a buy or sell call. Conduct your own researc

See all ideas
Summarizing what the indicators are suggesting.
Neutral
SellBuy
Strong sellStrong buy
Strong sellSellNeutralBuyStrong buy
Neutral
SellBuy
Strong sellStrong buy
Strong sellSellNeutralBuyStrong buy
Neutral
SellBuy
Strong sellStrong buy
Strong sellSellNeutralBuyStrong buy
An aggregate view of professional's ratings.
Neutral
SellBuy
Strong sellStrong buy
Strong sellSellNeutralBuyStrong buy
Neutral
SellBuy
Strong sellStrong buy
Strong sellSellNeutralBuyStrong buy
Neutral
SellBuy
Strong sellStrong buy
Strong sellSellNeutralBuyStrong buy
Displays a symbol's price movements over previous years to identify recurring trends.
Frequently Asked Questions
The current price of VSTECS is 3.94 MYR — it has decreased by −3.21% in the past 24 hours. Watch VSTECS Bhd. stock price performance more closely on the chart.
Depending on the exchange, the stock ticker may vary. For instance, on MYX exchange VSTECS Bhd. stocks are traded under the ticker VSTECS.
VSTECS stock has fallen by −6.00% compared to the previous week, the month change is a −8.41% fall, over the last year VSTECS Bhd. has showed a 8.54% increase.
We've gathered analysts' opinions on VSTECS Bhd. future price: according to them, VSTECS price has a max estimate of 5.10 MYR and a min estimate of 5.10 MYR. Watch VSTECS chart and read a more detailed VSTECS Bhd. stock forecast: see what analysts think of VSTECS Bhd. and suggest that you do with its stocks.
VSTECS reached its all-time high on Nov 13, 2025 with the price of 4.53 MYR, and its all-time low was 0.35 MYR and was reached on Mar 19, 2020. View more price dynamics on VSTECS chart.
See other stocks reaching their highest and lowest prices.
See other stocks reaching their highest and lowest prices.
VSTECS stock is 4.10% volatile and has beta coefficient of 2.19. Track VSTECS Bhd. stock price on the chart and check out the list of the most volatile stocks — is VSTECS Bhd. there?
Today VSTECS Bhd. has the market capitalization of 1.44 B, it has increased by 0.49% over the last week.
Yes, you can track VSTECS Bhd. financials in yearly and quarterly reports right on TradingView.
VSTECS net income for the last quarter is 25.78 M MYR, while the quarter before that showed 20.17 M MYR of net income which accounts for 27.82% change. Track more VSTECS Bhd. financial stats to get the full picture.
VSTECS Bhd. dividend yield was 1.71% in 2024, and payout ratio reached 34.87%. The year before the numbers were 5.00% and 34.90% correspondingly. See high-dividend stocks and find more opportunities for your portfolio.
EBITDA measures a company's operating performance, its growth signifies an improvement in the efficiency of a company. VSTECS Bhd. EBITDA is 108.01 M MYR, and current EBITDA margin is 2.86%. See more stats in VSTECS Bhd. financial statements.
Like other stocks, VSTECS shares are traded on stock exchanges, e.g. Nasdaq, Nyse, Euronext, and the easiest way to buy them is through an online stock broker. To do this, you need to open an account and follow a broker's procedures, then start trading. You can trade VSTECS Bhd. stock right from TradingView charts — choose your broker and connect to your account.
Investing in stocks requires a comprehensive research: you should carefully study all the available data, e.g. company's financials, related news, and its technical analysis. So VSTECS Bhd. technincal analysis shows the sell today, and its 1 week rating is buy. Since market conditions are prone to changes, it's worth looking a bit further into the future — according to the 1 month rating VSTECS Bhd. stock shows the strong buy signal. See more of VSTECS Bhd. technicals for a more comprehensive analysis.
If you're still not sure, try looking for inspiration in our curated watchlists.
If you're still not sure, try looking for inspiration in our curated watchlists.