ASST getting closer to breakout with target 3 $NASDAQ:ASST is ready for the breakout and if we close above 1.10 lvl today, we might get a breakout this or next week. The next lvls are 1.8 and further 3$. Lets go...
Strive, Inc.
No trades
What traders are saying

Navigating a Pivotal Merger Amidst Deep Investor SkepticismStrive Asset Management LLC (NASDAQ: ASST): Navigating a Pivotal Merger Amidst Deep Investor Skepticism and Technical Weakness
Strive Asset Management LLC (NASDAQ: ASST) found itself among Tuesday's most significant decliners, extending a prolonged period of pronounced weakness that has become emblematic of the stock's recent history. The shares dropped 5.35% to close at $0.7320, marking a third consecutive day of losses. This persistent selling pressure reflects a market grappling with a vacuum of fresh, positive catalysts to spur buying interest, overshadowing the company's recent strategic announcements. Notably, Tuesday's close also represented a critical compliance milestone—or rather, a continued failure to meet it. It was the 13th consecutive trading day ASST has closed below the Nasdaq's critical $1.00 minimum bid price requirement, a technical breach that places the company on a precarious path toward potential forced delisting if not remedied within the mandated grace period.
Amidst this bleak price action, management has signaled a commitment to shareholder returns, at least for a specific class of investors. The company announced an increase in its annual dividend rate for preferred stockholders, raising it from 12% to 12.25%. This enhanced dividend, to be paid in monthly installments starting in January 2026, will see its first payout of $1.0208 per share distributed on January 15, 2026, to shareholders of record as of January 1, 2026. Strive framed this move as a reflection of its "continued commitment to enhancing shareholder value while maintaining disciplined management of its capital structure." However, this gesture toward preferred shareholders stands in stark contrast to the severe erosion of value experienced by common stockholders.
The dominant narrative surrounding ASST, and the primary source of both its speculative appeal and deep-seated investor anxiety, is its pending all-stock merger with Semler Scientific Inc. (SMLR). If approved by shareholders in a vote concluding on January 13, 2026, this transaction would be transformative. The merger aims to combine operations to create a new entity holding a combined treasury of approximately 13,000 Bitcoin (BTC), instantly catapulting it into the ranks of the top 11 publicly traded companies globally by Bitcoin holdings.
The strategic intent behind this consolidation is profound. It represents more than an asset merger; it is a fundamental pivot toward establishing a Bitcoin-centric corporate and financial model. The combined company would emulate and expand upon the strategy pioneered by firms like MicroStrategy, offering institutional investors—who may face regulatory or operational barriers to direct cryptocurrency ownership—a novel pathway to gain Bitcoin exposure through traditional equity markets. Furthermore, the merger is structured to unlock value beyond passive Bitcoin holding. By leveraging Strive's existing digital credit platform, the new entity plans to actively deploy its substantial Bitcoin treasury within the burgeoning digital credit market, aiming to generate accretive financing opportunities and new revenue streams that enhance long-term shareholder value.
The terms of the deal specify an exchange ratio of 21.05x, meaning shareholders of Semler Scientific (SMLR) would receive 21.05 shares of ASST for every single SMLR share they own. The leadership of both companies has been vocal in their advocacy. Strive CEO Matt Cole has publicly urged shareholders to vote in favor, citing a supportive recommendation from Institutional Shareholder Services (ISS), a leading independent proxy advisory firm. Eric Semler, Chairman of Semler Scientific, has emphasized the strategic scale achieved by a ~13,000 BTC treasury, stating it "enhances Strive’s ability to pursue accretive financing opportunities... and maximize long-term shareholder value." He has confirmed his intention to join Strive's board post-merger to help steer this vision.
However, this ambitious strategic vision is clouded by stark market reality and mixed investor sentiment. A critical point of contention is the exchange ratio itself. Given the precipitous decline in ASST's share price—which has plummeted approximately 96% from its 2023 highs near $18 to current sub-dollar levels—some SMLR shareholders question whether the 21.05x ratio adequately compensates them for the value of their company, especially in light of SMLR's own recent 50% price decline. The dramatic fall in ASST raises fundamental questions about the implied valuation of the merger and the market's confidence in the combined entity's near-term prospects.
Technical Outlook and Strategic Levels
From a chart perspective, ASST is entrenched in a severe downtrend with critical levels defining its risk and potential reward profile.
Immediate Support: The nearest significant technical support is identified at $0.8000. A sustained hold above this level would be the first minor sign of stabilization, though the overwhelming downtrend makes any rally from here a significant challenge.
Resistance & Profit-Taking Targets: Should a profound bullish reversal materialize, potentially catalyzed by a successful merger vote and a subsequent shift in market perception, two primary upside targets emerge. The first and more conservative take-profit zone is set at $3.00, which would represent a monumental recovery. A more ambitious target, signaling a full-scale market reassessment of the company's Bitcoin-centric business model, is established at $5.00.
Bottom Line
Strive Asset Management (ASST) stands at a critical crossroads. The pending merger with Semler Scientific offers a visionary, high-stakes pathway to becoming a major player in the corporate Bitcoin treasury arena, with a plan to actively monetize its holdings. Yet, this promise is severely tempered by immediate existential threats—including potential Nasdaq delisting due to the sub-$1 share price—and profound investor skepticism reflected in the stock's catastrophic decline. The upcoming shareholder vote on January 13, 2026, is not merely a corporate formality but a decisive referendum on this bold strategy. For speculative investors, the extreme technical weakness presents high risk, while the ambitious merger thesis and defined technical targets offer asymmetric reward potential. The outcome will likely hinge on whether the market begins to value the strategic Bitcoin treasury potential over the current narrative of compliance risk and capital erosion.

Strive, Inc. Class A Common Stock (ASST)STOCK chart shows correction is completed.
Wolfe wave formation pattern.
Target price between 16$ - 17$ .
Highly recommended for Buying now.

ASST--Building the Short Squeeze case for the First LegRecently a case for NASDAQ:ASST short squeeze has been building. The Shorts and market Makers shed a single drop of sweat on Friday... Just a drop of blood in the water and the sharks can smell you for miles.
here are some Key points:
Friday the short shares available touched 0.
In the Last quarter institutional buyers started BUYING
The Most Recent FTD shows 4.6 million shares failed to deliver. (Not huge...But at prices between 1.05 and .92 cents!)
Most Recent short data shows short interest near 30% (off exchange est. Short vol ratio 59.64%)
Jan 13, 2026 save the date, Merger, combined 13,000 BTC
BTC showing signs of turn around/ stability.
We won't even talk about the dollar devaluation, and what gold and silver say about the dollar.
We might not have all the main dish ready to eat for the ultimate moon shot but we have all the ingredients in the pan and the stove heating up.
Oh and food for thought JPMorgan tossed out a BTC target of $170,000 ish based on model comparing it's value to gold. NASDAQ:ASST Citi, not too far off at $143,000. And yes, those are for 2026.
bears get rich, bulls get rich. but pigs go to slaughter
bears getting piggy.

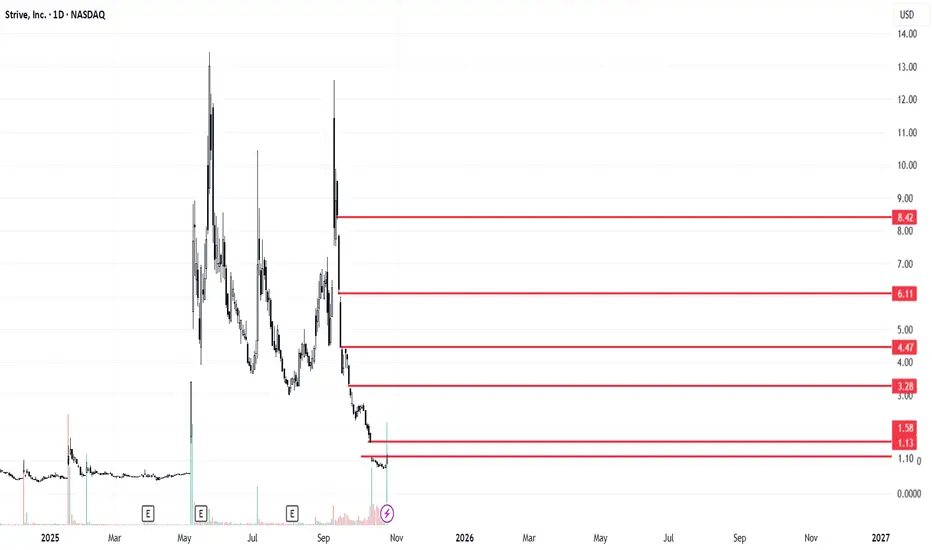
$ASST Potential Cup and HandleNASDAQ:ASST (1D)
Price holding the base and forming a potential rounded bottom.
Key levels:
• Support: $0.77–0.80
• Reclaim $1.06–1.20 = momentum shift
• Above $1.72 opens the door for trend reversal
Nothing to chase yet — watching for a clean breakout + hold.
#ASST #StocksToWatch #TradingView #PriceAction #TechnicalAnalysis #SupportAndResistance #SmallCaps #CockpitTrader

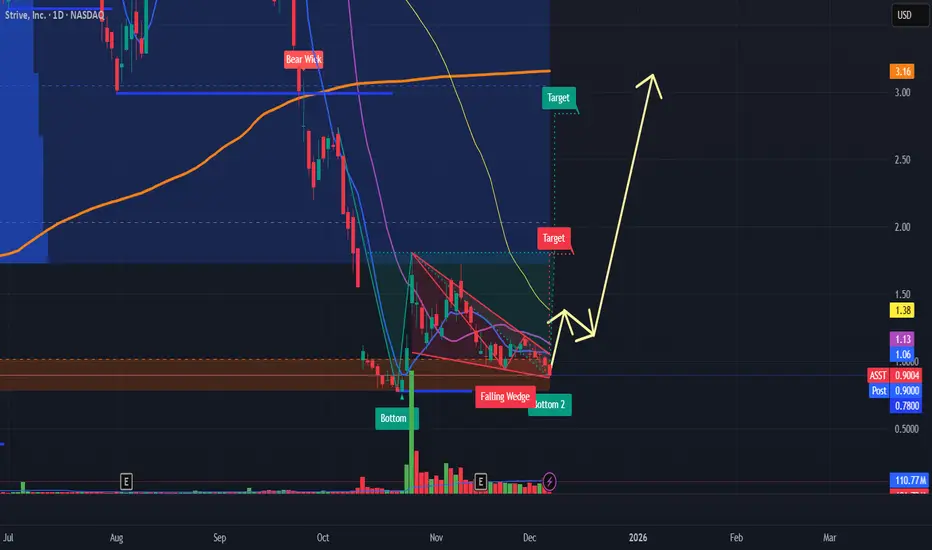
$ASST bullish Price bouncing off the Daily fvg and the bottom trendline of the descending wedge. Price is also sitting on the volume shelf, and the wedge is getting narrower. Decent volume recently, hitting 100 mil on average. It's getting closer to the breakout. Rate cut could be that catalyst 🤞🏼

ASST (Strive) - A novel idea with explosive growth potential******DYOR - if Bitcoin price collapses, so will this stock play!******
1. The Bitcoin "War Chest" (The Numbers)
Strive has already accumulated a significant Bitcoin treasury. As of their most recent disclosures (November 2025), the numbers are substantial:
Total Holdings: Approximately 7,525 BTC. (Merger with Semler Scientific will add another 5,000
BTC when finalized).
Valuation: At current market prices (~$90.5k/BTC), this treasury is worth over $681 million.
The Strategy: They explicitly state their goal is to maximize "Bitcoin per share"—the exact metric MicroStrategy (MSTR) uses to judge its success. They view Bitcoin not just as an asset, but as the "hurdle rate" for all their capital allocation decisions.
2. The "Tax-Free" Twist (The Section 351 Exchange)
This is the unique financial engineering that likely attracted Jane Street. Strive is attempting something MicroStrategy has not done: a tax-free Bitcoin-for-Equity swap.
How it works: Under Section 351 of the U.S. tax code, investors sitting on massive unrealized gains in Bitcoin can "swap" their BTC for shares of Strive (ASST) without triggering an immediate capital gains tax event.
Why it matters: There are billions of dollars in "stranded" Bitcoin held by early adopters who don't want to sell because of the tax hit. Strive offers them a way to diversify into a public equity structure without the tax penalty.
The Arbitrage: For a firm like Jane Street, this unique structure creates complex arbitrage opportunities between the stock price, the Bitcoin price, and the tax value of these swaps.
3. Vivek Ramaswamy’s Role
Vivek Ramaswamy is the co-founder and largest individual figurehead, but his official role has shifted due to his political ambitions.
Official Status: He is not currently the Chairman or CEO (that role belongs to Matt Cole, a former portfolio manager at CalPERS). Vivek resigned his chairmanship in 2023 to run for U.S. President.
"Insider" Confidence: Despite not being on the board, he remains deeply financially committed. He recently disclosed a personal purchase of $1.25 million in preferred stock, signaling to the market that he is betting his own money on this pivot.
****Side Note: Prominent investor Mike Alfred has also increased his shares of ASST to 1.9 million, adding another 50k at $1.06 on 11/26/2025. Follow him at x.com/mikealfred - he posts all his buys and sells ******
Political Context: Vivek is widely expected to run for Governor of Ohio in 2026. His involvement in a "Bitcoin Treasury" company aligns with the broader "pro-crypto" political stance emerging in the U.S., making ASST partly a bet on his political rise and the regulatory tailwinds that might follow.
4. The "Baby MicroStrategy" Playbook
Strive is replicating the MicroStrategy leverage model but with a faster start:
The PIPE Deal: They recently secured $750 million in private financing (PIPE) to buy more Bitcoin.
Warrants: The deal includes warrants that could bring in another $750 million if exercised. This is likely where Jane Street's interest lies—warrants offer massive upside leverage if the stock price spikes.
Aggressive Issuance: They plan to issue debt and equity aggressively to buy more Bitcoin, creating a feedback loop: Buy Bitcoin -> Stock goes up -> Issue stock at premium -> Buy more Bitcoin -> Repeat.
Summary of the Trade
Jane Street likely sees ASST as a high-velocity volatility engine. With Vivek’s political profile, a massive Bitcoin treasury, and a unique tax loophole for crypto whales, the stock is designed to move violently. Jane Street’s 9.9% stake ensures they capture the upside of that movement while staying liquid enough to exit if the premium collapses.
This is a very speculative play. Proceed with caution.
ASST will reverse to upside from hereNASDAQ:ASST has a clear DOUBLE BOTTOM on technicals and will likely reverse hard from here. The level to watch is 1.10 and 1.14 for next breakout.
As CRYPTOCAP:BTC starts slowly its upward momentum, after the FED meet next week, we will have a clear breakout on this stock and the market overall including BTC and NASDAQ:MSTR
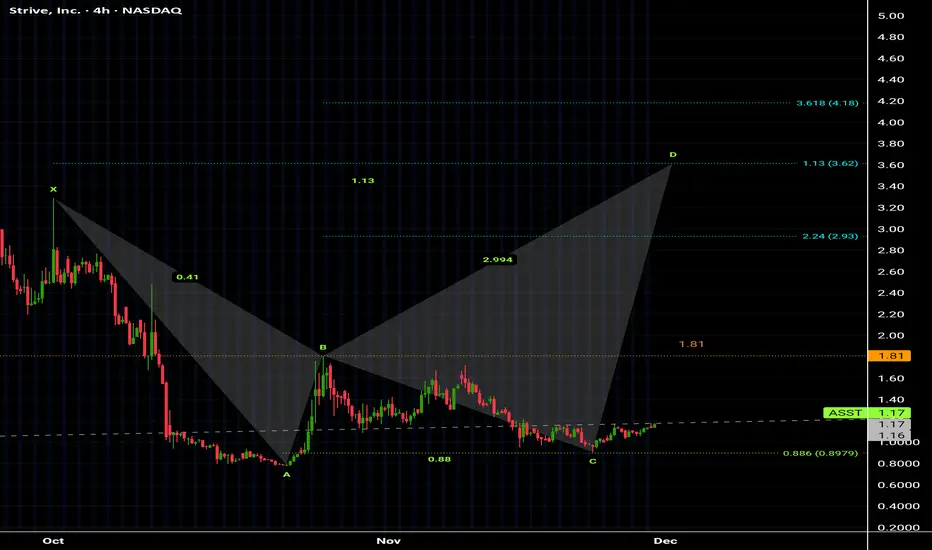
Strive, Inc. Class A Common Stock (ASST)Stock on Harmonic pattern formation.
Target prices between 3.62$ - 4.18$
Highly recommended for Buying ASAP now 👌
fishing for the 3rd $ASST elliot waveAll recent up gaps have been filled. I like this setup when fishing for the bottom of an elliot correction wave, especially the 2nd wave. I am using the initial unusual volume candle around $0.90 as the bottom of a possible 3rd wave. But given the bounce after closing the final up gap, the 3rd wave could be in motion now. Not financial advice. Trade to be de-risked below $1.09. Trade invalidated and vacated below $0.90.

Strive on a bull run! $ASSTAmid broader market uncertainty, Strive Inc.'s shares have fallen 2.76%. Meanwhile, ASST is attracting investor interest and institutional capital due to its advanced technology integrations, which are seen as a key competitive advantage. Analysts note that Strive's future momentum may depend on strategic partnerships and operational efficiencies to restore confidence.
News of ASST's surge is linked to its strategy of entering new markets and innovating products. However, the rally is met with skepticism from analysts who question its valuation, specifically its elevated price-to-sales ratio. This uncertainty causes fluctuating investor sentiment but also opens the door for potential strategic entry points for buyers.
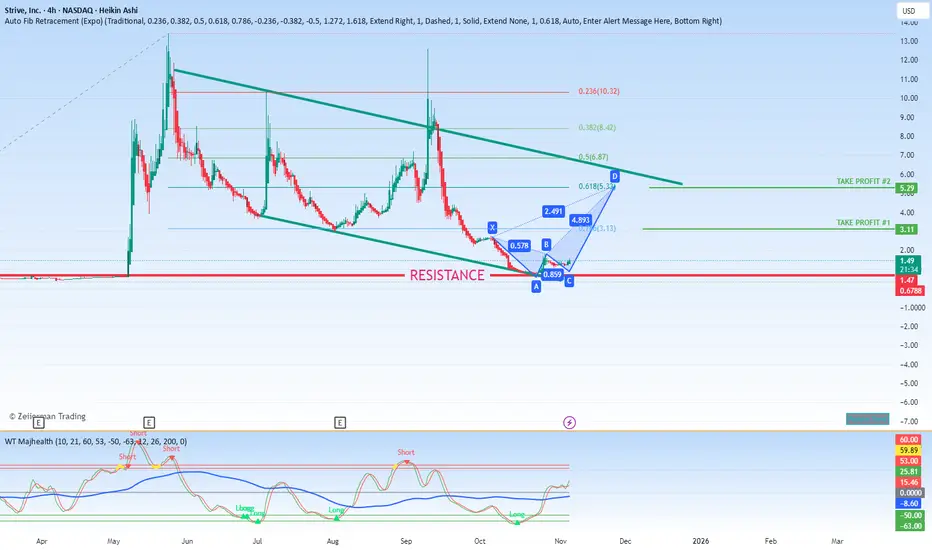
Price Target -
#1 - 3
#2 - 5
Gartley pattern shows the market is bullish
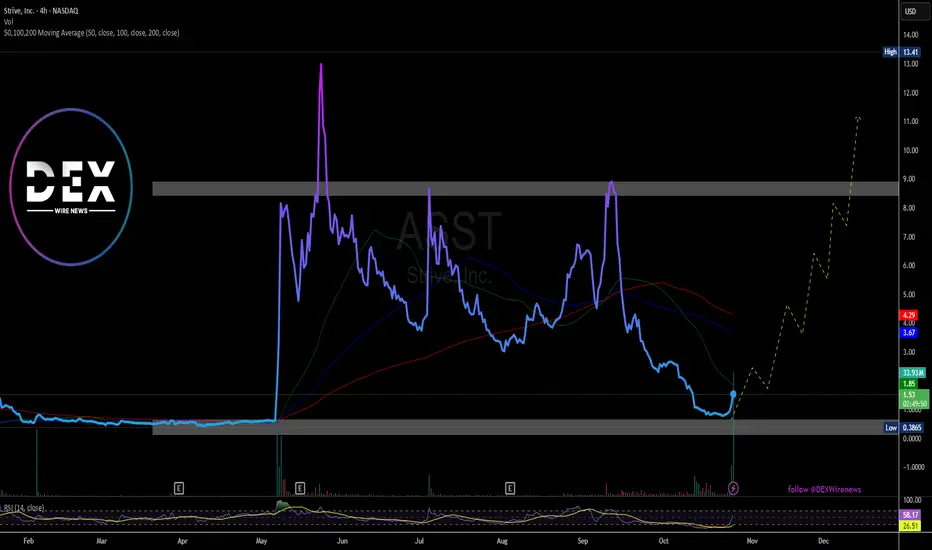
Just In: Strive Asset Management, LLC ($ASST) Spike 40% TodayThe price of Strive Asset Management, LLC (NASDAQ: NASDAQ:ASST ) Spike 40% on Monday's market open bouncing from the $0.38 support point albeit present market conditions the asset is gearing for a move to the $8 resistant point.
With the RSI at 57, NASDAQ:ASST stock seems more than ready to achieve that fit.
The stock is already trading below key moving averages giving it ample time to capitalize on that level.
In recent news, Strive, Inc. (Nasdaq: NASDAQ:ASST ) announced the appointment of Ben Werkman as Chief Investment Officer (“CIO”) reporting to Strive Chairman and Chief Executive Officer (“CEO”) Matt Cole.
Mr. Werkman founded NumerisX, a boutique Bitcoin treasury advisory firm, where he guided corporations in developing and implementing Bitcoin treasury strategies.
About ASST
Strive Asset Management, LLC is a privately owned investment manager. It primarily provides its services to investment companies. The firm is a large advisory firm, an investment adviser to an investment company which provides portfolio management for investment companies
CASE FOR ASST -Asst Holds10,900 BTC
-If strictly comparing to price and also holdings vs MSTR, valuation is at 4.89
-Heavily hyped in many forums
-needs to break 2.50 first
-if volume comes in could go high
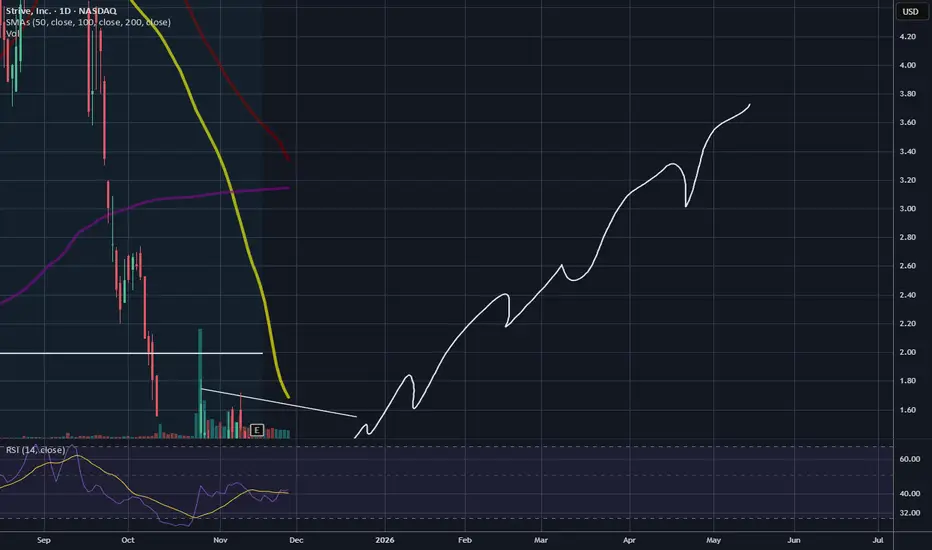
10X gainer penny stockNASDAQ:ASST Strive (ASST) is now sitting at a technical launching pad that could deliver explosive gains—potentially 10x returns, just like Beyond Meat (BYND) did in its early rally. The chart shows a massive long-term rectangle base pattern with recent volume surges and sharp price recoveries from support, classic ingredients seen before parabolic moves.
Much like BYND before its breakout, Strive has built up significant accumulation at the bottom end, shaking out weak hands with repeated bear wicks and false breakdowns. The current setup is clear: a breakout above resistance could ignite massive buying momentum, as shown by the large arrow on the chart. With a tight base, growing volume, and a history of rapid rallies, Strive has the right technical ingredients for a dramatic run. Early accumulation here could turn into life-changing gains if momentum continues—watch this one closely!

ASST - Asset Entities - $15.65ASSET had a decent breakout to $19.79 this morning in Today's Pre-Market Session after announcing a merger with Strive to create a Bitcoin Treasury Play. With the Stock's Short Interest in visibility by the market, it's currently up 70% after the Market Open.
We're targeting a $9.77 entry along that lower level support trend that we're tracking to retest the $15.65 again.

ASST: Trade write-up / 07 MayDaily Time-Frame Context
1h Chart
ASST gapped up over 300% pre-market on news of transitioning to a crypto holding company (a strong hype theme).
Despite being in a long-term downtrend, ASST had a history of prior gap-ups in 2023–2025.
Highest daily trading volume (HDW) ever recorded, with 80M shares traded pre-market.
Low short interest (0.5 days) and a relatively small float of 10.9M.
5-Min Time-Frame Analysis
Pre-Market Action:
Gap-up to Jan’25 highs, followed by shallow consolidation to the rising 8 EMA and VWAP (1h 8 EMA)
Opening Price Action:
Price posted a failed breakdown setup, finding support at VWAP, Jan’25 highs, and the pre-market base.
Selling volume remained low, while reversal volume showed substantial buying interest, with most bars closing at the highs.
MACD signaled bearish posture during this reversal, hinting at potential upcoming consolidation.
Mid-Day Movement
Price reached a mid-day top with increased selling volume, reduced buying, bearish MACD, and flattening short-term EMAs.
Pullback Phase
Price pulled back for 4 hours to early morning support (Jan’25 highs, pre-market top, morning reversal), with gradually decreasing volume, indicating drying-up selling interest.
Pullback had a textbook three-wave structure with ideal Fibonacci proportions.
Consolidation and Breakout
Established a solid consolidation at the key support zone, featuring:
Several shake-outs
Buying volume dominating selling
Sequance of higher lows formation
Inside bars prior to breakout
MACD turning bullish
Possible Entries
Aggressive Entry:
Failed breakdown and V-shaped reversal with an 11% stop at LOD.
Ideal Entry/Aggressive add-on:
After the shake-out/inside bars sequence on low volume, breakout confirmed by bullish convergence of EMAs and VWAP. Full stop could be placed bellow higher low.
Active Uptrend Phase
Price respected the 8 EMA during the active advance phase, pausing only during halts.
(!) Gradually increasing buying volume without a sudden spike - a sign of steady buying rather than stop-loss coverage.
Noticeably lower selling volume compared to buying volume.
Price approached the next significant daily resistance zone at Jan’24 highs - a potential profit-trimming target.
Swing-Trading Thesis
Strong crypto-related hype (becoming a crypto holding company).
Crypto sector showing relative strength since the market top and recovery phase.
Price maintained above key short-term moving averages into the close and post-market, supporting the bullish case.
Bitcoin pullback and altcoin breakout setups further enhance the thesis.

ASST 11.5RThis isn’t the best setup as I prefer entering at the low of the main range, however there is a range which has formed with fully mitigated supply areas which means it has a good chance of continuing the rally rather than filling the imbalance.
What I do like about it is the larger pattern (not visible as this is zoomed in - but if you move around you’ll see it). So this implies strong moves to the upside are realistic.

Think Like a Pro: How to Be Your Own Trading PsychologistEver Felt Like Your Worst Enemy in Trading? Here’s How to Overcome it!
Have you ever been in that moment where you're staring at the screen, and every fiber of your being is screaming, "This trade is going south," but you still hold on?
It’s like watching a train wreck in slow motion—except you’re the conductor, and somehow, you’re glued to your seat.What if you could turn that inner chaos into clarity?
Imagine becoming your own trading psychologist, mastering the mental game to transform your trading experience. It’s possible, and it’s within your reach.
The Mirror Doesn’t LieThe biggest challenges in your trading aren’t just the volatile markets or the unpredictable news— they’re the emotions that cloud your judgment. Fear, greed, hesitation, overconfidence— these emotions can lead you to make mistakes that are both costly and frustrating.
But here’s the key: the problem isn’t the emotions themselves, but how you manage them. Recognizing this can help you see the market—and your trades—in a completely new light.
The Secret Sauce: Self-AwarenessThe first step toward mastering your trading psychology is learning to recognize your triggers.
What sets you off? Is it a losing streak? A sudden market spike? Maybe just a stressful day.
Identifying these triggers is crucial to controlling your trading behavior.Once you recognize your triggers, managing them becomes much easier.
It’s like seeing a storm on the horizon—you can’t stop it, but you can definitely prepare for it.
Setting hard rules for when to step away from the screen, and more importantly, when to stay focused, can make all the difference in your trading results.
Actionable Tips: Turn Insight into Action
So, how can you apply this in a practical way?
Here are a few strategies that can help you take control of your trading psychology:
Journal Everything : Start by journaling not just your trades, but your thoughts and emotions before, during, and after each trade.
You’ll begin to see patterns emerge, showing when you might be about to go off the rails.
Mindful Breaks: Set timers to remind yourself to step away from the screen for a minute or two. This gives you the space you need to reset, especially when things get intense.
The “Pause” Button: Before entering a trade, take a moment to pause and ask yourself, “Am I acting out of emotion, or is this a rational decision?”
This simple act can prevent countless bad trades.
Create a Pre-Trade Routine: Just like athletes have pre-game rituals, creating a routine to get into the right headspace before trading can be incredibly beneficial.
This might involve reviewing your journal, setting goals for the session, or doing a quick mental check-in.
Don’t Go It Alone: Trading doesn’t have to be a solo journey. Platforms like TradingView are excellent for connecting with other traders.
Whether you’re joining a chat, reading other traders’ ideas, or commenting on their posts, engaging with the community can provide valuable insights and feedback.
Sometimes, the best advice comes from others who’ve been in your shoes and can help you see things from a different perspective.
The Result? A Psychological EdgeBy mastering your trading psychology, you can stop sabotaging yourself.
Instead of reacting impulsively to the market, you can respond with clarity and purpose.
The challenges of trading will still be there—this is the market, after all—but with the right mindset, you can turn them into opportunities.
If trading psychology has been a struggle for you, know that you’re not alone, and there’s a way forward.
By looking inward, recognizing your patterns, and applying a few simple strategies, you can gain the psychological edge you need to succeed.
Trading isn’t just about reading the market; it’s about understanding yourself. And once you master that, the possibilities for your trading are endless.
Let me know what you think below:)

ASSET ENTITIES Stock Chart Fibonacci Analysis 022224Trading Idea
1) Find a FIBO slingshot
2) Check FIBO 61.80% level
3) Entry Point > 0.56/61.80%
Chart time frame : C
A) 15 min(1W-3M)
B) 1 hr(3M-6M)
C) 4 hr(6M-1year)
D) 1 day(1-3years)
Stock progress : B
A) Keep rising over 61.80% resistance
B) 61.80% resistance
C) Hit the bottom
D) Hit the top
Stocks rise as they rise from support and fall from resistance. Our goal is to find a low support point and enter. It can be referred to as buying at the pullback point. The pullback point can be found with a Fibonacci extension of 61.80%. This is a step to find entry level. 1) Find a triangle (Fibonacci Speed Fan Line) that connects the high (resistance) and low (support) points of the stock in progress, where it is continuously expressed as a Slingshot, 2) and create a Fibonacci extension level for the first rising wave from the start point of slingshot pattern.
When the current price goes over 61.80% level , that can be a good entry point, especially if the SMA 100 and 200 curves are gathered together at 61.80%, it is a very good entry point.
As a great help, tradingview provide these Fibonacci speed fan lines and extension levels with ease. So if you use the Fibonacci fan line, the extension level, and the SMA 100/200 curve well, you can find an entry point for the stock market. At least you have to enter at this low point to avoid trading failure, and if you are skilled at entering this low point, with fibonacci6180 technique, your reading skill to chart will be greatly improved.
If you want to do day trading, please set the time frame to 5 minutes or 15 minutes, and you will see many of the low point of rising stocks.
If want to prefer long term range trading, you can set the time frame to 1 hr or 1 day.
