One One S&P 500 and Bitcoin ETF | Chart & Forecast SummaryKey Indicators On Trade Set Up In General
1. Push Set Up
2. Range Set Up
3. Break & Retest Set Up
Notes On Session
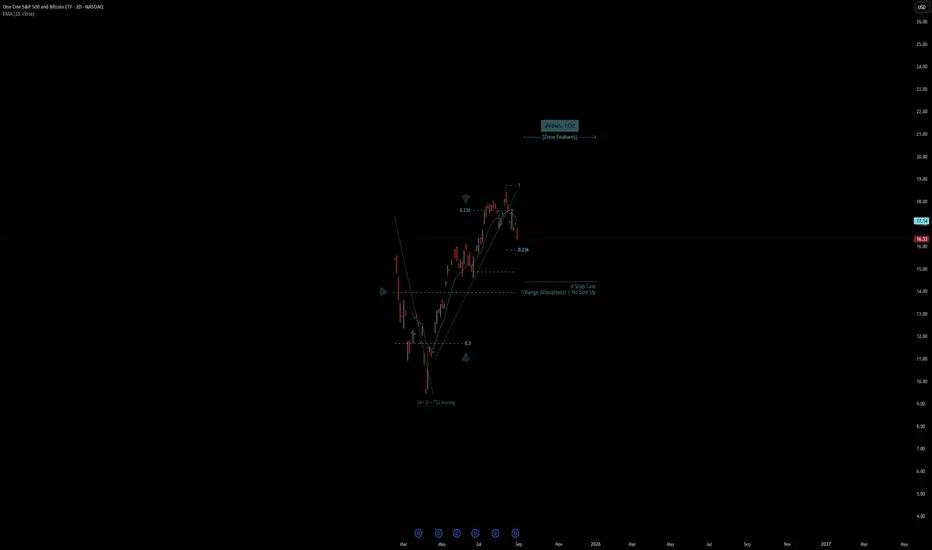
# One One S&P 500 and Bitcoin ETF
- Double Formation
* (A+)) - *Crossing - *10EMA - Long Entry | Subdivision 1
* (Range Allocation)) | No Size Up - *1.5RR | Completed Survey
* 39 bars,
Key stats
About One One S&P 500 and Bitcoin ETF
Home page
Inception date
Feb 19, 2025
Structure
Open-Ended Fund
Replication method
Synthetic
Dividend treatment
Distributes
Distribution tax treatment
Ordinary income
Income tax type
Capital Gains
Max ST capital gains rate
39.60%
Max LT capital gains rate
20.00%
Primary advisor
Volatility Shares LLC
Distributor
Foreside Fund Services LLC
Identifiers
3
ISIN US92864M8635
OOSB provides exposure to the S&P 500 and Bitcoin. The fund aims for long-term capital appreciation by using leverage through US-listed futures, pooled investment vehicles, and collateral. The fund targets 100% notional exposure for the returns of each component or an aggregate of 200%. The strategy seeks to magnify exposure so that every $1 investment is $1 exposure each to the S&P 500 and Bitcoin. The fund does not invest directly in Bitcoin but uses Bitcoin price reflected in the next or second-to-next expiring futures contract. In the case of other Bitcoin-linked investments, value is calculated by the average. Through a wholly owned Cayman Islands subsidiary, the fund invests in futures, ETPs with similar exposure, equities, and cash and cash equivalents. The actively managed ETF has full discretion to adjust the portfolio at any given time, while maintaining its tax status. Therefore, tracking deviation may be greater than the performance of the S&P 500 or Bitcoin.
Related funds
Classification
What's in the fund
Exposure type
Cash
Mutual fund
Bonds, Cash & Other100.00%
Cash73.03%
Mutual fund26.97%
Top 10 holdings
Summarizing what the indicators are suggesting.
Oscillators
Neutral
SellBuy
Strong sellStrong buy
Strong sellSellNeutralBuyStrong buy
Oscillators
Neutral
SellBuy
Strong sellStrong buy
Strong sellSellNeutralBuyStrong buy
Summary
Neutral
SellBuy
Strong sellStrong buy
Strong sellSellNeutralBuyStrong buy
Summary
Neutral
SellBuy
Strong sellStrong buy
Strong sellSellNeutralBuyStrong buy
Summary
Neutral
SellBuy
Strong sellStrong buy
Strong sellSellNeutralBuyStrong buy
Moving Averages
Neutral
SellBuy
Strong sellStrong buy
Strong sellSellNeutralBuyStrong buy
Moving Averages
Neutral
SellBuy
Strong sellStrong buy
Strong sellSellNeutralBuyStrong buy
Displays a symbol's price movements over previous years to identify recurring trends.
Frequently Asked Questions
An exchange-traded fund (ETF) is a collection of assets (stocks, bonds, commodities, etc.) that track an underlying index and can be bought on an exchange like individual stocks.
OOSB trades at 10.14 USD today, its price has risen 1.38% in the past 24 hours. Track more dynamics on OOSB price chart.
OOSB net asset value is 10.54 today — it's fallen 21.38% over the past month. NAV represents the total value of the fund's assets less liabilities and serves as a gauge of the fund's performance.
OOSB assets under management is 934.96 K USD. AUM is an important metric as it reflects the fund's size and can serve as a gauge of how successful the fund is in attracting investors, which, in its turn, can influence decision-making.
OOSB price has fallen by −21.91% over the last month, and its yearly performance shows a −34.45% decrease. See more dynamics on OOSB price chart.
NAV returns, another gauge of an ETF dynamics, have fallen by −21.38% over the last month, showed a −29.78% decrease in three-month performance and has decreased by −17.75% in a year.
NAV returns, another gauge of an ETF dynamics, have fallen by −21.38% over the last month, showed a −29.78% decrease in three-month performance and has decreased by −17.75% in a year.
OOSB fund flows account for 1.26 M USD (1 year). Many traders use this metric to get insight into investors' sentiment and evaluate whether it's time to buy or sell the fund.
Since ETFs work like an individual stock, they can be bought and sold on exchanges (e.g. NASDAQ, NYSE, EURONEXT). As it happens with stocks, you need to select a brokerage to access trading. Explore our list of available brokers to find the one to help execute your strategies. Don't forget to do your research before getting to trading. Explore ETFs metrics in our ETF screener to find a reliable opportunity.
OOSB invests in cash. See more details in our Analysis section.
OOSB expense ratio is 0.85%. It's an important metric for helping traders understand the fund's operating costs relative to assets and how expensive it would be to hold the fund.
Yes, OOSB is a leveraged ETF, meaning it uses borrowings or financial derivatives to magnify the performance of the underlying assets or index it follows.
In some ways, ETFs are safe investments, but in a broader sense, they're not safer than any other asset, so it's crucial to analyze a fund before investing. But if your research gives a vague answer, you can always refer to technical analysis.
Today, OOSB technical analysis shows the sell rating and its 1-week rating is strong sell. Since market conditions are prone to changes, it's worth looking a bit further into the future — according to the 1-month rating OOSB shows the strong sell signal. See more of OOSB technicals for a more comprehensive analysis.
Today, OOSB technical analysis shows the sell rating and its 1-week rating is strong sell. Since market conditions are prone to changes, it's worth looking a bit further into the future — according to the 1-month rating OOSB shows the strong sell signal. See more of OOSB technicals for a more comprehensive analysis.
Yes, OOSB pays dividends to its holders with the dividend yield of 2.94%.
OOSB trades at a premium (0.02%).
Premium/discount to NAV expresses the difference between the ETF’s price and its NAV value. A positive percentage indicates a premium, meaning the ETF trades at a higher price than the calculated NAV. Conversely, a negative percentage indicates a discount, suggesting the ETF trades at a lower price than NAV.
Premium/discount to NAV expresses the difference between the ETF’s price and its NAV value. A positive percentage indicates a premium, meaning the ETF trades at a higher price than the calculated NAV. Conversely, a negative percentage indicates a discount, suggesting the ETF trades at a lower price than NAV.
OOSB shares are issued by Volatility Shares LLC
OOSB follows the No Underlying Index. ETFs usually track some benchmark seeking to replicate its performance and guide asset selection and objectives.
The fund started trading on Feb 19, 2025.
The fund's management style is active, aiming to outperform its benchmark index by actively selecting and adjusting assets. The goal is to achieve returns that exceed those of the index the fund tracks.