CANSLIM Overview📘 CANSLIM Overview — The 7 Traits of Big Stock Winners
CANSLIM is an acronym developed by William J. O’Neil, founder of Investor’s Business Daily (IBD) and author of How to Make Money in Stocks.
It describes the seven common characteristics shared by the biggest winning stocks before their major price moves.
The system blends fundamental growth, institutional behavior, and market timing—and is grounded in historical quantitative studies dating back to the 1800s.
🧩 The Acronym:
Letter Stands For Core Concept
C Current Quarterly Earnings Explosive short-term earnings growth
A Annual Earnings Growth Multi-year compounding of profits
N New Product, Service, or Management Innovation driving market leadership
S Supply and Demand Stock’s float size and institutional accumulation
L Leader vs. Laggard Relative strength and group leadership
I Institutional Sponsorship Quality fund ownership and buying pressure
M Market Direction Aligning with the general market trend
1️⃣ C — Current Quarterly Earnings: Big Growth, Not Modest Growth
“The biggest winners showed three consecutive quarters of 25%+ growth, but the best averaged 70%+ before their runs.”
Measure this quarter vs. the same quarter last year, not sequentially. This avoids seasonal distortions.
Ideal Growth Rate:
Minimum: +25% YoY EPS growth for 3+ quarters
Stronger filter: +70–100% or even triple-digit earnings growth
Combine with revenue growth of 30–50% or more.
Stocks with massive EPS and sales growth attract institutional attention early.
Modern Adjustment:
Today’s growth leaders (e.g., NVDA, TSLA, PANW) still show these patterns, though some use non-GAAP EPS or adjusted metrics. The concept—explosive profitability inflection—remains identical.
2️⃣ A — Annual Earnings Growth: Sustained Profitability
“Look for at least three years of annual earnings increases.”
Consistency is key. Accelerating growth adds conviction.
Avoid one-time spikes or negative earnings trends.
Favor firms with 3+ years of 20%+ annual EPS growth and positive forward analyst estimates for continuation.
Analyst Upward Revisions are particularly powerful—funds often buy on these changes.
Interpretation:
Multi-year profit acceleration shows management execution, competitive edge, and strong demand.
Example: O’Neil’s model studies (1952–2001) showed 73% of winners had +70% EPS growth the quarter before their breakout and 3+ years of rising annual profits.
3️⃣ N — New Product, Service, Management, or Market Catalyst
“You want the next Apple, not the next RCA.”
Innovation is the engine of multiple expansion. The “new” can take many forms:
Breakthrough product or service
Transformative business model
New leadership or management
Market share disruption
Examples (then and now):
Apple (iPhone), Tesla (EVs), Nvidia (AI GPUs), Uber (gig economy)
Earlier eras: IBM, Home Depot, Microsoft
Psychological angle: Human nature craves novelty. The market rewards perceived future dominance, not current stability.
4️⃣ S — Supply and Demand: The Float Matters (Less Now)
Originally, O’Neil favored smaller floats (≤50–70M shares) since limited supply + strong demand = sharp price moves.
“It’s less critical today—large caps can still double or triple. Focus on quality, earnings, and leadership over share count.”
The principle still holds but is muted due to:
ETFs, passive flows, and massive institutional liquidity
Widespread retail access and option leverage
The core idea remains: price rises when demand exceeds supply, visible via volume surges.
Modern adaptation:
Monitor volume spikes, accumulation/distribution, and relative volume ratios over absolute float size.
5️⃣ L — Leader vs. Laggard: The Power of Relative Strength (RS)
“Buy the strongest stocks in the strongest groups during a confirmed uptrend.”
O’Neil found each bull cycle is led by 2–3 dominant industry groups (e.g., semiconductors, software, solar).
Within those, only the top few names outperform meaningfully.
Key Filters:
Relative Strength (RS) Rating: 85–99 (top 15% of market)
Leading groups by RS, EPS growth, and fund buying
Avoid laggards even within strong sectors.
Modern context:
Institutional algorithms still chase relative momentum. RS-based filters would be Ideal.
“When you have the strongest stocks, in the strongest sectors, in an uptrend—and you use disciplined stop-losses—it’s very hard not to make money.”
6️⃣ I — Institutional Sponsorship: The Smart Money Footprint
“70% of market volume comes from institutions—follow their footprints.”
Institutions (mutual funds, hedge funds, pension plans) create sustained demand that drives major trends.
Key things to watch:
Rising number of institutional holders quarter-over-quarter
Presence of high-quality funds (e.g., Fidelity Contra, Vanguard Growth)
Volume patterns on charts confirming accumulation
Quantitative Significance:
Example: Zoom (ZM)—278 funds → 1,413 funds within 7 quarters (5× increase)
Enphase (ENPH)—160 → 1,008 funds in 8 quarters
Such surges often precede parabolic price advances.
7️⃣ M — Market Direction: The Most Critical Factor
“If you don’t get the M right, nothing else matters.”
O’Neil’s data showed:
3 out of 4 stocks follow the general market trend.
Even perfect fundamentals fail in bear markets.
Core Rule: Only buy aggressively during a confirmed market uptrend.
The signal is the Follow-Through Day (FTD)—a +1.5% or greater gain on strong volume, typically 4–10 days after a market low.
When the Market Is Choppy or Bearish:
Reduce exposure or move to cash (cash is a position).
Focus on capital preservation over prediction.
⚠️ Risk Management — The “Eighth Principle”
“You can be right 1 out of 3 times and still make a fortune—if you cut losses fast.”
O’Neil borrowed from Jesse Livermore and Bernard Baruch’s philosophy:
Max loss per trade: 7–8% (ideally 5%)
Never average down; if it fails the breakout, sell immediately.
Emotional capital matters as much as financial capital.
Risk Math:
Loss Required Gain to Break Even
7% +7.5%
20% +25%
50% +100%
→ The deeper the drawdown, the harder recovery becomes — and the worse your discipline gets.
Cutting losses early keeps both capital and confidence intact.
Advanced Discipline:
Always use stop-losses near pivot points
Size positions so that total portfolio risk ≤1–2% per trade, and the Reward is 3x your risk.
Expect that most trades won’t work; winners will more than offset losers
🔢 Practical CANSLIM Checklist
Step Criterion Target Metric
C Current quarterly EPS growth ≥25%, ideally 70%+
A Annual EPS growth 3 consecutive years ≥20%
N Innovation or catalyst New product/service/management
S Supply-demand imbalance Volume > average, low float optional
L Leadership RS ≥85; top 3 names in top sector
I Institutional ownership Increasing QoQ, ≥2 top-tier funds
M Market trend Confirmed uptrend via FTD
Risk Stop loss 5–8% below entry, always enforced
🧠 Psychological Cornerstones
Human nature never changes. Fear and greed drive every cycle—from 1800s railroads to 2020s AI stocks.
Discipline beats prediction. Entry precision is less important than loss limitation.
Conviction comes from quality. Big winners are clear leaders with strong fundamentals.
Cash is a position. Avoid trading in “cold decks” (sideways or down markets).
Emotion control = longevity. Protect your confidence as much as your capital.
🧩 Modern CANSLIM Adaptations
While CANSLIM’s DNA remains timeless, modern quantitative investors integrate:
Relative Volume & RS Ranking (machine-scored)
EPS revision momentum (analyst upgrades)
Institutional rotation data (13F filings, ETF flows)
Macro context: liquidity cycles, Fed policy, credit spreads
Technical refinements: base patterns, volume dry-ups, and volatility contraction setups (VCP).
💬 Summary Insight
“Nothing has changed since the 1800s—only the tools.
Human nature and crowd behavior are constants.”
CANSLIM is a structured behavioral framework for spotting institutional accumulation of fundamentally superior companies at the right time in the market cycle.
Its greatest edge lies not in stock-picking, but in discipline—knowing what not to touch, when to cut, and when to press.
Here is the Screener I use.
www.tradingview.com
Trade ideas
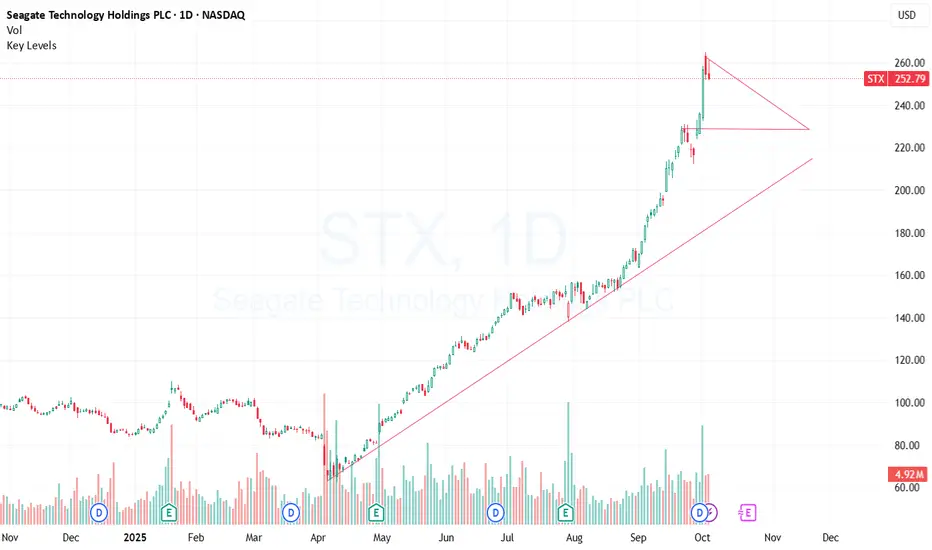
Take two STX: Shorting
Trade idea called out on OCt 1st 2025 worked out perfectly.
New Trade Idea:
Initial Short (Red Arrow): Short at $271, anticipating the top is near after the large run.
Take Profit (Green Arrow): Cover the entire short position at $201.88 for a swift profit.

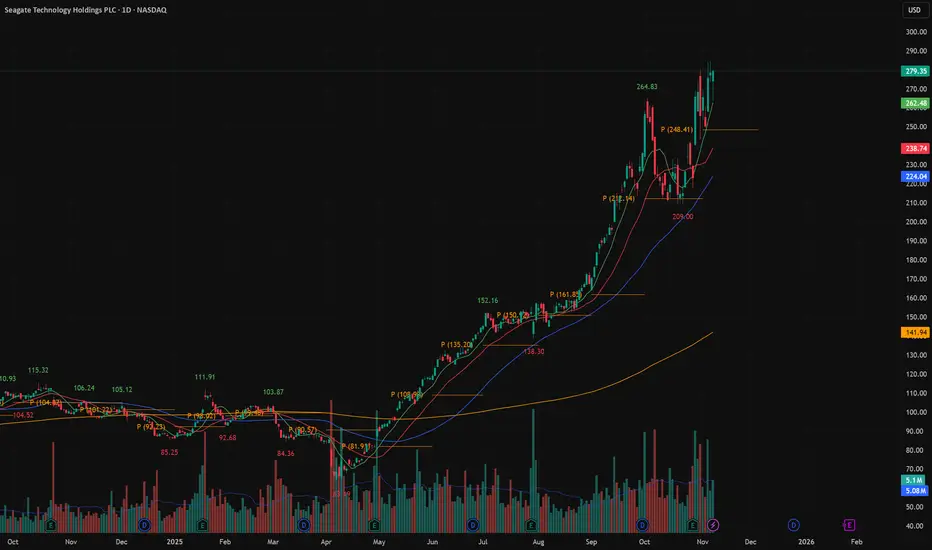
230 area of support, overbought in all The totality of the buy signal has since been astronomical, but with a retrace every 2-3% followed by a 5-8% spike. If it makes 270s-290s that could warrant enough for a correction, but even with buying pressure and a new record within might have to wait for another spike.
STX: Shorting the Peak RejectionThe Short Case: Overbought Technicals and Valuation Stretch
The primary argument for a tactical short trade on Seagate Technology (STX) is purely based on the extreme rate of recent appreciation and overbought technicals, which create a high-probability mean-reversion setup.
Extreme Price Momentum: The stock has seen a massive YTD rally (over 150%) and has been climbing rapidly over the last month (up ≈37% in the last month alone). This kind of parabolic move is rarely sustainable without a period of consolidation or a sharp pullback.
Overbought Indicators: Multiple technical analysis sources (from the search) indicate that STX is overbought on key oscillators like the RSI (Relative Strength Index) and Williams %R. While an overbought condition can persist, it signals increased risk for a momentum reversal.
Price Target Disparity (Risk): Although STX is benefiting from the AI/Mass Data boom, its current price ($236.06 - $248.80 range) is well above the consensus average analyst price target of approximately $173.58. Trading this far above the median fair value exposes the stock to significant downside if any news catalysts shift sentiment or if analysts begin lowering ratings/price targets.
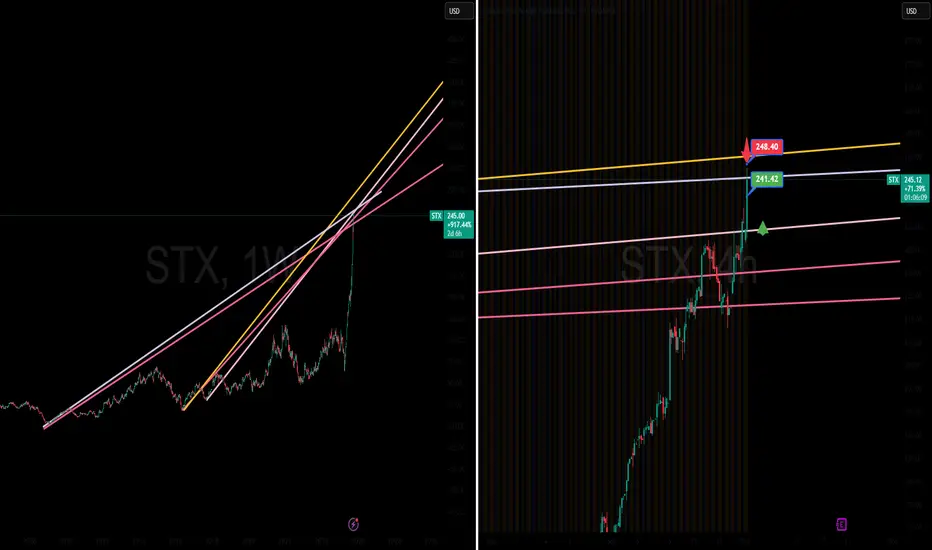
Trade Idea:
Initial Short (Red Arrow): Short a smaller position at $244.60, anticipating the top is near after the large run.
Scale-In (Aggressive/High-Risk): Only if trading volume is extremely high and the price briefly tags $248.80 then immediately reverses lower (a 'blow-off' top), you could aggressively add to the short at $248.80 with a tight stop-loss above it.
Take Profit (Green Arrow): Cover the entire short position at $240.84 for a swift profit.
$STX Tradespoon - Long Entry $219.85Tradespoon model generated long signal for $STX. Predicted range: $219.85-$228.53. Trend: +1.82%.

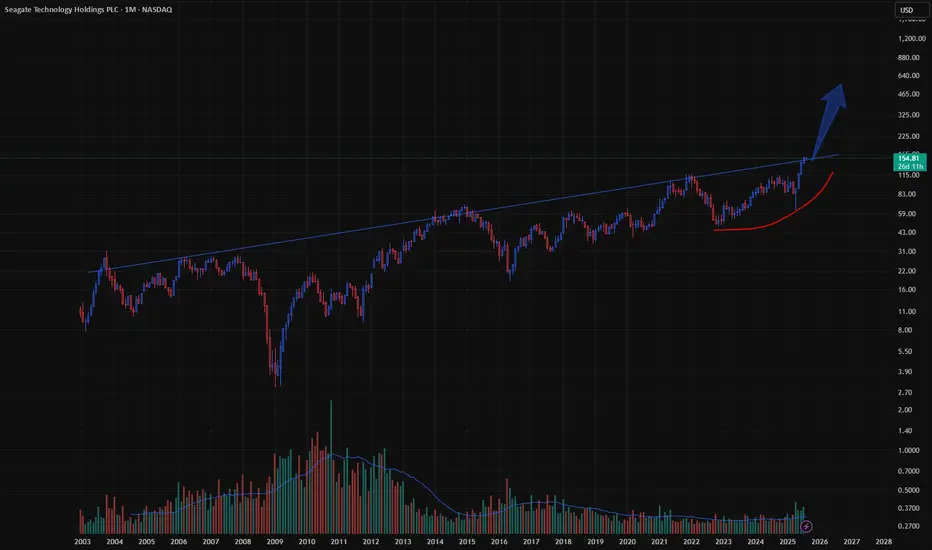
Seagate Technology STX – BUYSeagate has soared due to overwhelming demand for high-capacity data storage, driven by cloud computing and AI-related infrastructure growth. The company’s strategic investments in next-gen drives have paid dividends.

Seagate Technology Holdings (STX) – Technically Bullish SetupSeagate Technology Holdings (STX) – Technically Bullish Setup | Multibagger Potential 🚀
Ticker: NASDAQ:STX
Sector: Technology – Data Storage
Technical View:
Seagate Technology Holdings is showing strong bullish momentum on the charts. The price has broken out of recent consolidation with high volume support, signaling strong institutional interest.
✅ Strong breakout above key resistance zone
Momentum is building up, and this kind of structure often precedes major rallies. If current levels hold, STX has the potential to become a multibagger over the medium to long term.
Is Seagate Overbought?Seagate Technology has rallied sharply in recent weeks, but some traders may think the data-storage company is overbought.
The first pattern on today’s chart is the March low of $82.88. STX plunged three sessions later after tariffs were announced. Prices have returned to that level and now seem to be stalling. Has old support become new resistance?
Next, stochastics have reached an overbought condition.
Third, the 50-day simple moving average (SMA) had a “death cross” below the 200-day SMA in December. It’s stayed below that slower line since, which may suggest its longer-term trend has gotten more bearish.
TradeStation has, for decades, advanced the trading industry, providing access to stocks, options and futures. If you're born to trade, we could be for you. See our Overview for more.
Past performance, whether actual or indicated by historical tests of strategies, is no guarantee of future performance or success. There is a possibility that you may sustain a loss equal to or greater than your entire investment regardless of which asset class you trade (equities, options or futures); therefore, you should not invest or risk money that you cannot afford to lose. Online trading is not suitable for all investors. View the document titled Characteristics and Risks of Standardized Options at www.TradeStation.com . Before trading any asset class, customers must read the relevant risk disclosure statements on www.TradeStation.com . System access and trade placement and execution may be delayed or fail due to market volatility and volume, quote delays, system and software errors, Internet traffic, outages and other factors.
Securities and futures trading is offered to self-directed customers by TradeStation Securities, Inc., a broker-dealer registered with the Securities and Exchange Commission and a futures commission merchant licensed with the Commodity Futures Trading Commission). TradeStation Securities is a member of the Financial Industry Regulatory Authority, the National Futures Association, and a number of exchanges.
TradeStation Securities, Inc. and TradeStation Technologies, Inc. are each wholly owned subsidiaries of TradeStation Group, Inc., both operating, and providing products and services, under the TradeStation brand and trademark. When applying for, or purchasing, accounts, subscriptions, products and services, it is important that you know which company you will be dealing with. Visit www.TradeStation.com for further important information explaining what this means.

$STX with a neutral outlook following its earnings #StocksThe PEAD projected a neutral outlook for NASDAQ:STX after a negative under reaction following its earnings release placing the stock in drift D with an expected accuracy of 66.67%.

Seagate Technology ($STX): A Key Player in the AI RevolutionSeagate is emerging as a critical supplier for AI and cloud computing with its high-capacity disk drives, making up 83% of its hard drive sales last quarter. As AI computing demands balloon, the need for mass-capacity storage solutions is surging. Demand for near-line cloud storage doubled in the last quarter, driven by both traditional cloud workloads and new AI applications.
While we're still in the early innings of AI demand, the potential for big data applications is massive. Keep an eye on NASDAQ:STX as the AI revolution accelerates.

Seagate May Be Fighting HigherSeagate Technology has been climbing for more than a year, and now some traders may see potential for a breakout.
The first pattern on today’s chart is the $104.76 level, a closing peak in late August. The data-storage stock tested and held it this week. Has old resistance become new support?
Second, that same price area is also near a 50 percent retracement of the move between Friday, September 6 and Thursday, September 24. That may confirm its short-term direction is pointing higher.
Third, the recent series of lower highs may be viewed as a bullish flag with breakout potential.
Finally, the 8-day exponential moving average (EMA) is above the 21-day EMA. That may reflect a bullish short-term trend.
TradeStation has, for decades, advanced the trading industry, providing access to stocks, options and futures. If you're born to trade, we could be for you. See our Overview for more.
Past performance, whether actual or indicated by historical tests of strategies, is no guarantee of future performance or success. There is a possibility that you may sustain a loss equal to or greater than your entire investment regardless of which asset class you trade (equities, options or futures); therefore, you should not invest or risk money that you cannot afford to lose. Online trading is not suitable for all investors. View the document titled Characteristics and Risks of Standardized Options at www.TradeStation.com . Before trading any asset class, customers must read the relevant risk disclosure statements on www.TradeStation.com . System access and trade placement and execution may be delayed or fail due to market volatility and volume, quote delays, system and software errors, Internet traffic, outages and other factors.
Securities and futures trading is offered to self-directed customers by TradeStation Securities, Inc., a broker-dealer registered with the Securities and Exchange Commission and a futures commission merchant licensed with the Commodity Futures Trading Commission). TradeStation Securities is a member of the Financial Industry Regulatory Authority, the National Futures Association, and a number of exchanges.
TradeStation Securities, Inc. and TradeStation Technologies, Inc. are each wholly owned subsidiaries of TradeStation Group, Inc., both operating, and providing products and services, under the TradeStation brand and trademark. When applying for, or purchasing, accounts, subscriptions, products and services, it is important that you know which company you will be dealing with. Visit www.TradeStation.com for further important information explaining what this means.

Seagate Is Sitting Near HighsSeagate Technology has been consolidating near long-term highs, and some traders may expect a breakout.
The first pattern on today’s chart is the rally between May 3 and May 16. The data-storage company retraced half that move before continuing upward. That may confirm it’s moving higher.
Next, the bounce occurred above the May 13 weekly low and the 21-day exponential moving average. Those signals may be consistent with bullish short-term trends. MACD is also rising.
Turning to the longer-term trends, notice how April’s bounce occurred near the 100-day simple moving average (SMA). Prices have also returned above their 50-day SMA.
Finally, you have the falling trendline along the highs of May 16 and May 23. STX closed above it on Tuesday. Could that be the start of a breakout?
TradeStation has, for decades, advanced the trading industry, providing access to stocks, options and futures. See our Overview for more.
Past performance, whether actual or indicated by historical tests of strategies, is no guarantee of future performance or success. There is a possibility that you may sustain a loss equal to or greater than your entire investment regardless of which asset class you trade (equities, options or futures); therefore, you should not invest or risk money that you cannot afford to lose. Online trading is not suitable for all investors. View the document titled Characteristics and Risks of Standardized Options at www.TradeStation.com . Before trading any asset class, customers must read the relevant risk disclosure statements on www.TradeStation.com . System access and trade placement and execution may be delayed or fail due to market volatility and volume, quote delays, system and software errors, Internet traffic, outages and other factors.
Securities and futures trading is offered to self-directed customers by TradeStation Securities, Inc., a broker-dealer registered with the Securities and Exchange Commission and a futures commission merchant licensed with the Commodity Futures Trading Commission). TradeStation Securities is a member of the Financial Industry Regulatory Authority, the National Futures Association, and a number of exchanges.
TradeStation Securities, Inc. and TradeStation Technologies, Inc. are each wholly owned subsidiaries of TradeStation Group, Inc., both operating, and providing products and services, under the TradeStation brand and trademark. When applying for, or purchasing, accounts, subscriptions, products and services, it is important that you know which company you will be dealing with. Visit www.TradeStation.com for further important information explaining what this means.

4/23/24 - $STX print4/23/24 - $vrockstar - a short on multiples and industry factors - but i'm just not shorting single names on short amt of work. defn not a buy and if pops on mediocre results consider shorting in cash account

$STX exhibiting a Head and ShoulderNASDAQ:STX is showing signs of weakness with a Head and Shoulder pattern. The RSI is also pointing down showing weakness too. NASDAQ:SMCI already is plunging today after holding onto its support zone and had a Head and Shoulder pattern. Follow me on X account JLTrades@VWAPP88

Seagate Technology Stock Received Upside from Morgan StanleySeagate Technology Holdings Plc, known for its expertise in designing and manufacturing data storage devices, has recently received the attention of Morgan Stanley analysts and is earning a positive outlook. This endorsement comes amid expectations of the company reaching new price highs and making significant advancements in data storage technology.
Morgan Stanley's optimism is partly driven by the ongoing recovery in the data centre market, which is expected to continue. The upcoming cycle of storage hardware upgrades and the burgeoning demand for artificial intelligence (AI) technologies presents a fertile ground for Seagate's growth. As AI services often rely on extensive databases, the demand for substantial storage solutions becomes apparent, positioning Seagate favourably within the market.
Given this positive backdrop, a technical analysis of Seagate Technology's stock (STX) could provide valuable insights into its future price movements.
On the daily (D1) chart, Seagate's stock has established a support level at 85.26 USD and a resistance level at 98.80 USD, creating a wide trading channel with potential for an upward breakout. This pattern suggests a bullish outlook, with the stock potentially breaking through the resistance level and reaching new highs.
For traders looking at the hourly (H1) timeframe, a breach above the 98.80 USD resistance level could indicate a favourable entry point for long positions. A short-term price target is identified at 106.80 USD, with a medium-term goal extending up to 117.69 USD if the stock maintains its momentum beyond the initial breakout.
—
Ideas and other content presented on this page should not be considered as guidance for trading or an investment advice. RoboMarkets bears no responsibility for trading results based on trading opinions described in these analytical reviews.
The material presented and the information contained herein is for information purposes only and in no way should be considered as the provision of investment advice for the purposes of Investment Firms Law L. 87(I)/2017 of the Republic of Cyprus or any other form of personal advice or recommendation, which relates to certain types of transactions with certain types of financial instruments.
Risk Warning: CFDs are complex instruments and come with a high risk of losing money rapidly due to leverage. 66.02% of retail investor accounts lose money when trading CFDs with this provider. You should consider whether you understand how CFDs work and whether you can afford to take the high risk of losing your money.

SEAGATE: Potential BuySimilar behavior on last earnings. I don't have a reason to think we'll exit this ascending channel soon. Areas marked to look out for.

STXUptrend
Although it was a weak pullback, I can consider it as a good buying opportunity by target as about 117 and setting a good place for SL at about 95.

STXThis Week FORECAST
Opportunity for STX. This setup trading idea is for intraday. >> TAYOR
Risk Factors:
1. Market conditions, unexpected news, or external events could impact the trade.
2. Always use risk management strategies to protect your capital.

Seagate’s Tight PullbackSeagate Technology rallied in late 2023 and consolidated last month. Now some traders may see potential for the data-storage company to continue higher.
First consider some longer-term patterns. STX broke out to a new 52-week high in mid-November and peaked at $79.42 later that month. Prices continued upward in December and in January pulled back to hold the same monthly high from November.
Second, faster simple moving averages (SMAs) are above the slower ones. Notice how the red 50-day SMA is above the gray 100-day SMA, which is above the green 200-day SMA. That may reflect a longer-term uptrend has begun.
Turning to the shorter term, a big price swing in January seems to be resolving with another higher low. Notice how last week’s low matched the highest weekly close of 2023.
STX also trying to hold the 21-day exponential moving average (EMA). Finally, the 8-day EMA is above the 21-day EMA, which may reflect a shorter-term uptrend.
TradeStation has, for decades, advanced the trading industry, providing access to stocks, options and futures. See our Overview for more.
Important Information
Past performance, whether actual or indicated by historical tests of strategies, is no guarantee of future performance or success. There is a possibility that you may sustain a loss equal to or greater than your entire investment regardless of which asset class you trade (equities, options, futures or cryptocurrencies); therefore, you should not invest or risk money that you cannot afford to lose. Online trading is not suitable for all investors. View the document titled Characteristics and Risks of Standardized Options at www.TradeStation.com . Before trading any asset class, customers must read the relevant risk disclosure statements on www.TradeStation.com . System access and trade placement and execution may be delayed or fail due to market volatility and volume, quote delays, system and software errors, Internet traffic, outages and other factors.
Securities and futures trading is offered to self-directed customers by TradeStation Securities, Inc., a broker-dealer registered with the Securities and Exchange Commission (“SEC”) and a futures commission merchant licensed with the Commodity Futures Trading Commission (“CFTC”). TradeStation Securities is a member of the Financial Industry Regulatory Authority, the National Futures Association (“NFA”), and a number of exchanges. TradeStation Crypto, Inc. offers to self-directed investors and traders cryptocurrency brokerage services under federal and state money services business/money-transmitter and similar registrations and licenses.
TradeStation Securities, Inc., TradeStation Crypto, Inc., and TradeStation Technologies, Inc. are each wholly owned subsidiaries of TradeStation Group, Inc., all operating, and providing products and services, under the TradeStation brand and trademark. TradeStation Crypto, Inc. offers to self-directed investors and traders cryptocurrency brokerage services. It is neither licensed with the SEC or the CFTC nor is it a member of NFA. When applying for, or purchasing, accounts, subscriptions, products and services, it is important that you know which company you will be dealing with. Visit www.TradeStation.com for further important information explaining what this means.

STX - 10 months CUP & HANDLE══════════════════════════════
Since 2014, my markets approach is to spot
trading opportunities based solely on the
development of
CLASSICAL CHART PATTERNS
🤝Let’s learn and grow together 🤝
══════════════════════════════
Hello Traders ✌
After a careful consideration I came to the conclusion that:
- it is crucial to be quick in alerting you with all the opportunities I spot and often I don't post a good pattern because I don't have the opportunity to write down a proper didactical comment;
- since my parameters to identify a Classical Pattern and its scenario are very well defined, many of my comments were and would be redundant;
- the information that I think is important is very simple and can easily be understood just by looking at charts;
For these reasons and hoping to give you a better help, I decided to write comments only when something very specific or interesting shows up, otherwise all the information is shown on the chart.
Thank you all for your support
🔎🔎🔎 ALWAYS REMEMBER
"A pattern IS NOT a Pattern until the breakout is completed. Before that moment it is just a bunch of colorful candlesticks on a chart of your watchlist"
═════════════════════════════
⚠ DISCLAIMER ⚠
The content is The Art Of Charting's personal opinion and it is posted purely for educational purpose and therefore it must not be taken as a direct or indirect investing recommendations or advices. Any action taken upon these information is at your own risk.
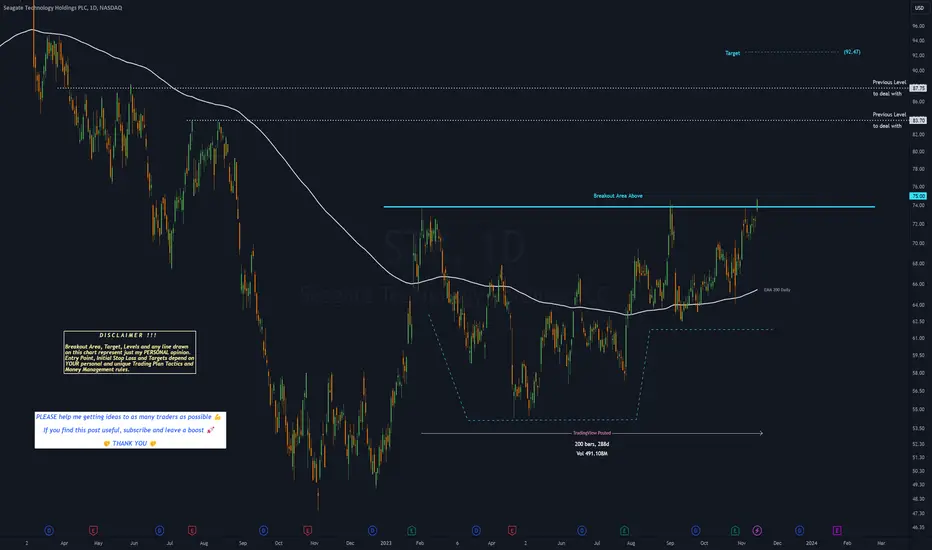

Wait for correction and wait for long term supportAs the entire market is since months in a consolidation phase, I wouldn't expect any wonders for STX.
But STX is on the long term in a good run with an upwards support zone around $57.
Two TP zone areas are possible depending on your time horizon
TP1: $77
TP2: old ATH at $110-$115

Long Picks 9/6These 4 are my top Long ideas for today into the future until the price stays above the Green TrapZone.
The picks are based on momentum, volume and price action.
