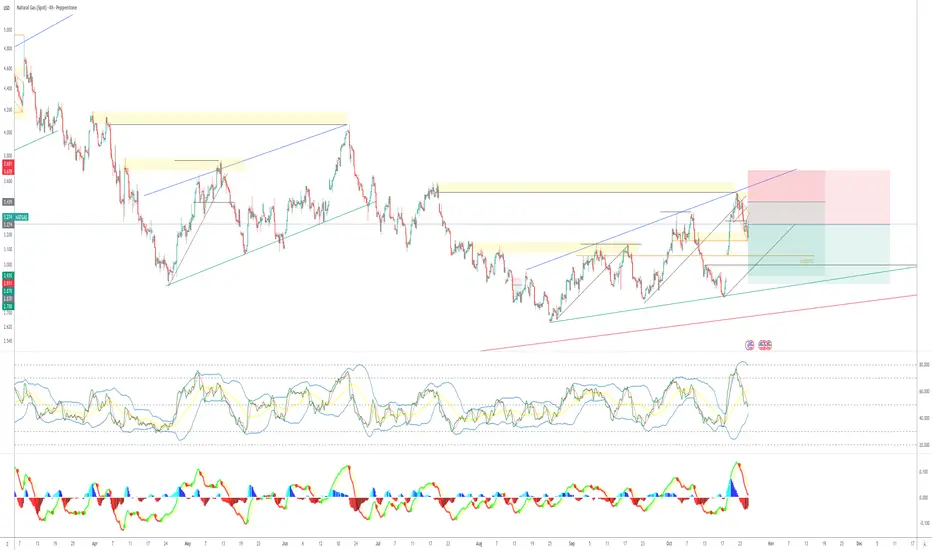
NATGAS Short (A+)Natgas has touched the supply zone within the channel, in a longterm down trend. This provides a great opportunity to sell at the premium price range with a 1R sell market order, and 2R sell limit if it provides a reentry from a higher price.
Technical analysis aligns well with fundamental analysis
Natural Gas - Horrific Inventory ReportToday Nat gas showed a greater than expected build in inventories.
The consensus was 78B vs 87B actual.
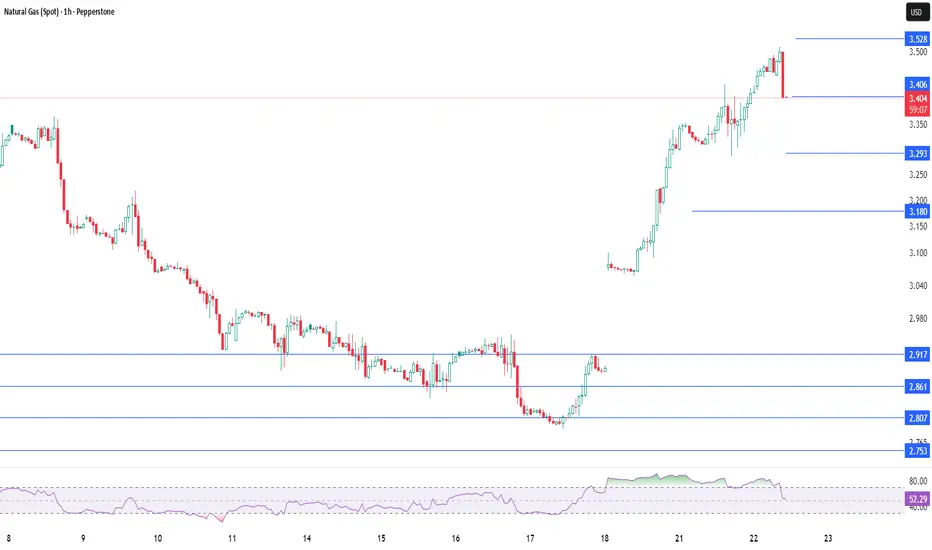
Nat Gas has now triggered a bearish hourly pattern that takes us lower. If we lose the 3.60 area you can be sure we are likely going to target the gap fill.
I'm watching for Natural gas to po

Natural gas - Target downsideNatural gas continue its down trend and meet the lower target as published

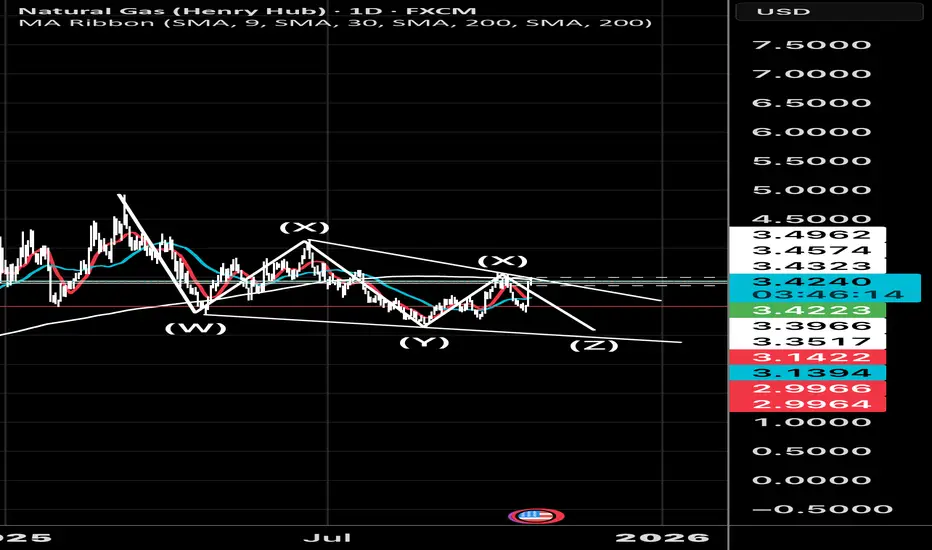
Triple zig zag for a double bottom ?Nat gas looks very much like a triple zig zag. With the last leg down to go. If it happens it looks like a great setup. 👌 let’s see if we fail here
Natural Gas Demolishes Shorts! Will The Move Hold?U.S. natural gas was up sharply today as some colder weather shows up in the temperature forecasts.
The fundamentals based off of previous inventories show slightly lower demand expectations.
This move could be a one off pop, it certainly needs to be reinforced by Thursdays inventory number to b

Natural Gas - Did You Profit?Today natural gas saw some downside pressure.
We closed our KOLD long - which was our short trade on Nat Gas, netting over 8% gain.
Being nimble in the Nat gas market is key, as its a very choppy asset and gains can be lost very quickly.
Breaking below the 7 day MA needs to be watched closely

The Natural Gas Will Jump from a Support LevelHello Traders
In This Chart Natural Gas HOURLY Forex Forecast By FOREX PLANET
today Natural Gas analysis 👆
🟢This Chart includes_ (Natural Gas market update)
🟢What is The Next Opportunity on Natural Gas Market
🟢how to Enter to the Valid Entry With Assurance Profit
This CHART is For Trader's that Want

Heading to $4Still might chop next week, but the greater trend lines and fib retracement are saying we are going back up

U.S. Natural Gas — mild weather weighs, trend stays bearishU.S. Natural Gas — mild weather weighs, trend stays bearish
U.S. natural gas fell for a third straight session as the latest EIA report showed an 80 Bcf build, leaving inventories 4.3% above the 5-year average. Analysts cite mild weather and an oversupplied market as key drivers.
Production remains

See all ideas
Displays a symbol's price movements over previous years to identify recurring trends.