Adobe - The major triangle breakout!🎯Adobe ( NASDAQ:ADBE ) breaks out soon:
🔎Analysis summary:
For the past five years, Adobe has overall been consolidating within a bullish triangle pattern. This triangle seems to be quite similar to the triangle which we saw back in 2012. And with the current retest of the confluence of suppo
Key facts today
Next report date
—
Report period
—
EPS estimate
—
Revenue estimate
—
22.14 CAD
7.79 B CAD
30.17 B CAD
417.09 M
About Adobe Inc.
Sector
Industry
CEO
Shantanu Narayen
Website
Headquarters
San Jose
Founded
1982
ISIN
CA00723H1082
FIGI
BBG01JDLY1K4
Adobe, Inc. is a global technology company, which engages in the provision of digital marketing and media solutions. It operates through the following segments: Digital Media, Digital Experience, and Publishing and Advertising. The Digital Media segment offers products and services that enable individuals, teams, businesses, and enterprises to create, publish, and promote content anywhere and accelerate productivity by transforming view, share, engage with and collaborate on documents and creative content. The Digital Experience segment focuses on integrated platform and set of products, services, and solutions that enable businesses to create, manage, execute, measure, monetize, and optimize customer experiences that span from analytics to commerce. The Publishing and Advertising segment includes legacy products and services that address diverse market opportunities, including eLearning solutions, technical document publishing, web conferencing, document and forms platform, web app development, high-end printing, and Adobe Advertising offerings. The company was founded by Charles M. Geschke and John E. Warnock in December 1982 and is headquartered in San Jose, CA.
Related stocks

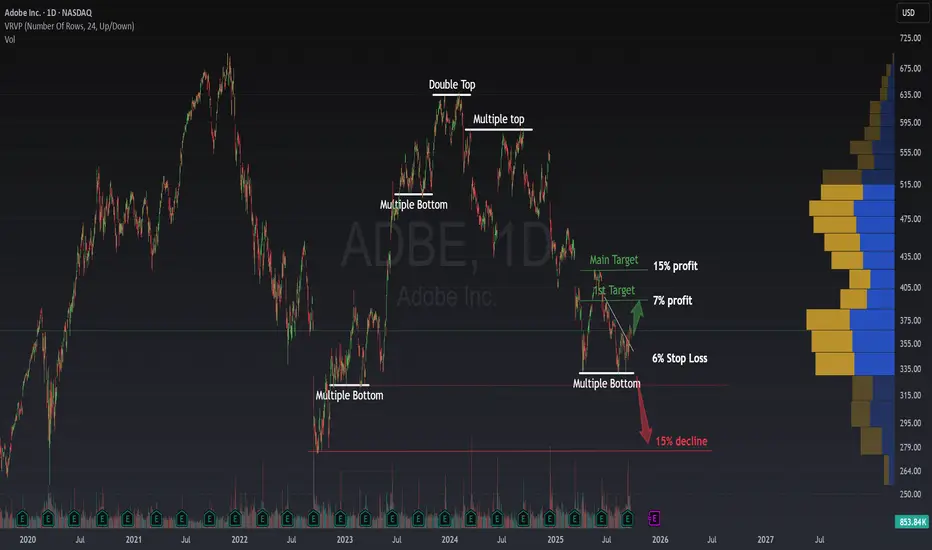
Adobe: Multiple Bottom Signals Potential UpsideAdobe: Multiple Bottom Signals Potential Upside
NASDAQ:ADBE has a clear history of respecting Multiple Bottoms and Tops . In other words, the stock tends to test the same price levels several times before moving decisively in the opposite direction. This repetitive behavior has been a reliable
ADBE (Adobe Inc.) — 4H TF Pre-Earnings Setup (Buy-Stop)ADBE (Adobe Inc.) — 4H TF | Heikin Ashi
Adobe printed a heavy corrective downtrend, but recently price action broke structure (BOS) at $365 and is now consolidating just below resistance. This makes a pre-earnings breakout buy stop setup attractive if bullish momentum continues.
Earnings are sched

Adobe (ADBE): Undervalued AI Software Leader Amid #AI Boom? Adobe (ADBE): Undervalued AI Software Leader Amid #AI Boom? $456 in Sight? 📈
Trading at $364.08 (-0.50%), ADBE's P/E of 22.67 undervalues its AI-integrated creative tools, with analysts eyeing $456 (25% upside)—will surging #AI trends propel cloud subscriptions higher? 🚀
**Fundamental Analys

9/24/25 - $adbe - Building the '28 LEAP book9/24/25 :: VROCKSTAR :: NASDAQ:ADBE
Building the '28 LEAP book
- After scratching my head on NYSE:FI and NYSE:CRM (HSD growth with healthy 6-7% FCF mgns), I asked myself the question: how many other mid-to-large cap stocks share a similar profile and how are they faring?
- NASDAQ:ADBE , $DE

ADOBE 510 BY 2026 LONG TERM Why Adobe (ADBE) Could Hit $510 by 2026: Technical Breakdown Adobe's trading at ~$365 today, but bullish setups scream upside. Here's why $510 (40% gain) is in play:Bullish Triangle Breakout: ADBE's consolidated in a multi-year ascending triangle since 2020. A recent close above $370 resistance (nea

BTDUSD 1W Chatt in Mar 2020 & ADBE 1W Chart as of 19 Sep 2025Hello friends,
Will ADBE rally like BTC did. This is a question for everyone, but in my opinion it is very well set to continue trending up. what are your thoughts?
If you like my ideas, please hit the like, and follow button.
thank you

Technical Analysis on Adobe Inc. (ADBE) – Bullish Strategy
📊 Technical Analysis on Adobe Inc. (ADBE) – Bullish Strategy
🔍 Context and Price Structure
After a strong bullish impulse, the stock entered a distribution phase that culminated in a double top (Top 1 & Top 2), which triggered a medium-term downtrend.
The decline formed a Falling Wedge pattern, ty

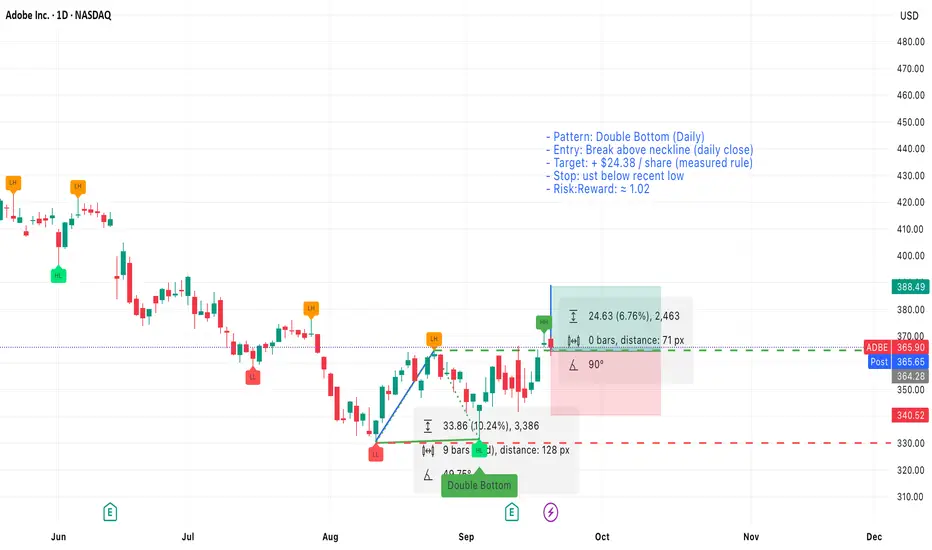
Adobe (ADBE) — Daily — Double BottomSetup
Pattern: Double bottom on the daily chart with two clear lows and a visible neckline.
Timeframe: Daily
Measuring rule (target)
Measure the vertical distance from the bottoms to the neckline and add it to the breakout point. Using this method the measured target equals +$24.38 p
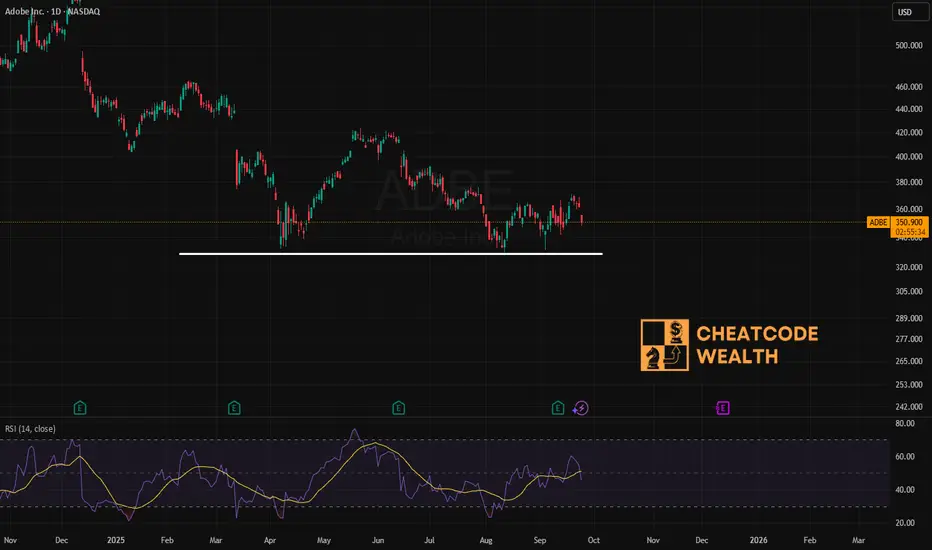
$ADBE Bulls need $330 to holdIf ADBE cannot hold $330 which it has tested three times, and a fourth test is likely to fail, it is not promising technical signal for bulls.
See all ideas
Summarizing what the indicators are suggesting.
Oscillators
Neutral
SellBuy
Strong sellStrong buy
Strong sellSellNeutralBuyStrong buy
Oscillators
Neutral
SellBuy
Strong sellStrong buy
Strong sellSellNeutralBuyStrong buy
Summary
Neutral
SellBuy
Strong sellStrong buy
Strong sellSellNeutralBuyStrong buy
Summary
Neutral
SellBuy
Strong sellStrong buy
Strong sellSellNeutralBuyStrong buy
Summary
Neutral
SellBuy
Strong sellStrong buy
Strong sellSellNeutralBuyStrong buy
Moving Averages
Neutral
SellBuy
Strong sellStrong buy
Strong sellSellNeutralBuyStrong buy
Moving Averages
Neutral
SellBuy
Strong sellStrong buy
Strong sellSellNeutralBuyStrong buy
Displays a symbol's price movements over previous years to identify recurring trends.
ADBE5981558
Adobe Inc. 5.3% 17-JAN-2035Yield to maturity
4.57%
Maturity date
Jan 17, 2035
ADBE5784629
Adobe Inc. 4.95% 04-APR-2034Yield to maturity
4.48%
Maturity date
Apr 4, 2034
US724PAD1
Adobe Inc. 2.3% 01-FEB-2030Yield to maturity
4.11%
Maturity date
Feb 1, 2030
ADBE5981252
Adobe Inc. 4.95% 17-JAN-2030Yield to maturity
4.01%
Maturity date
Jan 17, 2030
ADBE5784440
Adobe Inc. 4.8% 04-APR-2029Yield to maturity
3.99%
Maturity date
Apr 4, 2029
US724PAC3
Adobe Inc. 2.15% 01-FEB-2027Yield to maturity
3.91%
Maturity date
Feb 1, 2027
ADBE5784439
Adobe Inc. 4.85% 04-APR-2027Yield to maturity
3.86%
Maturity date
Apr 4, 2027
ADBE5981557
Adobe Inc. 4.75% 17-JAN-2028Yield to maturity
3.80%
Maturity date
Jan 17, 2028
See all ADBE bonds
Curated watchlists where ADBE is featured.


