AMAT eyes on $228: Dual Fib zone ideal support for a Higher-LowAMAT has been lacking any direction for quite a while.
Dipped into a significant support zone at $227.70-227.99
Look for a clean bounce or a Break-n-Retest if dips below.
.
Previous Analysis that caught the EXACT BOTTOM:
Hit BOOST and FOLLOW for more such PRECISE and TIMELY charts.
=============
Applied Materials, Inc. Shs Sponsored Canadian Depository Receipt Hedged Reg
No trades
Key stats
About Applied Materials, Inc.
Sector
Industry
CEO
Gary E. Dickerson
Website
Headquarters
Santa Clara
Founded
1967
ISIN
CA03822G1046
FIGI
BBG01S2TMJ05
Related stocks

Applied Materials | AMAT | Long at $169.75Republican Ashley Moody recently dropped $200k-$500k on Applied Materials $NASDAQ:AMAT. The semiconductor boom may not be over...
Price-to-earnings: 21.68x (great in comparison to others...)
Debt-to-equity: 0.34x (low)
Cash flow: $10.4 billion (FY2024)
Insiders awarded options recently
Unless NAS

AMAT IDEACurrent demand level is a weak one and we can expect that this level will induce early buyers which can get wiped out when we set another bearish leg down to the next demand level where we can look to buy from.

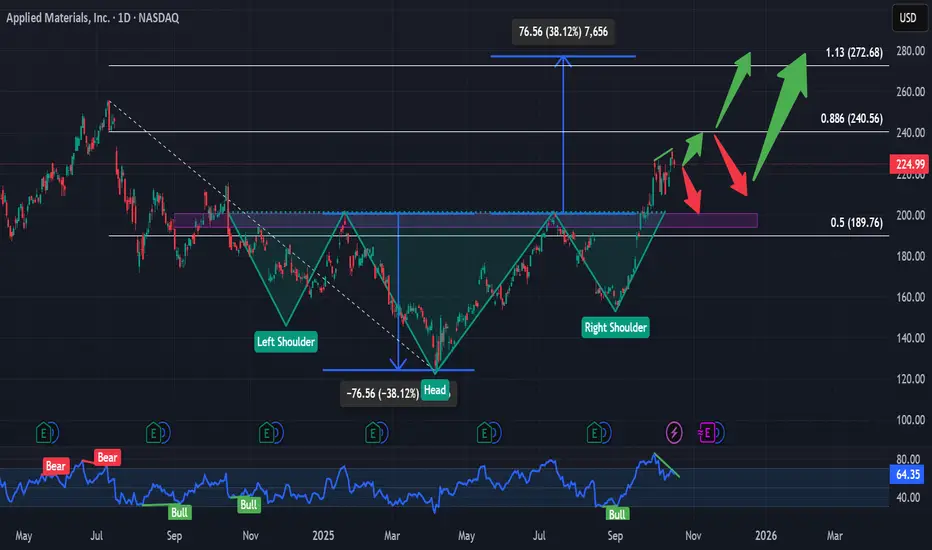
$AMAT Inverse head and shoulders patternNotes for self: will possibly buy if it follows the red arrows, sell if it reaches the green arrows.
Puts on AMAT 10/16Early morning rise then shakeout the longs. Indices down; same pattern as yesterday the15th.
Looking for further decline with uncertainty. Ie, China tariffs, Gov't shutdown

AMAT LongThe broader market structure on AMAT (15-minute) shows a clear bearish trend following the major Break of Structure (BOS) at 226.46, where price violated a previous higher low and shifted momentum downward. This BOS confirmed the end of the prior bullish leg and established a lower-high–lower-low se

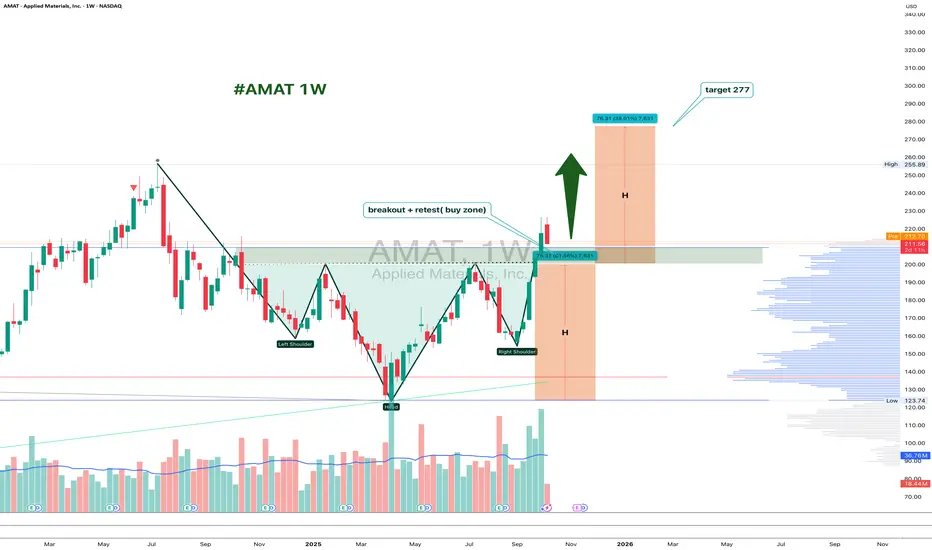
AMAT 1W: Retesting the Neckline Before the Next Move?On the weekly chart, Applied Materials (AMAT) has completed a clean inverted head and shoulders breakout around $226, and is now pulling back to retest the neckline zone near $200–211.
This area acts as strong support. If buyers defend it, the bullish pattern stays valid, with a projected target
AMAT-upside outlookAMAT previous monthly/3 months timeframe closed pretty much confirm the reversal to the upside.
My targets are $270-440-(best case)720

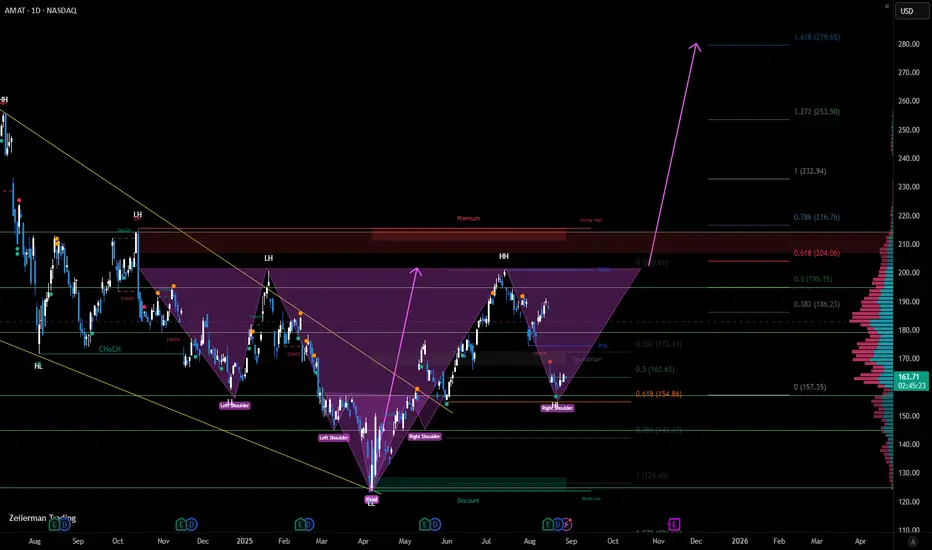
AMAT, ready for next ATHAfter retracement Fib 0,618, seeking for 200, for resistance level as neckline, and then target can be 280 for inverse head and shoulders which is almost same for Fib extension of 1.618 .
* Not for trading advice *
AMAT - Applied Materials Inc. - Broke Previous HighHello Everyone,
This is the second one that i added to my Watch List.
AMAT - Applied Materials Inc. - What They do?
Applied Materials Inc. is a global technology company focused on material engineering solutions for the semiconductor, flat panel display, and solar photovoltaic (PV) industries. T
See all ideas
Summarizing what the indicators are suggesting.
Oscillators
Neutral
SellBuy
Strong sellStrong buy
Strong sellSellNeutralBuyStrong buy
Oscillators
Neutral
SellBuy
Strong sellStrong buy
Strong sellSellNeutralBuyStrong buy
Summary
Neutral
SellBuy
Strong sellStrong buy
Strong sellSellNeutralBuyStrong buy
Summary
Neutral
SellBuy
Strong sellStrong buy
Strong sellSellNeutralBuyStrong buy
Summary
Neutral
SellBuy
Strong sellStrong buy
Strong sellSellNeutralBuyStrong buy
Moving Averages
Neutral
SellBuy
Strong sellStrong buy
Strong sellSellNeutralBuyStrong buy
Moving Averages
Neutral
SellBuy
Strong sellStrong buy
Strong sellSellNeutralBuyStrong buy
AP2A
Applied Materials, Inc. 4.35% 01-APR-2047Yield to maturity
5.42%
Maturity date
Apr 1, 2047
AMAT4993873
Applied Materials, Inc. 2.75% 01-JUN-2050Yield to maturity
5.32%
Maturity date
Jun 1, 2050
AMAT.GH
Applied Materials, Inc. 5.85% 15-JUN-2041Yield to maturity
5.24%
Maturity date
Jun 15, 2041
AMAT6177155
Applied Materials, Inc. 4.6% 15-JAN-2036Yield to maturity
4.75%
Maturity date
Jan 15, 2036
US38222AK1
Applied Materials, Inc. 5.1% 01-OCT-2035Yield to maturity
4.69%
Maturity date
Oct 1, 2035
AMAT6177154
Applied Materials, Inc. 4.0% 15-JAN-2031Yield to maturity
4.20%
Maturity date
Jan 15, 2031
AMAT4993872
Applied Materials, Inc. 1.75% 01-JUN-2030Yield to maturity
4.16%
Maturity date
Jun 1, 2030
AMAT5827120
Applied Materials, Inc. 4.8% 15-JUN-2029Yield to maturity
4.07%
Maturity date
Jun 15, 2029
US38222AL9
Applied Materials, Inc. 3.3% 01-APR-2027Yield to maturity
3.94%
Maturity date
Apr 1, 2027
See all AMAT bonds
Curated watchlists where AMAT is featured.


