QCOM US🌎Qualcomm has several compelling drivers for future growth, the most important of which are successful business diversification and an ambitious entry into the new data center market.
Key growth drivers:
Entering the AI data center market.
The company signed its first contract with startup Humane to deploy a 200-megawatt infrastructure starting in 2026.
Diversification and growth beyond smartphones
Automotive segment: revenue exceeded $1 billion in the quarter, with year-over-year growth of 21-36%.
- IoT segment: revenue grew by 22-24% year-over-year.
Report:
Record annual revenue of the QCT division: ~$44 billion
High margins: EBITDA margin of 31%, net profit margin of 26%
Shares are trading at a significant discount to peers.
Trade ideas
Qualcomm Incorporated ($QCOM) Surges on Record Q4 EarningsQualcomm Incorporated (Nasdaq: NASDAQ:QCOM ) delivered a strong fiscal Q4 2025, posting record results that surpassed Wall Street expectations and reinforced its leadership across mobile, automotive, and IoT markets. The stock, currently trading near $172, remains in a long-term uptrend supported by a clear ascending trendline, with technicals hinting at a potential continuation rally toward the $230 region.
For the quarter, Qualcomm reported $11.3 billion in revenue, exceeding its guidance range, and a non-GAAP EPS of $3, also above the high end of expectations. Its QCT (chipmaking) division led the charge, generating $9.8 billion, up 9% sequentially, while the automotive business posted a record $1 billion in quarterly revenue — a 36% year-over-year surge. The IoT segment also expanded by 22%, highlighting diversification beyond smartphones.
On a full-year basis, Qualcomm’s fiscal 2025 non-GAAP revenue climbed 13% year-over-year to $44 billion, with QCT contributing $38.4 billion, up 16%. The company achieved a 29% EBT margin, hitting the upper end of guidance, and reported a record $12.8 billion in free cash flow, underscoring operational strength and disciplined capital management.
Looking ahead, Qualcomm expects Q1 fiscal 2026 revenue between $11.8 billion and $12.6 billion, with EPS projected at $3.30 to $3.50. QCT revenue is guided between $10.3 billion and $10.9 billion, while licensing (QTL) is expected to deliver $1.4–$1.6 billion.
Technically, the chart suggests a bullish retest scenario near $170–$165 before a possible rebound toward $230, aligning with the company’s strong growth outlook. With momentum building in automotive and AI-powered chip demand, Qualcomm is well-positioned for further upside as 2026 begins.

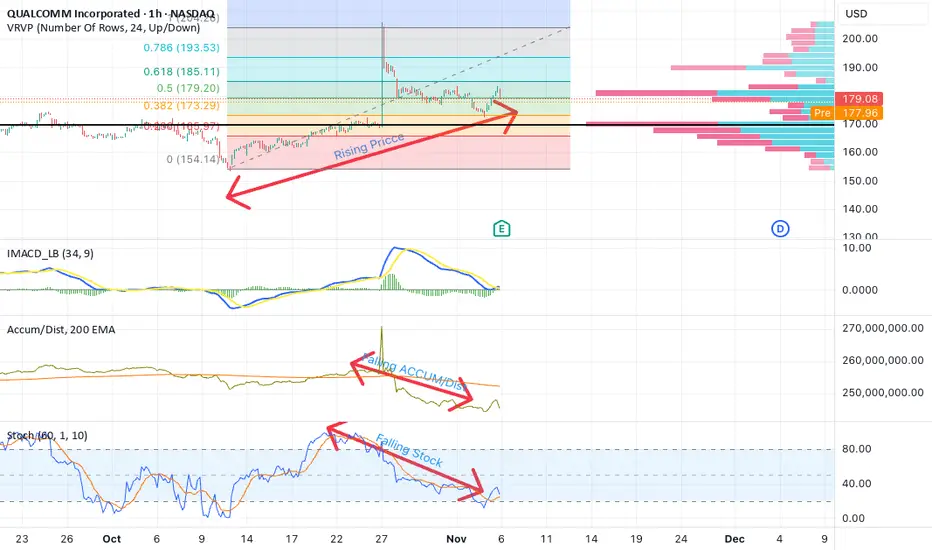
QCOM Faced Divergence and Resistance going into EarningsI found many signs of Divergence in Qualcomm going into Earnings. I am not one to identify as bearish nor Bullish but It needs to make sense to me in terms of momentum. Prior into Earnings I found several issues with the symbol.
QCOM Faced several points of resistance and weakening signs of moment.
Diverging 60 day stohiastic
Diverging smooth MAcd
Diverging ACCUM/DIST
I also saw that the fair price was becoming a point of resistance and the Fib was struggling at .5% following a retracement of the huge $18 dollar movement. Granted, I am a momentum trader and have no loyalty to the weather a stock goes up or down, but in the recent time to come it seems to me investors are not rushing to invest. We will more then likely test 170 soon. Only time will tell!
Qualcomm Rose 11% in One Day on AI Plans. What Its Chart SaysSemiconductor designer Qualcomm NASDAQ:QCOM , which is known for providing products to the consumer-electronics industry, rose more than 11% to a 15-month high in a single day last week when it announced a pivot into the world of artificial intelligence. Let's see what QCOM's chart and fundamentals say following the news and ahead of this week's earnings release.
Qualcomm's Fundamental Analysis
QCOM plans to release fiscal Q4 numbers after the market close on Wednesday, with Wall Street currently looking for $2.86 in adjusted earnings per share on roughly $10.75 billion of revenue.
That would represent a 6.3% annual gain in earnings from the $2.69 in adjusted EPS that QCOM reported in the same period last year. Revenue would likewise have risen some 5% from about $10.24 billion a year earlier.
In fact, 16 of the 26 sell-side analysts that I know of that cover this name have revised their earnings estimates higher since the quarter began, while only nine have lowered their projections. (One estimate remains unchanged.)
Of course, markets will also want to hear management's commentary on the shift to AI, which will put Qualcomm in head-to-head competition with likes of Nvidia NASDAQ:NVDA and Advanced Micro Devices NASDAQ:AMD .
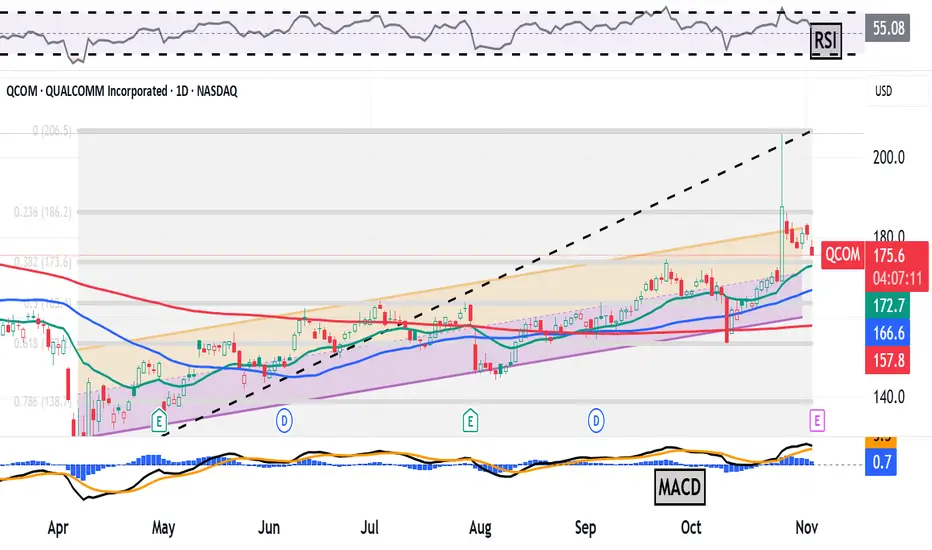
Qualcomm's Technical Analysis
Now let's look at QCOM's chart going back some eight months and running through Friday afternoon:
Readers will see that Qualcomm rose 70.5% between hitting a 17-month intraday low of $120.80 on April 7 and a $205.95 session high on Oct. 27 following the AI announcement.
Still, QCOM has for the most part methodically traded during this whole period within the confines of the Raff Regression model that I created above (marked with orange and pink fields).
That said, the stock has come in some after its Oct. 27 blow-off top -- perhaps because Qualcomm's new AI-friendly chips won't be ready for a number of months.
As QCOM pulled back, it felt around for support close to the 38.2% Fibonacci-sequence retracement level of the stock's entire 2025 rally (marked with gray shading in the chart above).
That's the downside pivot here, but there's technical help for Qualcomm not far below the 38.2% Fib level.
QCOM's 21-day Exponential Moving Average (or "EMA," marked with a green line at $171.60) lies nearby. That's where we might find out if the swing crowd is on board with Qualcomm's recent upward move.
If not, Qualcomm's 50-day Simple Moving Average (or "SMA," denoted with a blue line) and its 200-day SMA (the red line) aren't far below the 21-day EMA.
Those are levels where the professional money managers might be, so there's plenty of possible support for QCOM indicated in the chart above.
All in, Qualcomm's upside pivot could be the stock's recent $205.95 high. Conversely, the stock's downside pivot could be that 38.2% Fib level.
As for the stock's secondary technical indicators, Qualcomm's Relative Strength Index (the gray line at the chart's top) is quite robust, yet not overbought technically.
Meanwhile, the stock's daily Moving Average Convergence Divergence indicator (or "MACD," denoted by black and gold lines and blue bars at the chart's bottom) is overtly bullish.
Within the MACD, the histogram of the 9-day EMA is well into positive territory, while the 12-day EMA rides above the 26-day EMA and both are above the zero-bound. Those are all bullish technical signals.
An Options Option
Options traders who want to go long on QCOM while getting paid to take on equity risk might utilize what's called a "bull-put spread."
This is constructed by selling one put and buying a second one with a lower strike, but the same expiration date. Here's an example:
-- Sell one QCOM $175 put with a Nov. 7 expiration date (i.e. after this week's earnings). This costs about $3.75.
-- Buy one QCOM Nov. 7 $165 put for roughly $1.30.
Net Credit: $2.45
Should Qualcomm -- which closed at $180.72 Monday -- never trade as low as $175 prior to the options' Nov. 7 expiration, the trader will simply pocket the $2.45 net credit.
And should the stock trade below $175 at expiration but not below $165, the trader would end up long 100 shares of QCOM at a $172.55.
But what if the shares take a serious beating between now and Nov. 7? Well, if QCOM drops below $165 at expiration, the trader in the example above would have lost $10 on the equity trade less the $2.45 net credit for the bull-put spread. That works out to a $7.55 net loss.
(Moomoo Technologies Inc. Markets Commentator Stephen "Sarge" Guilfoyle had no position in QCOM at the time of writing this column, but was long NVDA and AMD.)
This article discusses technical analysis, other approaches, including fundamental analysis, may offer very different views. The examples provided are for illustrative purposes only and are not intended to be reflective of the results you can expect to achieve. Specific security charts used are for illustrative purposes only and are not a recommendation, offer to sell, or a solicitation of an offer to buy any security. Past investment performance does not indicate or guarantee future success. Returns will vary, and all investments carry risks, including loss of principal. This content is also not a research report and is not intended to serve as the basis for any investment decision. The information contained in this article does not purport to be a complete description of the securities, markets, or developments referred to in this material. Moomoo and its affiliates make no representation or warranty as to the article's adequacy, completeness, accuracy or timeliness for any particular purpose of the above content. Furthermore, there is no guarantee that any statements, estimates, price targets, opinions or forecasts provided herein will prove to be correct.
Options trading is risky and not appropriate for everyone. Read the Options Disclosure Document ( j.moomoo.com ) before trading. Options are complex and you may quickly lose the entire investment. Supporting docs for any claims will be furnished upon request.
Options trading subject to eligibility requirements. Strategies available will depend on options level approved.
Maximum potential loss and profit for options are calculated based on the single leg or an entire multi-leg trade remaining intact until expiration with no option contracts being exercised or assigned. These figures do not account for a portion of a multi-leg strategy being changed or removed or the trader assuming a short or long position in the underlying stock at or before expiration. Therefore, it is possible to lose more than the theoretical max loss of a strategy.
Moomoo is a financial information and trading app offered by Moomoo Technologies Inc. In the U.S., investment products and services on Moomoo are offered by Moomoo Financial Inc., Member FINRA/SIPC.
TradingView is an independent third party not affiliated with Moomoo Financial Inc., Moomoo Technologies Inc., or its affiliates. Moomoo Financial Inc. and its affiliates do not endorse, represent or warrant the completeness and accuracy of the data and information available on the TradingView platform and are not responsible for any services provided by the third-party platform.
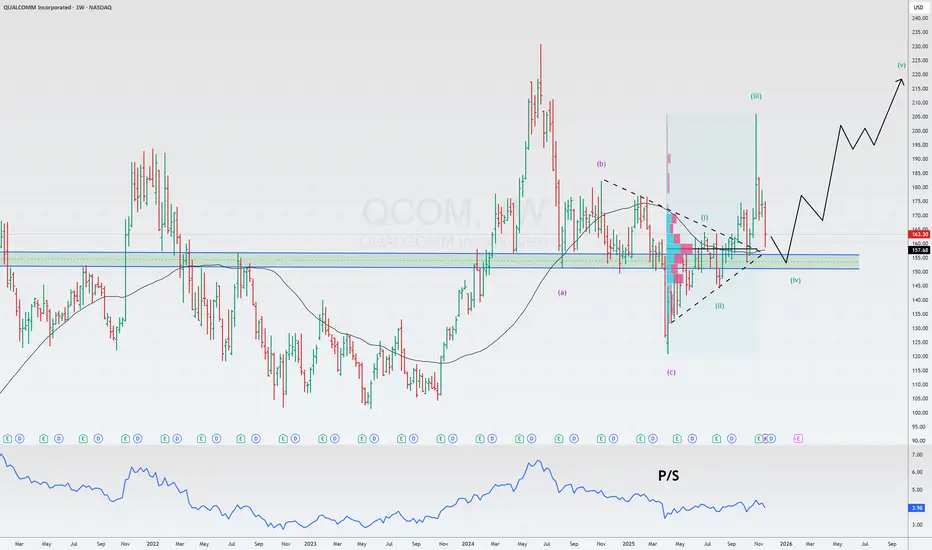
QCOM: Weekly, Quarterly and EarningsPer request, here are my thoughts and analysis on QCOM.
Fundamentals are important for this ticker and here is why:
QCOM has underperformed the broader market ins 2025 due to its over-reliance on smartphone sales (about 75% of their business is tailored to smartphone sector, which is stagnate at present).
AAPL has shifted to custom chips for their phones, which has traditionally been a big supporter of QCOM.
QCOM is attempting to branch into the AI hype with its AI200 and 250 datacentre chips, the announcement of which boosted the stock by 11% in a day, investors still show caution with QCOM.
QCOM trades at a P/E ratio of ~16, far below Nvidia’s, suggesting undervaluation—but also reflecting investor caution
QCOM has made some big acquisitions and seems genuinely committed to diversification and expanding its operations and interests; however, its not at the level of AMD / NVDA and MSFT as of yet, leaving a lot of investor concern which you can see from the general under-performance of the stock.
As always, not advice!

$QCOM Long - Get in while you still can
NASDAQ:QCOM has plenty of room to push, and although their chips don't actually come out for over 1 year from now. Markets are hot for AI, and just like internet companies in the dot com bubble, it does not need actual revenues to run on hype.
I am long and believe we will break all time highs within the next 6 months.

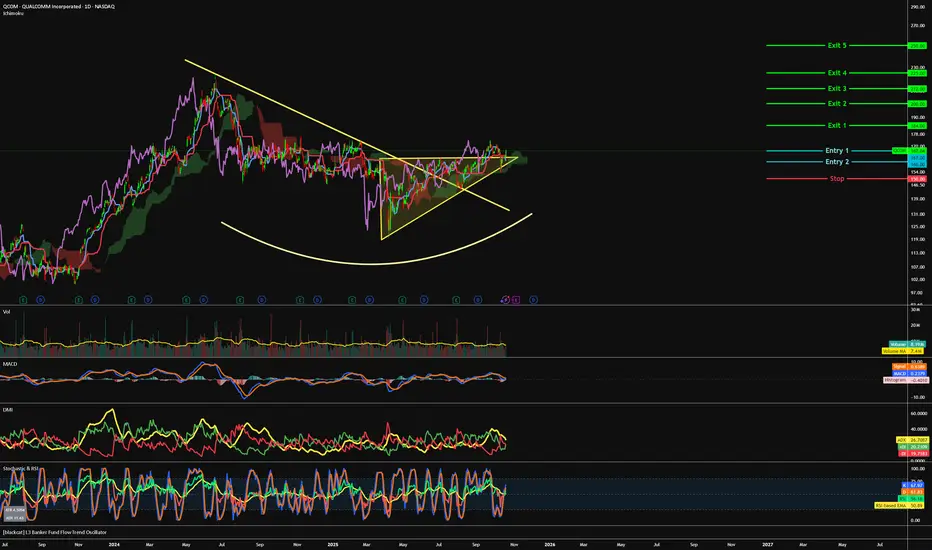
QCOM - Ascending back to high =======
Volume
=======
- neutral
==========
Price Action
==========
- Ascending Triangle observed
- 1 year downtrend line broken, supported on the same trend line
=================
Technical Indicators
=================
- Ichimoku
>>> price above cloud
>>> Red kumo budding
>>> Tenken - Above clouds
>>> Chiku - Above clouds
>>> Kijun - Above clouds and sloping away
=========
Oscillators
=========
- MACD turning bullish
- DMI turning bullish
- StochRSI, bullish, crossed
=========
Conclusion
=========
- short to long term breakout swing
- price may reverse at current level, to enter spot or wait for pullback at entry 2.
=========
Positions
=========
Entry 1 - $167
Entry 2 - $160
Stop - $150
Exit 1 - $184
Exit 2 - $200
Exit 3 - $212
Exit 4 - $225
Exit 5 - $250
QCOM: Exploring Potential 30% Upside in AI Chip ContenderQCOM: Exploring Potential 30% Upside in AI Chip Contender Amid Data Center Expansion – SWOT and Intrinsic Value Insights
📊 Introduction
As of October 28, 2025, QUALCOMM Incorporated (QCOM) is experiencing post-announcement volatility following an 11% surge in the prior session, trading around $185 in pre-market after closing at $187.68. This movement stems from the launch of new AI accelerator chips aimed at competing in data centers, amid a broader tech rally driven by $500B in projected AI infrastructure spending and Fed rate stability at 4.75%. Sector dynamics reflect intensified competition in semiconductors, with NVIDIA and AMD also advancing, though macroeconomic factors like easing U.S.-China trade talks support chip demand, countered by ongoing export restrictions and supply chain inflation.
🔍 SWOT Analysis
**Strengths 💪**: Qualcomm holds a commanding position in mobile chipsets with over 40% market share, bolstered by TTM revenue of $43.26B and net income of $11.57B. Robust financials include a 44.62% return on equity and quarterly revenue growth of 10.30% yoy, driven by diversified segments like automotive (up 20% yoy). Low beta of 1.23 indicates relative stability, with partnerships in 5G and IoT enhancing ecosystem strength.
**Weaknesses ⚠️**: Debt-to-equity at 54.35% signals moderate leverage, potentially vulnerable in high-interest environments. Dependence on China for ~60% of revenue exposes risks from geopolitical tensions, while R&D costs (22% of revenue) could strain margins if AI adoption slows. Historical patent disputes add to operational challenges.
**Opportunities 🌟**: The AI data center push, with new chips targeting inference markets, aligns with a $200B+ opportunity by 2027, per industry forecasts. Growth in edge AI and automotive semiconductors, backed by analyst EPS projections rising to $12.10 for 2026, supports valuation re-rating. Expansion into PCs and servers via Snapdragon platforms could capture 15-20% share from Intel.
**Threats 🚩**: Fierce competition from NVIDIA's Blackwell and AMD's MI series threatens market erosion, with potential antitrust probes in the EU. Regulatory hurdles, such as U.S. export bans impacting 15-20% of sales, and broader sector volatility from tariff risks pose downside. Economic slowdowns may defer enterprise capex.
💰 Intrinsic Value Calculation
Applying a value investing method for tech stocks, we calculate intrinsic value using a weighted blend of book value and earnings multiples, with a 20% margin of safety for cyclical risks. Inputs from filings: Book value per share $25.10, TTM EPS $10.36, assumed growth rate 10% (blending current 16.37% and next-year 1.71% projections).
Formula: Intrinsic Value = (Book Value per Share * Weight) + (EPS * Growth Multiplier)
- Weight for book value: 0.3 (asset-intensive adjustments)
- Growth Multiplier: 28.5 (Graham-inspired: 8.5 + 2*10)
Calculation:
(25.10 * 0.3) + (10.36 * 28.5) = 7.53 + 295.26 = 302.79
Apply 20% margin of safety: 302.79 * 0.8 ≈ $242.23
At current price ~$185, QCOM appears undervalued by ~24-31% (upside to $242 fair value, aligned with forward P/E of 13.95 and comparables). Debt flags are minor at 54%, with sustainability tied to EPS growth above 10%. 📈 Undervalued.
📈 Entry Strategy Insights
Institutional methods target support zones near $180-182 (near 50-day SMA) for unleveraged, long-term entries using dollar-cost averaging (DCA). Scale in on 4-7% dips, employing non-repainting volume-based signals to verify momentum shifts. Effective for 10-15% position accumulation over 2-4 months, with breakout targets above $190 for phased exits. 🚀 Spot zones.
⚠️ Risk Management
Restrict sizing to 1-5% of portfolio to handle sector swings, diversifying across tech subsectors and defensives. Use trailing stops 7-10% below entry (e.g., $170) and favor long-term holds if ROE sustains, monitoring earnings reports and trade policy. Caution on 10-20% drawdowns from competitive news.
🔚 Conclusion
Qualcomm's AI diversification, solid fundamentals, and undervalued profile amid tech momentum indicate potential to $242+, with safety buffers. Key takeaways: Track AI adoption for earnings uplift, independently validate growth estimates.
This is educational content only; not financial advice. Always conduct your own due diligence.
Qualcomm new AI chips*Qualcomm made new AI chips called AI200 and AI250:
- After this news, Qualcomm’s stock price went up by 12%.
- These chips help Qualcomm join the AI data center market and compete with big companies like Nvidia.
- Qualcomm’s profits are strong, and it is managing costs well.
- The company got its first customer, called HUMAIN, for these AI products.
- Experts think Qualcomm has good future potential, even if some numbers are mixed.
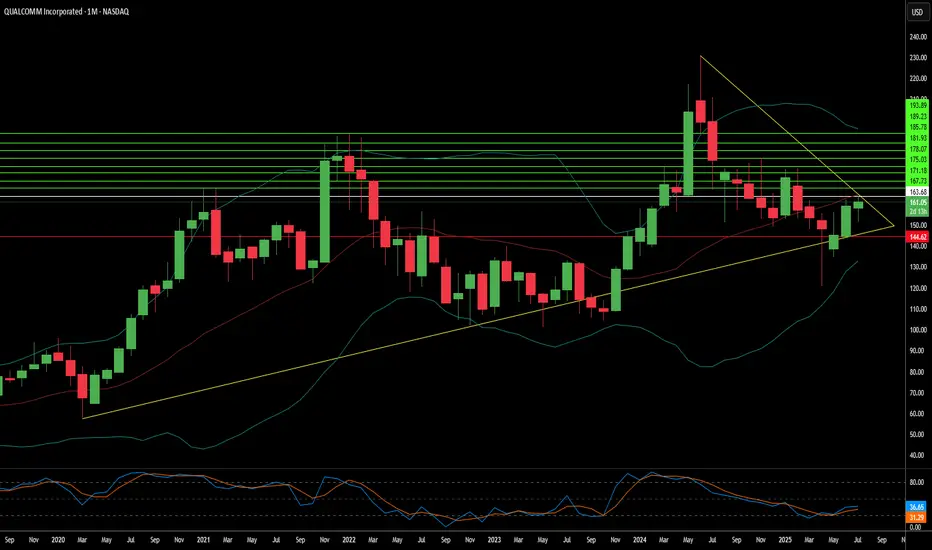
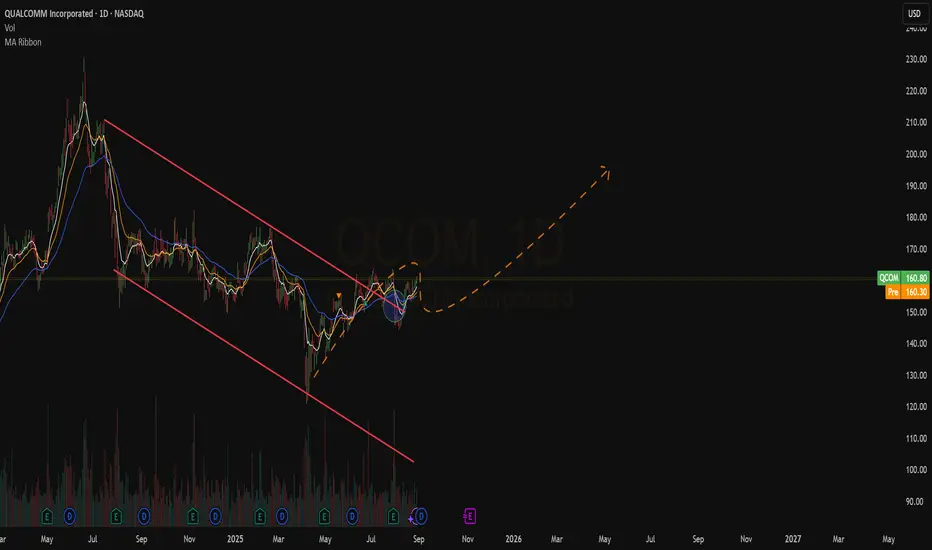
And technically
We are around the middle of a long-term channel
and regarding the mid-term chart,
We have 3 great zones to enter the market,
both for investing and trading

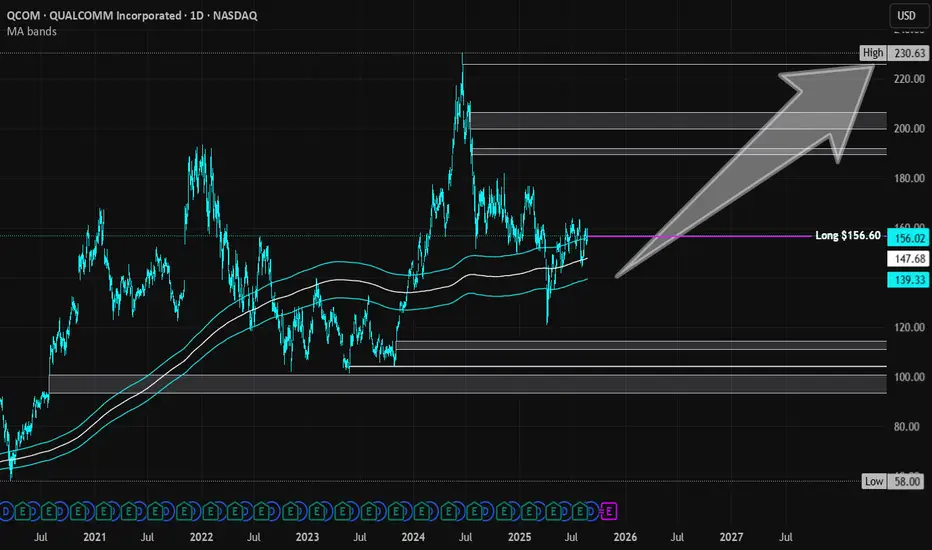
Qualcomm Inc | QCOM | Long at $156.60Qualcomm NASDAQ:QCOM is a global leader in wireless technology, focusing on 5G chipsets, AI-capable Snapdragon processors, and connectivity solutions for smartphones, IoT, and automotive. Revenue through 3 quarters of 2025 is ~$40B. Revenue growth is anticipated to be 10-12%, year over year (2026: ~$45B; 2027: ~$50B; 2028: ~$56B). 5G adoption, AI chip demand, and automotive needs should continue to drive the stock price. Earnings per share are projected to grow 12-14%, year over year (2026: ~$11.20; 2027: ~$12.80; 2028: ~$14.70). Thus, the future looks quite bright for NASDAQ:QCOM .
Regarding price, it is currently trading at a PE of 15x and has a 2.25% dividend. The price is resting just above my historical simple moving average channel. I do anticipate it to drop into the channel (down in the high $130's-$140's) in the near-term due to typical September selloffs. However, I plan on adding more in the zone. A major bear case would be a major drop into the $90's to fill the price gaps on the daily chart before moving higher. I do not think this will happen unless a major catalyst in the market emerges - but always be prepared. Regardless, it is a strong company providing products and services that are in high demand. Currently fairly valued, I believe it become undervalued as the demand for 5G and new phone chips with AI capabilities emerges.
Thus, at $156.60, NASDAQ:QCOM is in a personal buy zone with a likely near-term drop into the $130's and $140's.
Targets into 2028:
$191.00 (+22.0%)
$225.00 (+43.7%)
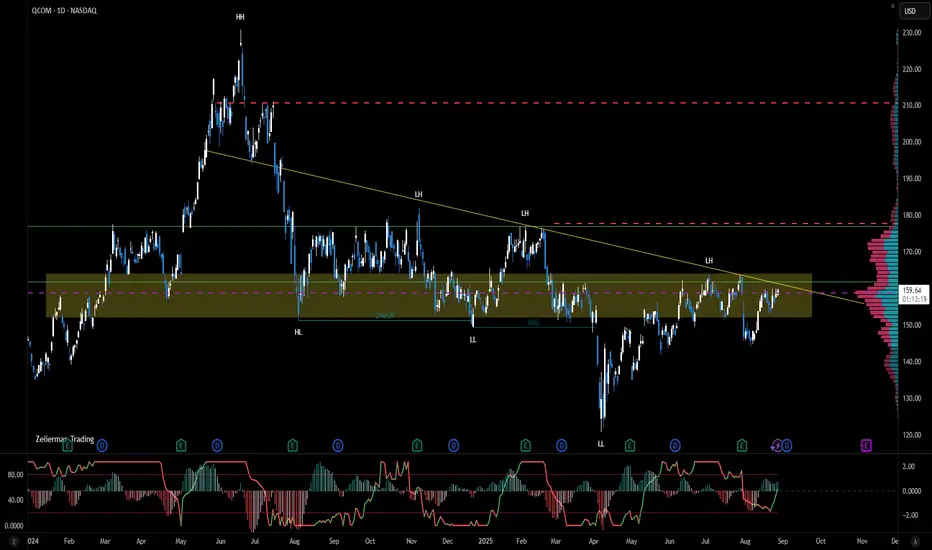
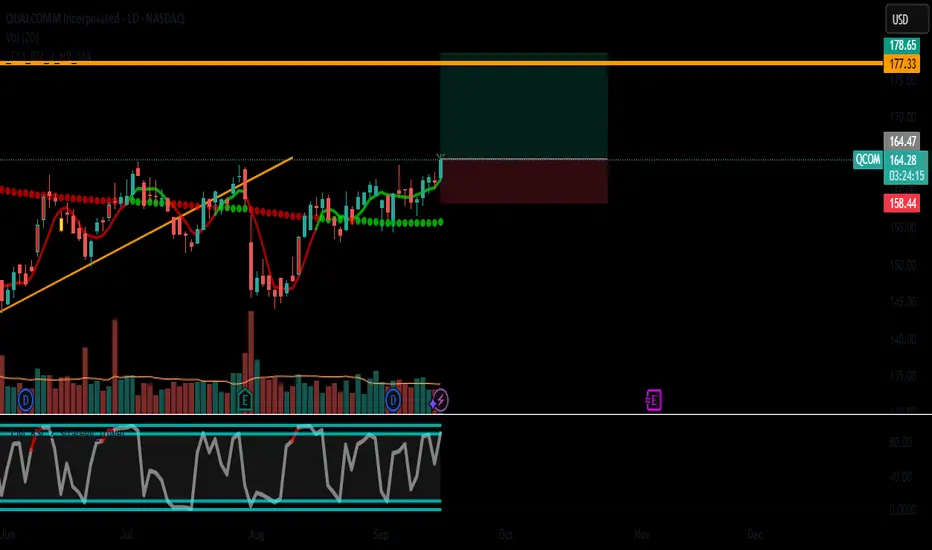
QCOM LongThe broader market structure on Qualcomm (QCOM) remains bearish, as confirmed by the Break of Structure (BOS) at 162.24, following a prior Lower High (LH) at 171.97. This sequence of lower highs and lower lows defines a clear downtrend. The most recent BOS confirms continuation of bearish order flow, suggesting sellers are still in control after failing to maintain any sustained bullish momentum.
The demand zone around 163.00–162.20 has acted as a short-term base where buyers have recently stepped in with moderate strength, halting the decline and producing a minor reaction. This zone has not been deeply mitigated before, which makes it relatively fresh and potentially capable of producing a corrective bounce. On the other hand, the overhead supply zone between 166.80–167.40 remains structurally strong. Price previously dropped sharply from this area after a small accumulation, showing clear sell-side aggression.
Currently, price action near the marked region suggests early signs of absorption, with rejection wicks forming above minor candle bodies—indicating the presence of both profit-taking from shorts and some early buying interest. A retracement into the 165.50–166.00 region is probable before sellers re-enter from the nearby supply. This aligns with the projected short-term path on your chart, implying a bullish correction within a broader bearish structure.
The trade bias is short-term bullish, targeting the 166.00 zone for a reaction, while maintaining a bearish higher-timeframe bias. The outlook would be invalidated if price breaks below 162.20, as that would confirm fresh weakness and continuation toward 160.50 demand. Momentum still favors sellers overall, but the slowing descent and emerging higher lows suggest short-term recovery potential.

QCOM, at the all time price action area.QCOM is tring to find its way on the all time price action and volume area. With the break out of trend , expecting first and strong resistance, liquidation area 177, then 210. * Not for trading advice *
QCOM - Qualcomm broke previous High - Short Term 180 ?Hello Everyone,
Have a lovelly Weekend to all and hope you started a Weekend happy :))
Today i will try to make some new analysis and update my previous analysis as Quantum Stocks that i trust quite well , after my analysis go over %50 (Most of them) ;)))
Ok now Qualcomm , i do not want to write about it what they do etc. as everbody know what they do and probably no need to share financial informations.
Technical Part from my side:
On Wednesday it was broken the previous high level and on Firday it was closed in 166.85 which is near this level (166.50) . And if you have a look the Volume on Friday in chart you will see the pik , which is a good indicator for me to get support now from this level.
My expectation is , it will soon hit to 180 which is %8.5 over from today's price level.
2 Possible way to reach 180.
First one is go back to 163 then go up. If it will decide to do this then 163 would be perfect level to get.
Second one is continue to go up and hit 180.
It should not break the 163 , if so then this analysis is not valid anymore.
My final target is 194 - 195
I have already added QCOM to my watch list for next week.
This is just my thinking and it is not invesment suggestion , please do not make any decision with my anaylsis.
Have a lovely Weekend to all.

QCOM (Qualcomm Inc) - Long SetupTrading Idea: NASDAQ:QCOM (Qualcomm Inc) - Long Setup
🎯 Idea: LONG
⏰ Timeframe: Daily
📊 Pattern: Bullish Continuation in Established Uptrend
Fundamental Context:
Fundamental Score: 5/9 (Neutral).
Catalyst: Leader in 5G, IoT, and Automotive semiconductors.
Growth: Moderate Revenue + Strong Net Income Growth YoY.
Balance Sheet: Good (Debt Score: 9/10). Strong interest coverage.
Valuation: Fairly Valued on P/E; Overvalued on P/B and P/S.
Technical Setup:
Trend (D1): Bullish ✅
Entry: $164.27 (Pullback to dynamic support & confluence zone).
Stop Loss (SL): $158.40 (Below key support and the 20/50-period SMA confluence).
Take Profit (TP): $178.70 (Projected resistance target from measured move).
Momentum: MACD above signal line, RSI in healthy bullish range.
Risk Management:
Risk/Reward (R:R): 1:2.4
Position size accordingly.
Summary: Buying the pullback in a strong uptrend for a leader in essential connectivity technologies, targeting a run toward the next resistance level.
⚠️ Disclaimer: Not Financial Advice
This analysis is for educational and informational purposes only. It is NOT a recommendation to buy or sell any security.
Conduct your own research (DYOR) before making any investment decisions.
You are solely responsible for your own trades and investments.
Past performance is never indicative of future results.
Trading involves significant risk of loss and is not suitable for all investors.
#TradingView #QCOM #Long #Semiconductors #5G #IoT #Chips #Technology #TradingSetup
QCOM | Consolidation Almost Done | LONGQUALCOMM, Inc. engages in developing and commercializing foundational technologies and products used in mobile devices and other wireless products. It operates through the following segments: Qualcomm CDMA Technologies (QCT), Qualcomm Technology Licensing (QTL), and Qualcomm Strategic Initiatives (QSI). The QCT segment develops and supplies integrated circuits and system software based on technologies for use in voice and data communications, networking, application processing, multimedia, and global positioning system products. The QTL segment grants licenses and provides rights to use portions of the firm's intellectual property portfolio. The QSI segment focuses on opening new or expanding opportunities for its technologies and supporting the design and introduction of new products and services for voice and data communications. The company was founded by Franklin P. Antonio, Adelia A. Coffman, Andrew Cohen, Klein Gilhousen, Irwin Mark Jacobs, Andrew J. Viterbi, and Harvey P. White in July 1985 and is headquartered in San Diego, CA.

QCOM ShortOn QCOM (15m), the broader market structure is showing early signs of potential reversal. Price previously made a BOS at 164.48, confirming the prior bullish trend had reached its peak. Following that, a CHoCH occurred at 153.76, establishing a lower low and signaling that sellers may be taking control. This shift in structure suggests a possible transition from bullish to bearish conditions if price fails to reclaim previous highs.
The supply zone between 162.00–164.00 remains strong, as price previously dropped aggressively from this area, showing that sellers were active and defending it. Demand is layered between 158.00–159.50, where buyers stepped in with strength earlier, causing the recent rally back into supply. The deeper demand zone near 153.50–152.50 is significant and could be a final downside target if sellers maintain momentum.
Currently, price is pushing into the overhead supply zone with strong bullish candles, but it is approaching a level where sellers previously dominated. If price shows signs of exhaustion or rejection here (e.g., wicks, bearish engulfing), the likely move is a sharp selloff back toward 158.00, with the potential to break through and target the 153.50 demand zone.
The trade bias is bearish, expecting rejection from the current supply zone and continuation lower. The key invalidation level is a clean break and close above 164.50, which would signal that buyers have regained control and could push for a new high. Momentum has been favoring buyers in the short term, but this appears to be a corrective move into supply within a shifting market structure

facts converge for a sell idea : narrative and confluences 1->4: the number 3->4 swing make number
1 a solid major high as it pushed below number
2 buyers proving selling dominance in local
scope, it also served to break previous structure
presenting another confirmation of a
potential sell
what next ?
* 1->2 was half the strength of 3->4 ,
logically we can only assume sellers
are getting stronger, either via more sellers
or buyers losing interest for whatever reason
* obv trendline break shows sellers interest
increasing
* hidden bear on rsi and mfi + overbought on both

New Setup : QCOMDespite the most recent ATR Bearish Alert, There is a big chance to see the price higher soon.
We just need a confirmation after the most recent fake breakout.
Rising Lows already recorded.
Ready To Catch It !
QCOMPossible trade setup opportunity in QCOM based on:
1-Price action
2-Volumen action
3-Moving averages and momentum
4-General market conditions

Qualcomm Stair-Steps LowerQualcomm has struggled all year, and some traders may see further downside risk in the chip stock.
The first pattern on today’s chart is the March high of $161.82. Prices have remained below that level since — even as the broader market climbed to new record highs. That may reflect a lack of buying interest.
Second is the pair of downward gaps after the last two earnings reports. Those may reflect weakening sentiment.
Third, QCOM tried to rebound after the second release but stalled at its July 30 close (immediately before earnings). Will it become a lower high?
Next, the 100-day simple moving average (SMA) is below the 200-day SMA. That may be consistent with longer-term weakness.
Finally, stochastics have been rebounding and are near levels where the oscillator has recently peaked. Traders may watch it for signs of prices turning lower.
TradeStation has, for decades, advanced the trading industry, providing access to stocks, options and futures. If you're born to trade, we could be for you. See our Overview for more.
Past performance, whether actual or indicated by historical tests of strategies, is no guarantee of future performance or success. There is a possibility that you may sustain a loss equal to or greater than your entire investment regardless of which asset class you trade (equities, options or futures); therefore, you should not invest or risk money that you cannot afford to lose. Online trading is not suitable for all investors. View the document titled Characteristics and Risks of Standardized Options at www.TradeStation.com . Before trading any asset class, customers must read the relevant risk disclosure statements on www.TradeStation.com . System access and trade placement and execution may be delayed or fail due to market volatility and volume, quote delays, system and software errors, Internet traffic, outages and other factors.
Securities and futures trading is offered to self-directed customers by TradeStation Securities, Inc., a broker-dealer registered with the Securities and Exchange Commission and a futures commission merchant licensed with the Commodity Futures Trading Commission). TradeStation Securities is a member of the Financial Industry Regulatory Authority, the National Futures Association, and a number of exchanges.
TradeStation Securities, Inc. and TradeStation Technologies, Inc. are each wholly owned subsidiaries of TradeStation Group, Inc., both operating, and providing products and services, under the TradeStation brand and trademark. When applying for, or purchasing, accounts, subscriptions, products and services, it is important that you know which company you will be dealing with. Visit www.TradeStation.com for further important information explaining what this means.

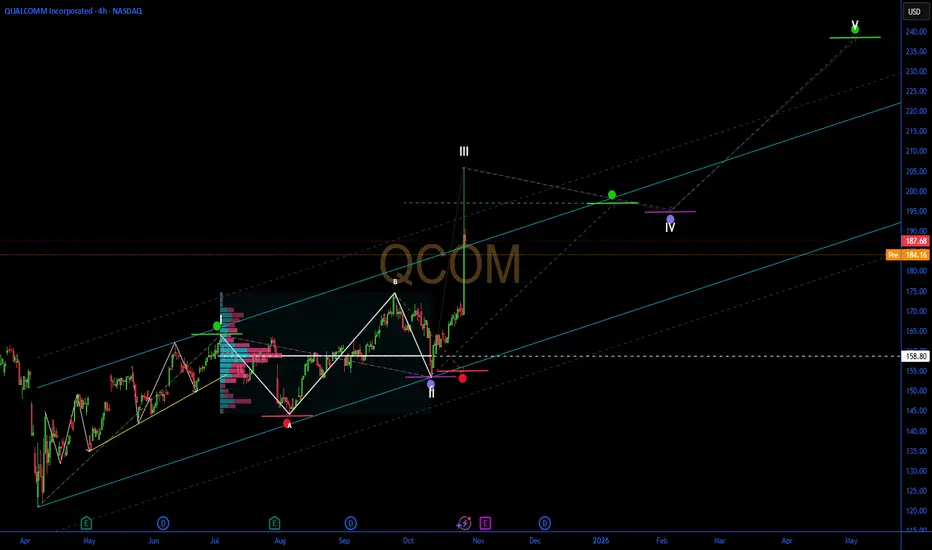
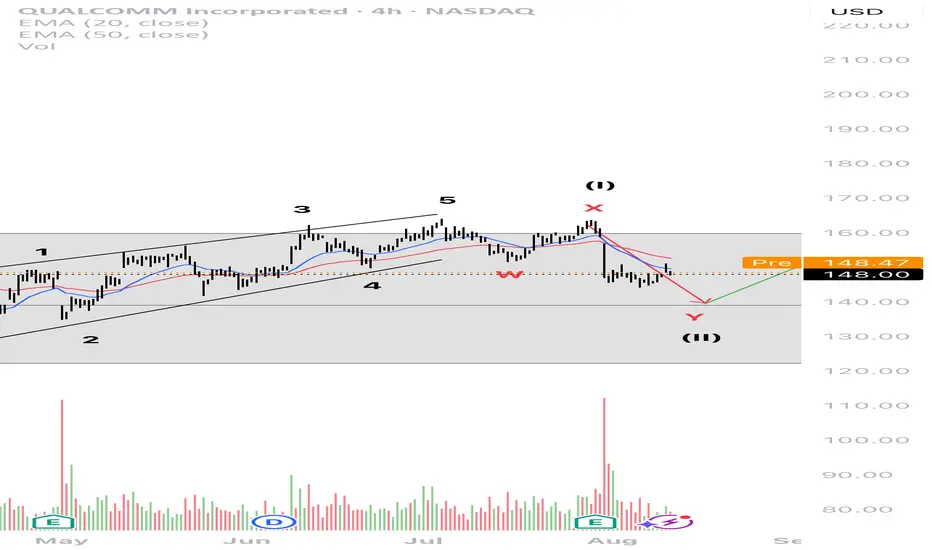
QCOM 4H#QCOM 4H
- I expect another shorter and milder Wave 2 correction in the form of a WXY, after which I anticipate a larger Wave 3 with a possible extension. I will provide an update on Wave 3 once the bottom of Wave 2 is formed. Stay tuned.
Qualcomm: Beyond the Smartphone Storm?Qualcomm (NASDAQ:QCOM) navigates a dynamic landscape, demonstrating resilience despite smartphone market headwinds and geopolitical complexities. Bernstein SocGen Group recently reaffirmed its "Outperform" rating, setting a \$185.00 price target. This confidence stems from Qualcomm's robust financials, including a 16% revenue growth over the last year and strong liquidity. While concerns persist regarding potential Section 232 tariffs and Apple's diminishing contribution, the company's strategic diversification into high-growth "adjacency" markets like automotive and IoT promises significant value. Qualcomm currently trades at a substantial discount compared to the S&P 500 and the Philadelphia Semiconductor Index (SOX), signaling an attractive entry point for discerning investors.
Qualcomm's technological prowess underpins its long-term growth narrative, extending far beyond its core wireless chipmaking. The company aggressively pushes **on-device AI**, leveraging its Qualcomm AI Engine to enable power-efficient, private, and low-latency AI applications across various devices. Its Snapdragon platforms power advanced features in smartphones, PCs, and the burgeoning **automotive sector** with the Snapdragon Digital Chassis. Further expanding its reach, Qualcomm's recent acquisition of Alphawave IP Group PLC targets the data center market, enhancing its AI capabilities and high-speed connectivity solutions. These strategic moves position Qualcomm at the forefront of the **high-tech revolution**, capitalizing on the pervasive demand for intelligent and connected experiences.
The company's extensive **patent portfolio**, encompassing over 160,000 patents, forms a critical competitive moat. Qualcomm's lucrative Standard Essential Patent (SEP) licensing program generates substantial revenue and solidifies its influence across global wireless standards, from 3G to 5G and beyond. This intellectual property leadership, combined with a calculated pivot away from its historical reliance on a single major customer like Apple, empowers Qualcomm to pursue new revenue streams. By aiming for a 50/50 split between mobile and non-mobile revenues by 2029, Qualcomm strategically mitigates market risks and secures its position as a diversified technology powerhouse. This assertive expansion, alongside its commitment to dividends, underscores a confident long-term outlook for the semiconductor giant.