QCOM: Week of Dec 18Looking at QCOM is very important because it has just been straight up.
Semi's such as NVDA, AMD and QCOM are what is propping tech. While SPY had a bearish day on Friday, the continued upside pressure from QCOM, AMD and NVDA salvaged QQQ and its important to pay attention to the strong performers right now if you are an NQ1! or QQQ trader (just generally a NASDAQ trader).
Despite QCOM going straight up, if we look at the breakdown of where it is in relation to Standard Deviation and where the volume accumulation rests, continued upside is actually the expectation here:
We may see some pullback but watch those conditions.
Bias is bullish overall.
Not advice, blah blah blah.
Trade ideas


$QCOM: 130 Is Decently StrongQualcomm is showing some incredible resilience off the lows and I'm curious to see if it could lead the semi sector on a potential move up. Were going to look to see if bulls can bid up this area.

QUALCOMM $QCOM Trade IdeaYesterday I entered the NASDAQ:QCOM trade as the price closed above the long term diagonal resistance zone.
I have several short term and medium term timeframe positions on $QCOM.
In the short term the price will likely encounter resistance at the $133 level, if we break that we can see $140.
The price is overbought as the oscillators show, so I will likely exit at the first target ($133) and then re-enter if the stock breaks out further or pulls back to the S/R flip zone.
I am a bit vary of going long on some of the semi conductors for medium term as the charts look fairly extended across that sector, however I am looking for this as short term profits.
The MA's are all sloping up, which shows a short term bullish momentum in price.
Hope this helps the readers, follow me for more trade ideas.
Thank you,
BK

Qualcomm Here are some specific examples of companies that use Qualcomm products:
1. Samsung uses Qualcomm's Snapdragon processors in its Galaxy line of smartphones, including the Galaxy S22, Galaxy Z Flip 4, and Galaxy Z Fold 4.
2. Apple uses Qualcomm's Snapdragon X50 modem in its iPhone 14 lineup.
3. Google uses Qualcomm's Snapdragon 8 Gen 1 processor in its Pixel 6 and Pixel 6 Pro smartphones.
4. LG uses Qualcomm's Snapdragon 888 processor in its Wing smartphone.
5. Huawei uses Qualcomm's Snapdragon 8 Gen 1 processor in its Mate 40 Pro smartphone.
6. Xiaomi uses Qualcomm's Snapdragon 8 Gen 1 processor in its Mi 11 Ultra smartphone.
7. OPPO uses Qualcomm's Snapdragon 8 Gen 1 processor in its Find X5 Pro smartphone.
8. vivo uses Qualcomm's Snapdragon 8 Gen 1 processor in its X80 Pro smartphone.
9. Dell uses Qualcomm's Snapdragon 8cx processor in its Latitude 9320 Chromebook.
10. HP uses Qualcomm's Snapdragon 8cx processor in its Elite x2 G8 tablet.
11. Lenovo uses Qualcomm's Snapdragon 8cx processor in its ThinkPad X12 Detachable tablet.
12. Acer uses Qualcomm's Snapdragon 8cx processor in its Chromebook Spin 713.
13. Asus uses Qualcomm's Snapdragon 8cx processor in its Chromebook Flip CX5.
14. Apple uses Qualcomm's W2 chip in its AirPods Pro wireless earbuds.
15. Sony uses Qualcomm's Q1N chip in its WF-1000XM4 wireless earbuds.
16. Bose uses Qualcomm's Q1N chip in its QuietComfort Earbuds wireless earbuds.
17. Jabra uses Qualcomm's Q1N chip in its Elite 75t wireless earbuds.
18. Skullcandy uses Qualcomm's Q1N chip in its Dime True Wireless Earbuds
Just to name a few. This is to show the scale at which Qualcomm is in tech products we use daily but we have no idea of.
Worth being in our portfolio.

down the hill we goour most kind printing machine that hates seeing us broke. will be adding to my sells monday open buddies.

New support at 100 plusNew support at 100 plus. Accumulation gr8 idea. 100 to 110 consolidation before breakout possible.

$QCOM - Can it break above 200 DMA?NASDAQ:QCOM Looks like it is breaking out of the triangle and hit the 200-Day Moving Average.
I broke above POC resistance with Big volume.
Upside targets:
$120
$124
$128
$140
Downside risk:
$110
It should be noted that the lower gap could fill full or partially before the stock can move up.
Trying to breakout in AMNASDAQ:QCOM is trying to beak the triangle with a break in afterhours after earnings release. Could start a new bullish trend here.

Qualcomm Invests Further In Mobile AI With Chip Qualcomm (QCOM) rolled out a number of key AI announcements today, as the company seeks to cement itself as a major player in mobile chips.
Those announcements include a new compute platform, called Snapdragon X Elite; a new central processing unit chip, called the Qualcomm Oryon CPU; and a new smartphone chip, named the Snapdragon 8 Gen 3.
Though Qualcomm makes chips, it doesn't produce the sought-after GPUs that have become standard for training AI models. That field is dominated by Nvidia (NVDA), though players like Intel (INTC) and AMD (AMD) are racing to catch up amid the GPU shortage.
Qualcomm, throughout the AI boom, has sought to carve out a niche that's linked to mobile and about increasing efficiency. The Snapdragon 8 Gen 3, Qualcomm's mobile platform for Android smartphones, was designed to emphasize generative AI — for example, offering the ability to run large language models, like Meta's (META) Llama 2.
The chip will begin appearing in major Android devices over the next few weeks, and will also bring enhanced gaming and audio features.
The company's Snapdragon X Elite compute platform is designed to give Windows computers an AI boost. Devices with Snapdragon X Elite aren't set to launch until the middle of 2024 — but the platform will feature a new chip that Qualcomm is expected to emphasize moving forward, the Qualcomm Oryon CPU.
According to Qualcomm, the Oryon CPU is faster than Arm-based (ARM) competitors, a group that includes Alphabet's Google (GOOG, GOOGL), Samsung, and TSMC. The chip purportedly matches the peak performances of both Apple's (AAPL) M2 chip and Intel's 13980Hx, with less power.
The product is an implicit shot at AMD and a multilayered stab at Intel, both of which use Arm intellectual property in some of their chips.
Despite the hype around semiconductors, Qualcomm shares have underperformed the S&P 500 this year. The company is wrestling with slowing smartphone sales and an increasingly competitive landscape.
2
QCOM
-3.52%
INTC
-4.15%
AMD
-4.43%
AAPL
-1.06%
Qualcomm unveils new PC and smartphone chips focused on AIScroll back up to restore default view.
Alexandra Garfinkle
Alexandra Garfinkle·Senior Reporter
Tue, October 24, 2023 at 10:11 PM GMT+1·3 min read
In this article:
QCOM
-3.57%
Watchlist
Watchlist
Performance Outlookyahoo plus badge
2W-6W
6W-9M
9M+
INTC
-4.26%
AMD
-4.55%
AAPL
-1.12%
Qualcomm (QCOM) rolled out a number of key AI announcements today, as the company seeks to cement itself as a major player in mobile chips.
Those announcements include a new compute platform, called Snapdragon X Elite; a new central processing unit chip, called the Qualcomm Oryon CPU; and a new smartphone chip, named the Snapdragon 8 Gen 3.
Though Qualcomm makes chips, it doesn't produce the sought-after GPUs that have become standard for training AI models. That field is dominated by Nvidia (NVDA), though players like Intel (INTC) and AMD (AMD) are racing to catch up amid the GPU shortage.
Qualcomm, throughout the AI boom, has sought to carve out a niche that's linked to mobile and about increasing efficiency. The Snapdragon 8 Gen 3, Qualcomm's mobile platform for Android smartphones, was designed to emphasize generative AI — for example, offering the ability to run large language models, like Meta's (META) Llama 2.
An photo provided by Qualcomm.
(Qualcomm)
The chip will begin appearing in major Android devices over the next few weeks, and will also bring enhanced gaming and audio features.
The company's Snapdragon X Elite compute platform is designed to give Windows computers an AI boost. Devices with Snapdragon X Elite aren't set to launch until the middle of 2024 — but the platform will feature a new chip that Qualcomm is expected to emphasize moving forward, the Qualcomm Oryon CPU.
According to Qualcomm, the Oryon CPU is faster than Arm-based (ARM) competitors, a group that includes Alphabet's Google (GOOG, GOOGL), Samsung, and TSMC. The chip purportedly matches the peak performances of both Apple's (AAPL) M2 chip and Intel's 13980Hx, with less power.
The product is an implicit shot at AMD and a multilayered stab at Intel, both of which use Arm intellectual property in some of their chips.
Despite the hype around semiconductors, Qualcomm shares have underperformed the S&P 500 this year. The company is wrestling with slowing smartphone sales and an increasingly competitive landscape.
"Near term, demand for handsets remains extremely depressed amid a severe channel inventory drawdown while orders from China Android manufacturers have yet to snap back," wrote CFRA analyst Angelo Zino, who rates the stock a Hold. "Although we like Qualcomm's potential to diversify over time, we are wary of its position given structural share loss across the Android ecosystem."
Qualcomm's partnership with Apple is also vital to its near-term prospects — and fragile, as Apple has chipmaking ambitions of its own. In September, Qualcomm and Apple re-upped an iPhone deal that sent Qualcomm's shares surging.
"The deal marks a second time that Apple has had to strike a multiyear contract to source thin modems from Qualcomm, in a contractual relationship that Apple sees as unfair but necessary," Argus Research director Jim Kelleher wrote in September. "For Qualcomm, the agreement locks up a key high-volume customer at a time when financial pressures and modest gains in smartphone function and efficiency are limiting demand for new phones."

SYMMETRICAL TRIANGLEEarnings estimated to be on 11-1.
Symmetrical Triangles are neutral until broken.
Support level below triangle with 3 touches. The more touches a support or resistance level has, the stronger the level becomes.
No recommendation

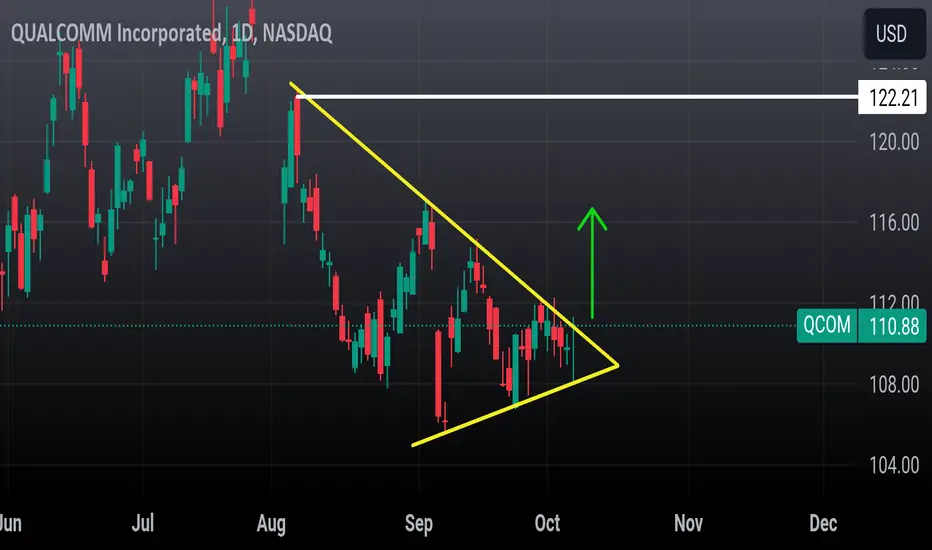
Qcom pennantPennant that could take us back to 122 gap resistance.
I like calls above 111$
110.00$ stop loss
1st target 116
2nd target 122
QCOM intraday outlookJust posting to look at later. Macro trend is bearish. Looking to see if price will continue this short minor pullback as depicted by the arrow. I think we will if we stay within the green range.

QCOM Continuation Play [PUTS]Here is a strong down trend proceeding a channel break to the downside. An Inside Bar/3 Bar Play has formed on the 4h at close giving an opportunity for entry below the low of the inside candle. Can expect (but not guarantee) another leg down to follow up the current consolidation to possible test and or fill the gap below.

QUALCOMM could make a hard turn?NASDAQ:QCOM Price may potentially undergo a significant reversal, particularly upon reaching the key demand area that has witnessed multiple retests in the past. It's a straightforward interplay of demand and supply dynamics.


Calls ideaJust bought some calls:
Exp 09/01
Strike 111
Price is accumulation just above a strong pivot point. If history repeats, it could make a nice bounce up.

($QCOM) Qualcomm: Hanging Cliffside...QCOMM chips will be highly implemented into the newest iPhone 15, they are the largest US chip company with exposure to china, and earnings/revenue are forecasted for continued growth into Q3 2024, so whats the problem?
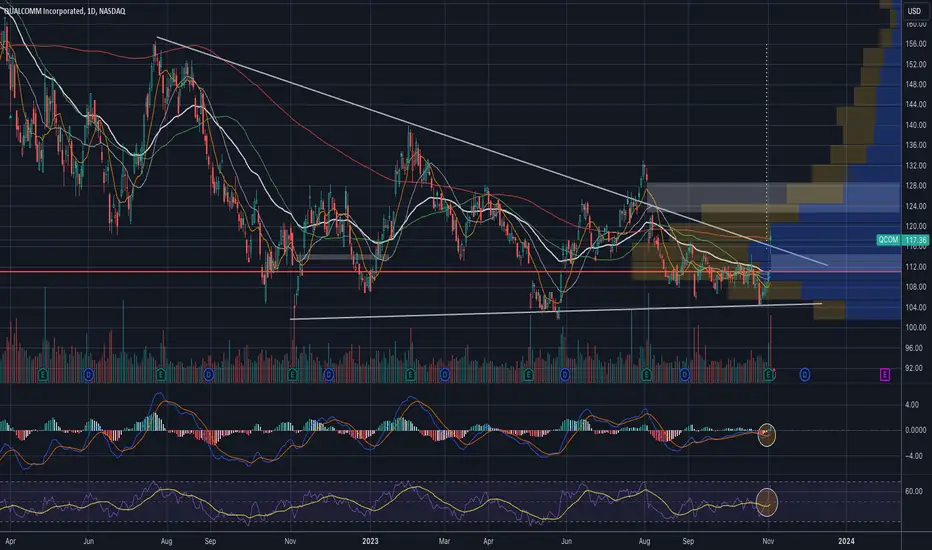
Since March of 2022, Qualcomm's weekly 50 simple moving average had turned from support, to resistance. When the 50SMA of QCOMM had become resistance, it had been retested 3 times with most recently this past July. Each time, we had seen continuing lower highs, and a final base low in late October 2022 creating a demand zone between $101.50 - $107.
After the most recent rejection of the weekly 50SMA back in January 2023, our demand zone cemented itself as of May 2023.
With the demand zone of $101.50 - $107 now having been tested twice as our weekly demand zone, there was an expectancy of yet another retest of the 50SMA... That time has just recently passed this past July.
Now that the 50SMA had been rejected yet again, followed by current price sitting at the volume point of control (dotted white line), there looks to be an imminent retest back to our demand zone.
In addition to these technical indicators, there are a few fundamental and economical challenges ahead. China is on the borderline of deflation, there is a massive global credit bubble, and the Biden administration is currently in an unofficial trade war with China on chips by limiting exports of chips to china constraining global sales. Not to mention the fact that NVDA is at a 40x price-sales ratio, Qualcomm may get caught in the crossfire of these looming factors.

QCOMM Long EntryThis is at a huge discount. Buy and hold. Calls will print as well.
Use a stoploss please or average down. Thanks.

Bearish Alert : QCOMGreat Bearish action on top of this wave.
A healthy pullback should start soon.
Possible trigger below $129

Earnings watch 8/2/23 post-marketEarnings watch 8/2/23 post-market:
Here's a quarterly view 24hr ext comparison chart with the tickerTracker MFI Oscillator.
QCOM
PYPL
SHOP
OXY
U
HOOD
MELI
ET
ETSY
APA

Breakout and Go Up to 150Qualcomm NASDAQ:QCOM has broken out the descending trend line acts the resistance
QCOM might go up to 140 further 150
Wait for a retest to join the AI's race

