The Impact of Multinational Corporations (MNCs) on Global Trade1. Understanding Multinational Corporations
A multinational corporation (MNC) is a company that manages production or delivers services in more than one country. The defining features of MNCs include:
Global presence – Operations span multiple countries through subsidiaries, branches, or joint ventures.
Centralized control – Strategic decisions are made at the headquarters while local operations adapt to regional markets.
Large capital base – MNCs often possess vast financial resources that enable them to invest globally.
Technology and innovation leadership – Many MNCs are at the forefront of research and development (R&D), driving global innovation.
Examples include Apple, Microsoft, Toyota, Nestlé, Samsung, and Procter & Gamble, each influencing production, consumption, and trade across continents.
2. MNCs as Catalysts for Global Trade Expansion
MNCs are the engines of globalization. Their global operations facilitate the movement of goods, services, technology, and capital across borders. They act as bridges connecting developed and developing economies through trade networks, investment flows, and knowledge exchange.
a) Expansion of International Markets
MNCs expand their production and distribution networks into multiple countries to reach broader markets. For instance, Coca-Cola and McDonald’s have established a presence in over 100 countries, adapting products to local tastes but maintaining global brand consistency. This expansion boosts cross-border trade in goods and services.
b) Integration of Global Supply Chains
One of the most transformative impacts of MNCs is the creation of global value chains (GVCs)—complex networks of production that span multiple countries. A single product, such as an iPhone, might have components made in Japan, software from the U.S., assembly in China, and distribution worldwide. This interlinked production structure increases trade in intermediate goods and services and enhances efficiency through specialization.
c) Promotion of Foreign Direct Investment (FDI)
MNCs are the largest source of foreign direct investment, which directly influences global trade. By setting up subsidiaries, factories, or service centers in other countries, MNCs create trade linkages. FDI often complements trade by building local production for exports or substituting imports with local production.
3. MNCs and Economic Development
a) Technology Transfer
MNCs play a key role in transferring technology and managerial know-how to host countries. Developing economies benefit from modern production techniques, quality control, and innovative management practices. For example, when an automobile giant like Toyota establishes a plant in India, it not only creates jobs but also transfers skills and introduces advanced manufacturing technologies.
b) Employment Generation
MNCs generate employment both directly and indirectly. They hire local workers, utilize domestic suppliers, and stimulate service industries such as logistics, finance, and telecommunications. For developing countries, this employment generation can lead to skill enhancement and income growth.
c) Enhancing Export Capabilities
Many MNCs establish export-oriented industries in developing countries due to lower labor costs. This enhances the export potential of the host country, improves trade balances, and promotes industrial diversification. Countries like Vietnam, Mexico, and Bangladesh have benefited significantly from MNC-led export growth in sectors like textiles and electronics.
4. The Strategic Role of MNCs in Global Trade Patterns
MNCs do not just participate in trade—they actively shape its structure. Their strategies determine what is produced, where it is produced, and how it is traded.
a) Resource Optimization
MNCs strategically locate their production units in countries where resources—labor, raw materials, and energy—are most cost-effective. This optimization reduces production costs and influences global trade flows. For example, Intel manufactures semiconductors in regions where technical expertise and low-cost skilled labor are available.
b) Trade Diversification
Through their global reach, MNCs diversify trade by introducing new products, markets, and industries. They create cross-border linkages that integrate economies and make global trade more resilient to regional shocks.
c) Market Influence
Due to their large size and market power, MNCs often influence international prices, trade policies, and even consumer preferences. For instance, the decisions of energy MNCs like ExxonMobil or Shell can affect global oil trade and pricing.
5. MNCs and Globalization: A Two-Way Relationship
Globalization has facilitated the rise of MNCs, and MNCs, in turn, have accelerated globalization.
a) Liberalization and Market Access
The liberalization of trade and investment policies across the world—through organizations like the World Trade Organization (WTO)—has allowed MNCs to expand operations freely. They exploit opportunities in open markets and influence trade agreements.
b) Cultural Exchange and Global Brands
MNCs spread global brands and lifestyles across borders. Companies like Nike, Starbucks, and Amazon have created uniform consumption patterns and global consumer identities. This cultural globalization has both positive (cultural awareness) and negative (cultural homogenization) effects.
6. Challenges and Criticisms of MNCs in Global Trade
Despite their contributions, MNCs also face criticism for several adverse impacts on host and home countries.
a) Exploitation of Labor and Resources
MNCs are often accused of exploiting cheap labor and natural resources in developing countries. Low wages, poor working conditions, and environmental degradation have been reported in industries such as garment manufacturing and mining.
b) Economic Inequality
MNC operations can lead to uneven development. Profits are often repatriated to home countries, leading to capital outflows from developing economies. The benefits of FDI and trade may be concentrated among a few urban centers, widening inequality.
c) Monopoly and Market Power
Due to their size, MNCs can dominate markets, stifling competition from local firms. For example, small retailers may struggle to compete with giants like Walmart or Amazon. This dominance can reduce diversity and lead to market monopolization.
d) Political and Economic Influence
MNCs wield significant political influence, lobbying for favorable trade policies, tax breaks, or weaker labor and environmental regulations. This influence can distort democratic policymaking in host countries.
e) Cultural Erosion
Global brands and media spread Western consumption patterns, often at the expense of local cultures and traditions. This cultural homogenization raises concerns about loss of identity in many developing nations.
7. MNCs and Sustainable Global Trade
In recent years, the focus has shifted toward sustainable and ethical globalization, and MNCs are under growing pressure to adopt responsible practices.
a) Environmental Responsibility
Companies are now integrating green practices in production and logistics to reduce carbon footprints. For example, Tesla promotes renewable energy and electric mobility, while Unilever focuses on sustainable sourcing.
b) Fair Trade and Corporate Social Responsibility (CSR)
Many MNCs are adopting CSR initiatives, supporting local communities, improving labor standards, and engaging in fair trade practices. This builds brand trust and aligns with consumer demand for ethical products.
c) Digital Transformation and Global Connectivity
The digital era has enhanced MNC efficiency and global integration. E-commerce giants like Alibaba and Amazon have created platforms that connect millions of small businesses to international markets, democratizing trade access.
8. Case Studies: MNCs Shaping Global Trade
Case 1: Apple Inc. – The Global Supply Chain Model
Apple’s products are a perfect example of globalization driven by MNCs. Designed in California, components are sourced globally—from South Korea, Taiwan, and Japan—and assembled in China before being distributed worldwide. This model exemplifies how MNCs integrate multiple economies through trade and production.
Case 2: Toyota – Innovation and Localization
Toyota’s global strategy of “local production for local consumption” has strengthened its presence in markets like India, the U.S., and Europe. It sets up local manufacturing facilities to reduce trade barriers while maintaining export-oriented models, influencing both local employment and trade balances.
Case 3: Unilever – Sustainable Development and Global Reach
Operating in over 190 countries, Unilever integrates global trade with local adaptation. It promotes sustainability, fair trade, and rural development through localized sourcing while maintaining global brand consistency.
9. The Future of MNCs in Global Trade
a) Digital and Technological Transformation
Advances in artificial intelligence, automation, and blockchain are redefining how MNCs operate. Digital trade, e-commerce, and fintech platforms will further integrate global markets, making cross-border trade more efficient.
b) Decentralization and Regionalization
The COVID-19 pandemic and geopolitical tensions have prompted MNCs to diversify supply chains away from over-dependence on a single country. This shift toward regional trade hubs (e.g., ASEAN, EU, NAFTA) may reshape global trade geography.
c) Inclusive and Green Growth
Future trade policies and corporate strategies are expected to emphasize inclusivity, sustainability, and environmental accountability. MNCs that align with green trade practices and ESG (Environmental, Social, and Governance) standards will likely dominate global commerce.
10. Conclusion
Multinational corporations have become the backbone of the global trading system, transforming how nations interact economically. Their ability to connect markets, transfer technology, and create employment has made them indispensable to modern globalization. However, their growing power also raises challenges—inequality, environmental degradation, and monopolistic practices—that require balanced regulation and global governance.
To ensure a fair and sustainable global trade ecosystem, collaboration among governments, MNCs, and international institutions is essential. The future of global trade will depend not only on corporate innovation but also on ethical leadership, equitable wealth distribution, and environmental stewardship.
In essence, MNCs are both the architects and products of globalization. Their actions will continue to shape the trajectory of global trade, determining whether the world moves toward inclusive prosperity or deeper inequality. The challenge lies in harnessing their vast potential while ensuring that their influence benefits not just shareholders—but societies across the globe.
Trade ideas

NVIDIA bearish crabBig red candle on the bearish crab reversal zone signals further downside move. did you buy the dip?

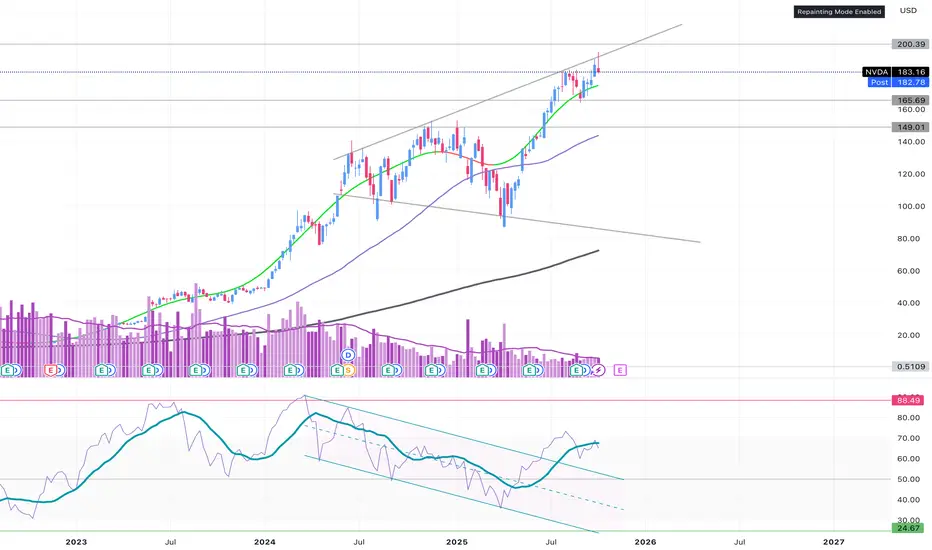
NVDA - weekly chart MVP SYSTEM MOMENTUM - daily is in uptrend channel; weekly is ??; monthly looks toppy
VOLUME - some increased volume on the breakout above 183; Overall, volume not significantly changed since the April bottom
PRICE - There is a topping candle on the weekly at the upper trendline of the megaphone; Price reached 195 before reversing back down
What does it all mean?
1. Possible revisit 165
2. Possible revisit 150
3. Possible retouch of 180 and then next move up again
3. Long-term top is in with uncertain future
Let me know what you think….
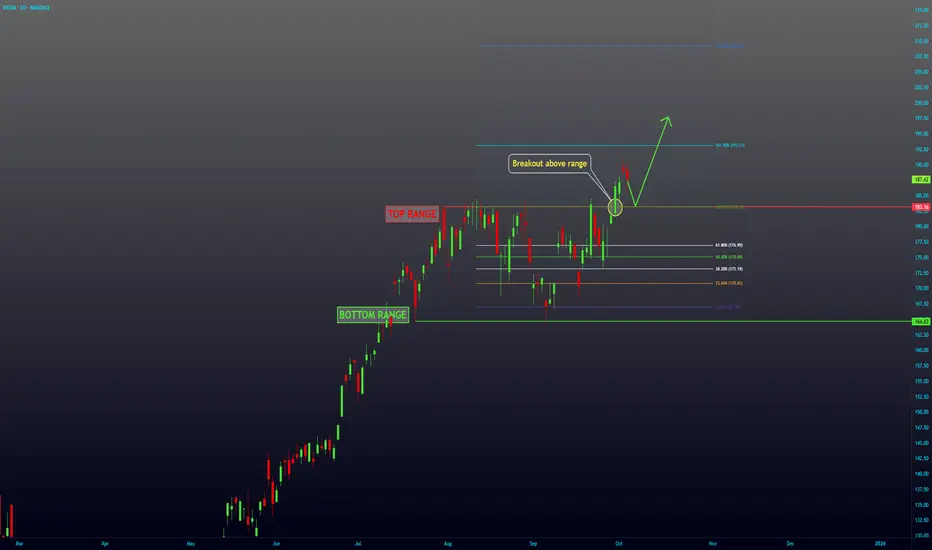
NVDA Breakout -- Continuation UPNASDAQ:NVDA has been in a range since end of July until September 30th, where it broke above the range. I expect to see more upside from here.
NVDA: Riding the AI Hype Wave to $250!NASDAQ:NVDA just hit its all-time high last friday, reaching my swing trade target. While I took profits as part of my routine discipline, I still believe there's plenty of upside left, with $250 in sight.
Here's why:
Strong Fundamentals: Nvidia consistently beats earnings expectations, with EPS climbing from $0.11 to $0.68 over recent six quarters. This growth trajectory shows no signs of slowing down, reinforcing the stock's upward momentum.
Analyst Confidence: Out of 65 analysts, 51 rate Nvidia as a "Strong Buy," with none suggesting a sell. While the average price target is $149.81, the highest target of $202.79 shows strong backing from the financial community.
Bullish Technicals: Weekly and daily moving averages, from the 10-day to the 200-day, are flashing "Buy" across the board. Add to that a myriad of other indicators in different time frames (basically, you name it), and it’s signaling "Buy." In short, everything is pointing towards continued bullish momentum and potential for further gains.
Market Leadership: Nvidia's dominance in AI and high-performance computing continues to grow. Its cutting-edge AI chips, as well as its strong presence in data centers and gaming, put the company in a prime position to capitalize on key growth sectors.
And finally, why am I more bullish than even the highest analyst target? Well, it’s simple: the hype. Nvidia is at the forefront of the most exciting and disruptive technologies today—AI, data centers, gaming—you name it. The market's enthusiasm surrounding these sectors is growing exponentially, and Nvidia is perfectly positioned to ride that wave. Sometimes, fundamentals and technicals align with pure market excitement, and that’s where I see Nvidia pushing past those conservative estimates toward $250.
Disclaimer: This content is for informational and educational purposes only. It should not be considered as financial or investment advice. Trading stocks involves risk, and you should perform your own research or consult with a professional before making any investment decisions. Past performance is not indicative of future results.

NVDA : The Engine of Robotic Intelligence More BUYSNvidia's chips and AI platforms power the nervous system of modern robotics, enabling real-time processing, deep learning, and autonomous decision-making for next-gen machines.
Master Correlation StrategiesUnlocking the Power of Inter-Market Relationships in Trading.
1. Understanding Correlation in Trading
Correlation refers to the statistical relationship between two or more financial instruments — how their prices move relative to each other. It is expressed through a correlation coefficient ranging from -1 to +1.
Positive Correlation (+1): When two assets move in the same direction. For example, crude oil and energy sector stocks often rise and fall together.
Negative Correlation (-1): When two assets move in opposite directions. For instance, the U.S. dollar and gold often have an inverse relationship — when one rises, the other tends to fall.
Zero Correlation (0): Indicates no consistent relationship between two assets.
Understanding these relationships helps traders predict how one market might respond based on the movement of another, enhancing decision-making and portfolio design.
2. Why Correlation Matters
In modern financial markets, where globalization links commodities, equities, currencies, and bonds, no asset class operates in isolation. Correlation strategies allow traders to see the “bigger picture” — understanding how shifts in one area of the market ripple across others.
Some key reasons why correlation is vital include:
Risk Management: Diversification is only effective when assets are uncorrelated. If all your holdings move together, your portfolio is not truly diversified.
Predictive Analysis: Monitoring correlated assets helps anticipate price moves. For example, a rally in crude oil might foreshadow gains in oil-dependent currencies like the Canadian Dollar (CAD).
Hedging Opportunities: Traders can offset risks by holding negatively correlated assets. For instance, pairing long stock positions with short positions in an inverse ETF.
Market Confirmation: Correlations can validate or contradict signals. If gold rises while the dollar weakens, the move is more credible than when both rise together, which is rare.
3. Core Types of Correlations in Markets
a. Intermarket Correlation
This examines how different asset classes relate — such as the link between commodities, bonds, currencies, and equities. For example:
Rising interest rates typically strengthen the domestic currency but pressure stock prices.
Falling bond yields often boost equity markets.
b. Intra-market Correlation
This focuses on assets within the same category. For example:
Technology sector stocks often move together based on broader industry trends.
Gold and silver tend to share similar price patterns.
c. Cross-Asset Correlation
This involves analyzing relationships between assets of different types, such as:
Gold vs. U.S. Dollar
Crude Oil vs. Inflation Expectations
Bitcoin vs. NASDAQ Index
d. Temporal Correlation
Certain correlations shift over time. For instance, the correlation between equities and bonds may be positive during economic growth and negative during recessions.
4. Tools and Techniques to Measure Correlation
Correlation is not merely an observation—it’s a quantifiable concept. Several statistical tools help traders measure and monitor it accurately.
a. Pearson Correlation Coefficient
This is the most widely used formula to calculate linear correlation between two data sets. A reading close to +1 or -1 shows a strong relationship, while values near 0 indicate weak correlation.
b. Rolling Correlation
Markets evolve constantly, so rolling correlation (using moving windows) helps identify how relationships shift over time. For example, a 30-day rolling correlation between gold and the USD can show whether their inverse relationship is strengthening or weakening.
c. Correlation Matrices
These are tables showing the correlation coefficients between multiple assets at once. Portfolio managers use them to construct diversified portfolios and reduce overlapping exposures.
d. Software Tools
Platforms like Bloomberg Terminal, TradingView, MetaTrader, and Python-based tools (like pandas and NumPy libraries) allow traders to calculate and visualize correlation efficiently.
5. Applying Correlation Strategies in Trading
a. Pair Trading
Pair trading is a market-neutral strategy that exploits temporary deviations between two historically correlated assets.
Example:
If Coca-Cola and Pepsi usually move together, but Pepsi lags temporarily, traders may go long Pepsi and short Coca-Cola, betting the relationship will revert.
b. Hedging with Negative Correlations
Traders can use negatively correlated instruments to offset risk. For instance:
Long positions in the stock market can be hedged by taking positions in safe-haven assets like gold or the Japanese Yen.
c. Sector Rotation and ETF Strategies
Investors track sector correlations with broader indices to identify leading and lagging sectors.
For example:
If financial stocks start outperforming the S&P 500, this could signal a shift in the economic cycle.
d. Currency and Commodity Correlations
Currencies are deeply linked to commodities:
The Canadian Dollar (CAD) often correlates positively with crude oil prices.
The Australian Dollar (AUD) correlates with gold and iron ore prices.
The Swiss Franc (CHF) is often inversely correlated with global risk sentiment, acting as a safe haven.
Traders can exploit these relationships for cross-market opportunities.
6. Case Studies of Correlation in Action
a. Gold and the U.S. Dollar
Gold is priced in dollars; therefore, when the USD strengthens, gold usually weakens as it becomes more expensive for other currency holders.
During 2020’s pandemic uncertainty, both assets briefly rose together — a rare situation showing correlation can shift temporarily under stress.
b. Oil Prices and Inflation
Oil serves as a barometer for inflation expectations. When crude prices rise, inflation fears grow, prompting central banks to tighten policies.
Traders who monitor this relationship can anticipate policy shifts and market reactions.
c. Bitcoin and Tech Stocks
In recent years, Bitcoin has shown increasing correlation with high-growth technology stocks. This suggests that cryptocurrency markets are influenced by risk sentiment similar to the equity market.
7. Benefits of Mastering Correlation Strategies
Enhanced Market Insight: Understanding inter-market dynamics reveals the underlying forces driving price movements.
Stronger Portfolio Construction: Diversify effectively by choosing assets that truly offset one another.
Smarter Risk Control: Correlation analysis highlights hidden exposures across asset classes.
Improved Trade Timing: Correlation signals help confirm or challenge technical and fundamental setups.
Global Perspective: By studying correlations, traders gain insight into how global events ripple through interconnected markets.
8. Challenges and Limitations
Despite its power, correlation analysis is not foolproof. Traders must be aware of its limitations:
Changing Relationships: Correlations evolve over time due to policy changes, crises, or shifting investor sentiment.
False Correlation: Sometimes two assets appear correlated by coincidence without a fundamental link.
Lag Effect: Correlation may not capture time delays between cause and effect across markets.
Overreliance: Correlation is one tool among many; combining it with technical, fundamental, and sentiment analysis produces more reliable outcomes.
9. Advanced Correlation Techniques
a. Cointegration
While correlation measures relationships at a moment in time, cointegration identifies long-term equilibrium relationships between two non-stationary price series.
For example, even if short-term correlation fluctuates, two assets can remain cointegrated over the long run — useful in statistical arbitrage.
b. Partial Correlation
This method isolates the relationship between two variables while controlling for others. It’s particularly helpful in complex portfolios involving multiple correlated instruments.
c. Dynamic Conditional Correlation (DCC) Models
These advanced econometric models (used in quantitative finance) measure time-varying correlations — essential for modern algorithmic trading systems.
10. Building a Correlation-Based Trading System
A professional correlation strategy can be structured as follows:
Data Collection: Gather historical price data for multiple assets.
Statistical Analysis: Calculate correlations and rolling relationships using software tools.
Strategy Design: Develop pair trades, hedges, or intermarket signals based on correlation thresholds.
Backtesting: Validate the system across different market phases to ensure robustness.
Execution and Monitoring: Continuously update correlation data and adjust positions as relationships evolve.
Risk Control: Implement stop-loss rules and diversification limits to prevent overexposure to correlated positions.
11. The Future of Correlation Strategies
In an era of high-frequency trading, AI-driven analytics, and global macro interconnectedness, correlation strategies are evolving rapidly. Machine learning models now identify non-linear and hidden correlations that traditional statistics might miss.
Furthermore, as markets integrate further — with crypto, ESG assets, and alternative data sources entering the scene — understanding these new correlations will be crucial for maintaining an edge in trading.
12. Final Thoughts
Mastering correlation strategies isn’t just about mathematics — it’s about understanding the language of global markets. Every movement in commodities, currencies, and indices tells a story about how capital flows across the world.
A trader who comprehends these relationships gains not only analytical power but also strategic foresight. By mastering correlation analysis, you move beyond isolated price charts and see the interconnected web that drives the global financial ecosystem.
In essence, correlation strategies are the bridge between micro-level technical trades and macro-level economic understanding. Those who can navigate this bridge with confidence stand at the forefront of modern trading excellence — armed with knowledge, precision, and an unshakable sense of market direction.
Nvidia Stock Nears the $200 MarkNvidia’s stock has gained more than 4% over the last three trading sessions. The price currently hovers slightly above $190 per share, marking new record highs and moving closer to the psychological level of $200.
Buying pressure has intensified after the U.S. government authorized a series of agreements allowing the export of advanced artificial intelligence chips to the United Arab Emirates, opening a strategic trade channel with the Middle East. This development has strengthened investor confidence, fueled by higher long-term revenue expectations for the company. As a result, buying momentum may continue to dominate in the short term.
Relevant Uptrend
Since early April, the stock has maintained a steady upward trend, consistently posting new highs that confirm a dominant bullish bias on the broader chart. So far, there have been no significant corrections threatening this structure, leaving the uptrend line as the key reference for short-term movements.
However, as the price approaches the $200 level, a phase of indecision could emerge due to signs of buyer exhaustion, reflected in the formation of weakening candles. This behavior could lead to technical pullbacks within the broader bullish trend.
RSI
The RSI line remains above the 50 level, indicating that buying momentum remains dominant over the past 14 trading sessions. However, the indicator is gradually approaching the overbought zone (70). If it reaches this level, it could signal an imbalance in market forces, opening the door to short-term downward corrections.
MACD
The MACD histogram remains close to the neutral line (0), suggesting a lack of clear directional strength in the short-term moving averages.
Both indicators point to a potential phase of indecision in short-term movements, allowing for a possible period of consolidation within the current bullish bias, especially if no new major catalysts emerge to drive aggressive buying pressure in the coming sessions.
Key Levels to Watch:
$200 – Psychological Resistance: In the absence of historical references, this level stands out as the most relevant short-term price point. It could act as a technical barrier, triggering temporary pullbacks.
$184 – Near-Term Support: Corresponds to the recent retracement area. A drop below this level could neutralize bullish momentum and lead to a sideways consolidation phase.
$170 – Key Support: Associated with recent lows, located below the 100-period moving average. A sustained move under this level could shift the market structure and pave the way for a dominant bearish bias.
Written by Julian Pineda, CFA – Market Analyst

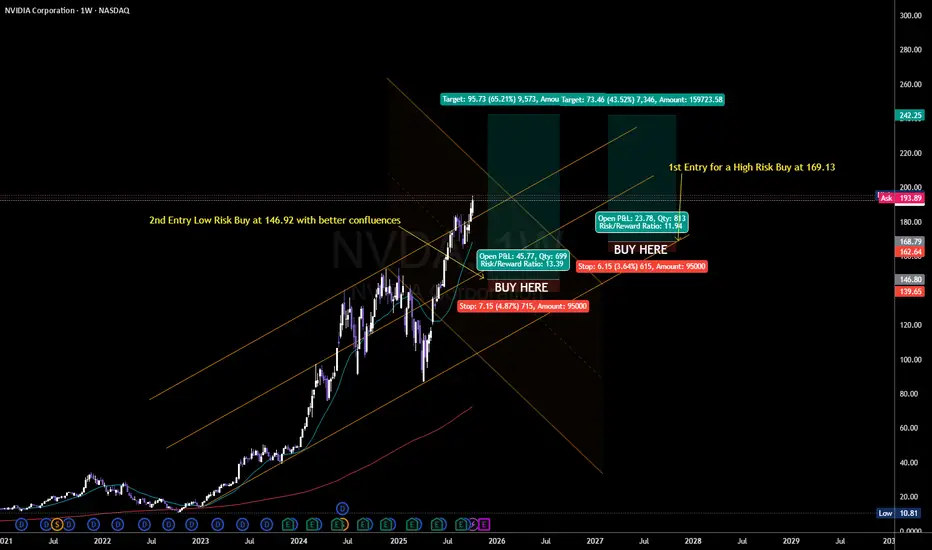
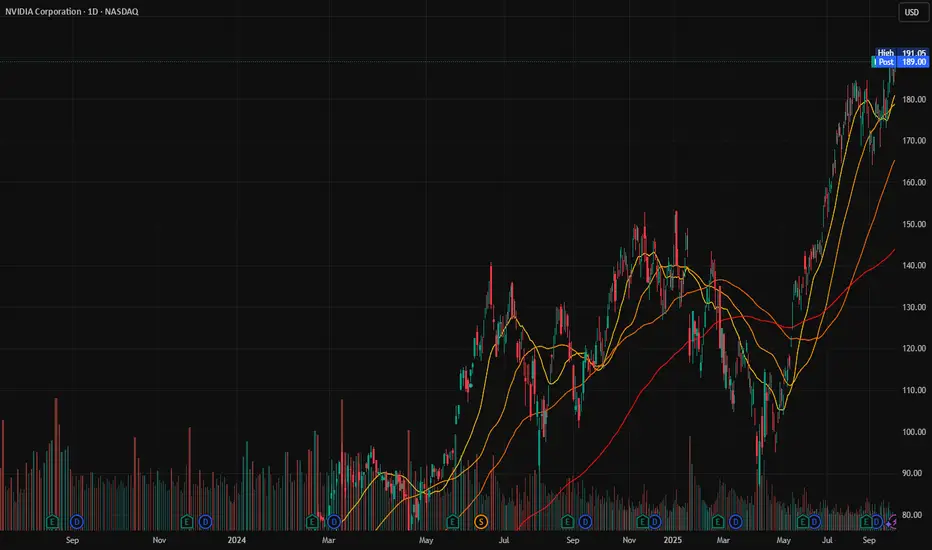
Nvidia - Starting a clear +20% rally!🧲Nvidia ( NASDAQ:NVDA ) rallies higher now:
🔎Analysis summary:
About one decade ago, Nvidia broke out of a major bullish triangle pattern. Following this remarkable breakout, Nvidia continued with a rally of about +35.000%. But looking at all these previous cycles, Nvidia remains bullish with another potential +20% move towards the upside.
📝Levels to watch:
$200, $250
SwingTraderPhil
SwingTrading.Simplified. | Investing.Simplified. | #LONGTERMVISION

$NVDA : The Rally’s Writing Its Own Headline! 10/9/2025NASDAQ:NVDA is making steady strides toward its wave C target of $235, following a challenging 13-month correction that found its bottom at $95 in April.
The bullish momentum could push prices even higher, eyeing a potential $321.
Sit tight and enjoy the ride! 🚀👌

NVIDIA Next stop.. $200For a long time we've been calling for a $200 Target on NVIDIA Corporation (NVDA). That was our main Target for the Bull Cycle that started in November 2022. The stock is very close to this level and the short-term pattern that can get to it is this Channel Up.
Supported by the 1H MA100 (green trend-line), NVIDIA has been posting Bullish Legs of around +10% since the September 05 Low. The confirmation signal for those Legs has been a 1H MACD Bullish Cross.
Given that we formed one yesterday, we expect the price to be on such a Bullish Leg already. The 'weakest' of those sequences has been +9.58%, which if repeated, lands marginally above the $200 psychological level.
Time to hit it?
-------------------------------------------------------------------------------
** Please LIKE 👍, FOLLOW ✅, SHARE 🙌 and COMMENT ✍ if you enjoy this idea! Also share your ideas and charts in the comments section below! This is best way to keep it relevant, support us, keep the content here free and allow the idea to reach as many people as possible. **
-------------------------------------------------------------------------------
💸💸💸💸💸💸
👇 👇 👇 👇 👇 👇

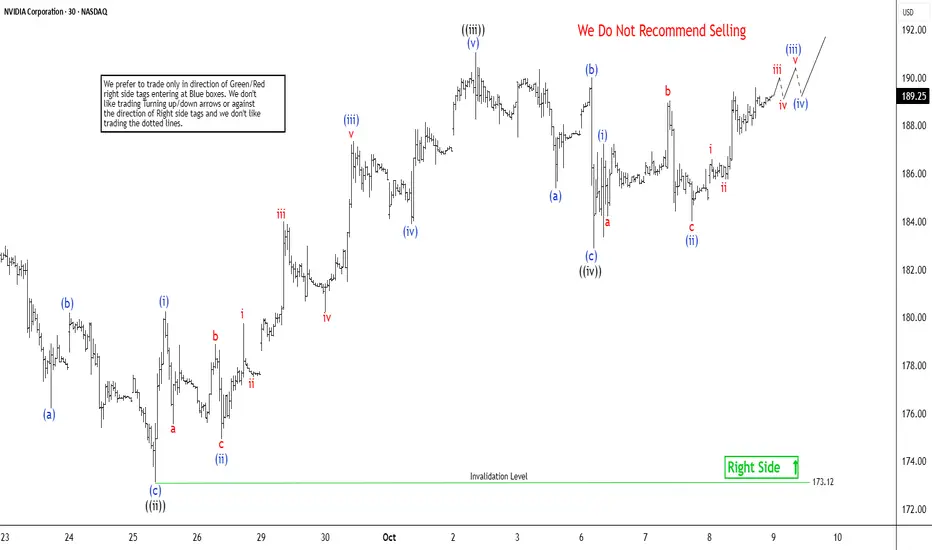
NVDA (Nvidia’s) Leading Diagonal Pattern Targets $193The short-term Elliott Wave analysis for Nvidia (NVDA) indicates that the cycle from the September 18 low is unfolding as a leading diagonal. Starting from that low, wave ((i)) concluded at $184.55, followed by a pullback in wave ((ii)) that ended at $173.12, as depicted in the 30-minute chart. The stock then surged in wave ((iii)), displaying an internal impulse structure. From wave ((ii)), wave (i) peaked at $180.26, with wave (ii) dipping to $174.93. Wave (iii) climbed to $187.35, followed by a wave (iv) pullback to $183.90. The final leg, wave (v), reached $191.05, completing wave ((iii)) in a higher degree.
The subsequent wave ((iv)) pullback formed a zigzag Elliott Wave pattern. From wave ((iii)), wave (a) declined to $185.38, wave (b) rose to $190, and wave (c) dropped to $182.88, finalizing wave ((iv)). The stock has since resumed its ascent in wave ((v)), with wave (i) ending at $187.23 and wave (ii) dips concluding at $184. The stock is poised to climb further, likely completing wave (iii) soon. A wave (iv) pullback should follow to correct the cycle from the October 8, 2025 low before resuming higher. As long as the $173.12 pivot holds, any pullback should find support in a 3, 7, or 11 swing, setting the stage for additional upside.
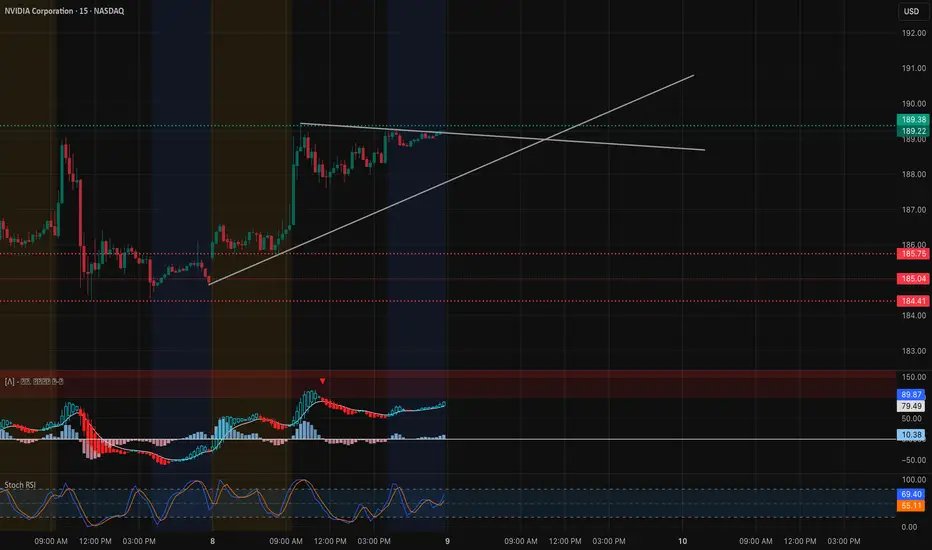
NVDA Holding Strong. Break $190 Before the Next Wave. Oct 9NVIDIA continues to trade with strong bullish momentum, consolidating just under the $190 level — a critical resistance area backed by prior liquidity grabs and gamma resistance. Today’s price action shows tight coiling between $188 and $189.50, indicating a potential breakout setup for the next session.
Market Structure:
* On the 15-minute chart, NVDA is respecting an ascending trendline from yesterday’s low, suggesting sustained intraday bullish control.
* The 1-hour structure reveals a clean range between $185.75 (support) and $189.50 (resistance) — a breakout from this range could trigger a measured move toward $192–$195.
* MACD on the 15-minute is crossing bullish with rising histogram momentum, and the Stoch RSI remains elevated but not yet overextended — signaling possible continuation before cooling off.
Support and Resistance Levels:
* Immediate Resistance: $189.41 → $190.36 (short-term breakout zone)
* Major Resistance (Gamma Wall): $192.5 → $195
* Immediate Support: $186.89 → $185.75
* Key Support Zone: $184.4 → $182.8
GEX & Options Sentiment (1H GEX Chart):
* Highest positive Call Gamma concentration sits between $192.5 and $195, aligning with visible overhead resistance.
* Put support remains dense at $182–$180, forming a sturdy gamma floor.
* IVR remains low at 12.2, and call positioning slightly outweighs puts (13.5% call bias), showing traders are positioning bullish but cautiously.
* The GEX trend favors upside momentum while $185 holds, giving NVDA room to climb toward the $190–$192.5 zone if SPY continues to strengthen.
Trade Scenarios:
Bullish Setup:
* Entry: Above $189.50 breakout confirmation
* Target 1: $192.5
* Target 2: $195
* Stop-Loss: Below $186.8
* Rationale: Trendline support, bullish MACD, and strong GEX alignment support a breakout continuation.
Bearish Setup:
* Entry: Below $185.75 (breakdown retest)
* Target 1: $184.4
* Target 2: $182
* Stop-Loss: Above $187
* Rationale: A rejection at $189–$190 with MACD divergence could trigger a short-term pullback to fill lower liquidity pockets.
NVDA’s price action shows controlled consolidation under a key resistance, suggesting a potential breakout continuation toward $192–$195 if momentum holds. Watch SPY’s direction for confirmation — any weakness there could cause NVDA to retest $185 before resuming upward. For now, bulls are in charge.
Disclaimer:
This analysis is for educational purposes only and does not constitute financial advice. Always do your own research and manage your risk before trading.
NVDA broke the resistanceNASDAQ:NVDA has just broken a resistance, slowly slowly targets 250$.
Currently no sign for downwards.

$NVDA Call Alert – Oct 31 ’25 $190 Calls | 71% ROI PotentialEnter: NASDAQ:NVDA OCT 31 2025 $190 CALLS
Buy in Price: $6.80 - $6.85
Take Profit: $11.63
Stop Bleeding: $5.98
ROI Potential: 71%
Exit Within: 302 Minutes
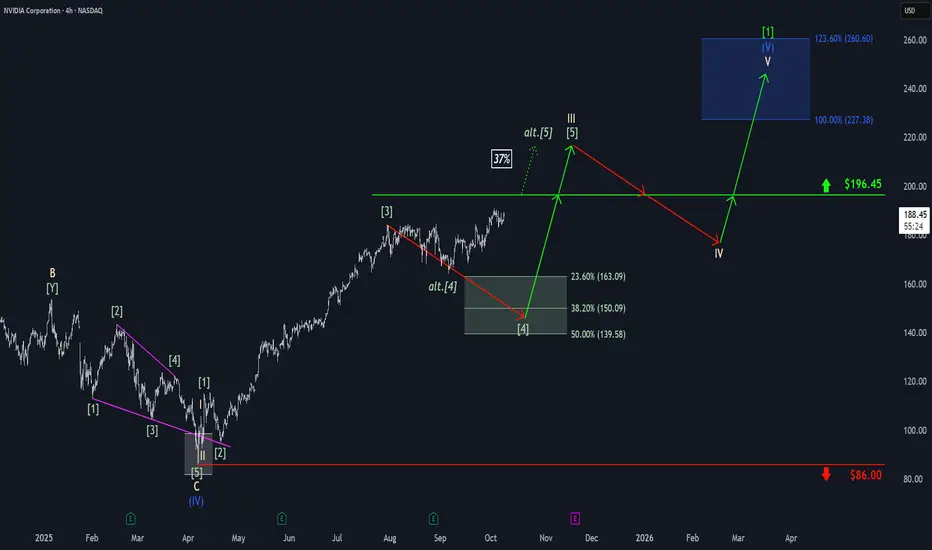
Nvidia: Bullish DistractionAmid bullish momentum, Nvidia edged closer to resistance at $196.45 before settling into sideways action late last week. As a result, there remains a 37% probability that the stock will bypass a new low and instead break directly above the $196.45 level. However, our primary expectation is for the stock to turn lower, targeting our green Target Zone between $163.09 and $139.58 to complete green wave . Only after this move do we anticipate a sustained advance above $196.45, which would mark the completion of beige wave III. Following a wave IV pullback below this threshold, we ultimately expect gains into the blue Target Zone between $227.38 and $260.60, where beige wave V should complete not only blue wave (V), but also the larger neon green wave .
NVDA - AI Dominance + Strong Technical Structure | Long Entry📈 Ticker: NVDA (NVIDIA Corporation)
📍 Recommendation: LONG
⏰ Timeframe: Position Trade (4-8 weeks)
🎯 Trade Idea Summary
Entry: $189.00 (on pullback to support)
Stop Loss: $173.00 (-8.5%)
Take Profit: $221.00 (+16.9%)
Risk/Reward Ratio: 1:2.0
📊 Fundamental Justification - AI LEADER 🚀
Revenue Growth: STRONG (+114% YoY) - $60.9B to $130.5B 💰
Net Income Growth: STRONG (+145% YoY) - $29.8B to $72.9B 📈
Debt Health: EXCELLENT (Score 10/10) - Low debt, high coverage ✅
Market Position: Dominant AI/GPU market share
Growth Catalyst: AI infrastructure spending cycle
📈 Technical Analysis
Trend: Daily ↗️ Alcista, 4H ↗️ Alcista, 1H ↗️ Alcista (ALL BULLISH)
RSI: 65.8 - Healthy momentum, not overbought
MACD: Bullish and positive across timeframes
Price Action: Above all key SMAs, holding higher lows
Key Support: $185 (recent swing), $178 (SMA20), $173 (critical)
Key Resistance: $195 (psychological), $205 (recent high), $221 (target)
🔍 Catalyst & Market Context
AI Revolution: Sustained data center demand
Earnings Momentum: Consistently beating expectations
Product Cycle: Blackwell GPU platform rollout
Institutional Support: Heavy fund ownership
🎮 Trade Management
Ideal Entry Zone: $188 - $190
Stop Below: $173.00 (below SMA20 and key support)
Target 1: $205.00 (+8.5%) - Consider partial profit
Target 2: $221.00 (+16.9%) - Full position target
Timeframe: 4-8 weeks for full target
⚠️ Risk Factors
Valuation Premium: P/E 53.9 (high but growth-justified)
Market Dependency: Tech sector correlation
Competition: AMD/Other AI chip competitors
Economic Sensitivity: Capex spending cycles
✅ Why This Trade Works
Earnings Powerhouse - Explosive growth in AI era 📊
Technical Strength - Clean uptrend across timeframes 🟢
Structural Tailwinds - Multi-year AI investment cycle 🔄
Risk Management - Defined levels with 1:2 R/R 🛡️
📅 Key Levels to Watch
Immediate Support: $185 - $188
Breakout Level: $195 - $197
Acceleration Zone: Above $205
Invalidation: Below $173 (stop loss)
#NVDA #NVIDIA #AI #PositionTrade #TechStocks #Breakout
#ArtificialIntelligence #Semiconductors #GrowthInvesting #RiskManagement
Disclaimer: This post is for educational and informational purposes only and does not constitute financial advice or investment recommendation. Trading involves substantial risk of loss and is not suitable for all investors. Past performance is not indicative of future results. Conduct your own research and consult with a qualified financial advisor before making any investment decisions.
Full moon energy - $NVDA🟩 190 — resistance zone
🟪 194 — potential breakout
🟥 153 — mid-range support
🟨 127 / 112 — deep demand zones
Momentum still strong but slowing near highs… like energy you can still feel, even when it’s pulling back that “missing you” I do mean you! phase before momentum returns.

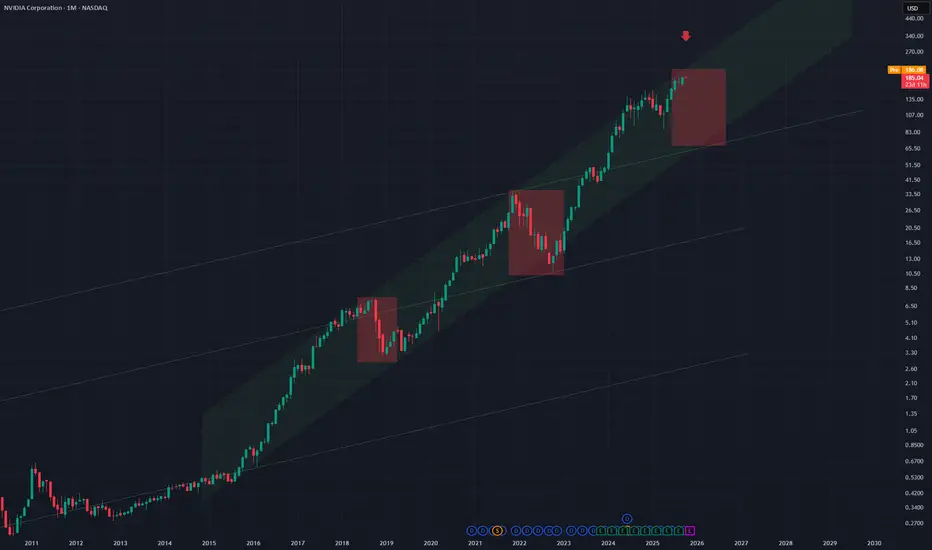
NVDA - Bear Move Within Up ChannelNVDA is at the top of an up channel on the Monthly chart
This is a very steep up channel
Two prior moves down from the top of this channel can be seen (red rectangles)
Suggesting a third drop happens on this timeframe.
Exchange Rate Secrets1. What Are Exchange Rates and Why They Matter
An exchange rate is simply the price of one currency in terms of another. For instance, if $1 = ₹84, that means one US dollar can buy eighty-four Indian rupees.
But this number isn’t just a conversion figure — it’s a snapshot of economic power.
When a country’s currency strengthens, imports become cheaper but exports turn costlier.
When it weakens, exports surge but inflation might rise.
Exchange rates influence:
Global trade balances
Investment decisions
Inflation and interest rates
Tourism and remittances
Stock and commodity markets
Understanding these hidden levers is the first step to decoding the secrets of exchange rate movements.
2. The Real Players Behind the Curtain
Contrary to popular belief, exchange rates don’t move by chance. They’re often influenced — directly or indirectly — by a select few economic giants:
a. Central Banks
Institutions like the US Federal Reserve, European Central Bank, and Reserve Bank of India hold the real levers.
They manipulate interest rates to attract or repel foreign capital.
They intervene in forex markets to stabilize or deliberately weaken their currency.
They issue monetary policies that send shockwaves through global markets.
For example, when the Fed raises interest rates, the US dollar usually strengthens — because higher returns attract global investors.
b. Institutional Traders and Hedge Funds
Major hedge funds trade billions in currencies daily. They anticipate policy changes and use leverage to amplify profits — creating massive short-term moves that can destabilize weaker economies.
c. Governments
Sometimes, governments quietly “manage” their exchange rates for strategic reasons. China, for example, has often been accused of keeping the Yuan undervalued to make its exports more competitive — a tactic dubbed “currency manipulation.”
d. The Market Psychology
Beyond data and policy, market sentiment — the collective emotion of traders — drives currencies. Fear of recession, geopolitical tensions, or even rumors can send exchange rates spinning faster than any spreadsheet can predict.
3. The Core Secrets Behind Currency Movements
Now let’s unlock the deep, often hidden mechanisms that move currencies. These are the five pillars of exchange rate secrets:
1️⃣ Interest Rate Differentials
Currencies tend to flow toward countries with higher interest rates.
If India’s rates are 6% while the US offers 4%, investors may convert dollars to rupees to earn better returns.
This inflow strengthens the rupee.
But here’s the twist: expectations matter more than reality. Even a hint that the Fed may raise rates can trigger massive dollar inflows — long before the actual hike happens.
2️⃣ Inflation and Purchasing Power
Currencies are mirrors of purchasing power.
If inflation is high in one country, its money loses value faster.
Low inflation, on the other hand, indicates stability and boosts confidence.
This is why nations with consistent inflation control — like Switzerland and Japan — often see their currencies appreciated as “safe havens.”
3️⃣ Trade Balances
Countries that export more than they import tend to have stronger currencies.
Why? Because foreign buyers must purchase the exporter’s currency to pay for goods.
For instance, Japan’s trade surplus has historically supported the yen.
Conversely, a nation running persistent trade deficits (like the US) faces downward pressure — unless offset by investment inflows.
4️⃣ Political Stability and Global Confidence
Political chaos often sends investors fleeing.
A coup, election turmoil, or policy uncertainty can cause sudden devaluations.
Meanwhile, stable governments with clear fiscal policies attract long-term investors — strengthening the currency.
When Russia invaded Ukraine in 2022, the ruble initially collapsed. Yet, with aggressive capital controls and energy exports, it later stabilized — showcasing how government measures can rewrite currency fate.
5️⃣ Speculation and Market Manipulation
The most guarded secret: exchange rates aren’t always fair reflections of fundamentals.
Short-term volatility is often fueled by speculation — big money betting on future trends.
Speculators can move billions in seconds, pushing prices away from equilibrium.
Sometimes, their combined power even forces central banks to retreat — like in 1992’s “Black Wednesday”, when George Soros famously broke the Bank of England and earned over $1 billion in a single day.
4. The Hidden Mechanisms: Pegs, Floats, and Hybrids
Every country chooses how “free” its exchange rate should be.
A. Fixed (Pegged) Exchange Rate
Here, the value is tied to another currency, like the US dollar.
Example: Saudi Arabia pegs its riyal to the dollar to stabilize oil revenues.
Advantage: predictability for trade.
Disadvantage: vulnerability to external shocks.
B. Floating Exchange Rate
The value fluctuates based on market demand and supply.
Example: The US dollar, euro, and Indian rupee are managed floats.
Advantage: market-driven flexibility.
Disadvantage: volatility during crises.
C. Managed Float (Dirty Float)
Most modern economies use this hybrid system — allowing markets to move rates but stepping in occasionally to maintain stability.
These systems reveal another secret — that exchange rates are both economic tools and political weapons.
5. Currency Wars and Global Power Play
When one country weakens its currency intentionally, others often retaliate — sparking a currency war.
The logic is simple: a cheaper currency boosts exports and jobs.
But when multiple nations do this simultaneously, it can spiral into global instability.
2010s: The US accused China and Japan of undervaluing their currencies.
2020s: Nations quietly use quantitative easing (printing money) to keep currencies weak.
2025: As emerging markets like India, Brazil, and Indonesia grow, they’re joining this silent battle — balancing competitiveness with credibility.
6. The Psychological Side of Exchange Rates
Money is emotional. Exchange rates reflect not just economic numbers, but confidence.
When investors “believe” in a country’s future — its leadership, innovation, and growth — its currency rises.
Example:
The US dollar thrives during crises — seen as a “safe haven.”
The Swiss franc and Japanese yen surge when global uncertainty spikes.
The Indian rupee strengthens when foreign investors see long-term growth potential.
This psychological dance creates cycles — optimism, panic, correction — that drive exchange rate volatility beyond fundamentals.
7. Modern Secrets: Digital Currencies and Forex Algorithms
The 21st century has introduced new players and tools that redefine how currencies behave.
a. Algorithmic Trading
Over 70% of forex volume now runs on algorithms — automated systems that execute trades based on millisecond data.
These algorithms can amplify moves, creating sharp spikes or sudden reversals within seconds.
b. Cryptocurrencies
Bitcoin and stablecoins have disrupted the concept of “sovereign money.”
Some nations fear them; others embrace them.
El Salvador adopted Bitcoin, while China banned it and launched its own digital yuan — a step toward controlling cross-border transactions.
The secret here: digital currencies could one day bypass traditional exchange rates altogether.
8. The Indian Rupee in the Global Context
India’s exchange rate journey is a fascinating case study:
Pre-1991: A fixed regime tied to the pound, later the dollar.
Post-liberalization: A managed float system with RBI intervention.
Today: The rupee reflects both domestic fundamentals and global capital flows.
Hidden truth?
The RBI quietly smoothens volatility through buying or selling dollars — maintaining competitiveness for exports while protecting inflation targets.
Future outlook:
Stronger digital economy
Growing exports (IT, pharma, energy)
Controlled fiscal deficit
All point toward a more resilient rupee in the long run — though short-term fluctuations will remain.
9. How Traders and Investors Decode Exchange Rate Secrets
Smart investors don’t just watch the numbers — they watch the forces behind them.
Here’s how they stay ahead:
Monitor central bank statements — “forward guidance” often signals currency direction.
Track bond yield differentials — a widening gap means a stronger high-yield currency.
Follow geopolitical developments — sanctions, wars, or trade deals often move currencies overnight.
Use Volume Profile and Market Structure — to identify institutional footprints in forex charts.
Analyze capital flow data — especially FII (Foreign Institutional Investor) movements in emerging markets like India.
By understanding these undercurrents, traders can align with the smart money — not against it.
10. The Future of Exchange Rates: Toward a Digital Reset
Global monetary systems are entering a new era.
The next decade may witness a “global currency reset”, where traditional paper currencies evolve into central bank digital currencies (CBDCs).
This shift could:
Reduce transaction costs
Increase surveillance and control
Challenge the dominance of the US dollar
Create new “exchange rate ecosystems” driven by technology rather than trade alone
In short, the secrets of tomorrow’s exchange rates may lie not in central banks alone, but in blockchain codes and algorithmic governance.
Conclusion: The Art and Science of Exchange Rates
Exchange rates are far more than numbers flashing on a trading screen.
They are reflections of economic strength, political will, psychological trust, and technological evolution.
The secret to understanding them lies in reading between the lines — connecting data with direction, policies with perception, and numbers with narratives.
As global markets evolve, those who grasp these hidden forces won’t just convert currencies — they’ll convert opportunities into fortune.
Because in the end, exchange rates aren’t just about money — they’re about power. 🌍💰
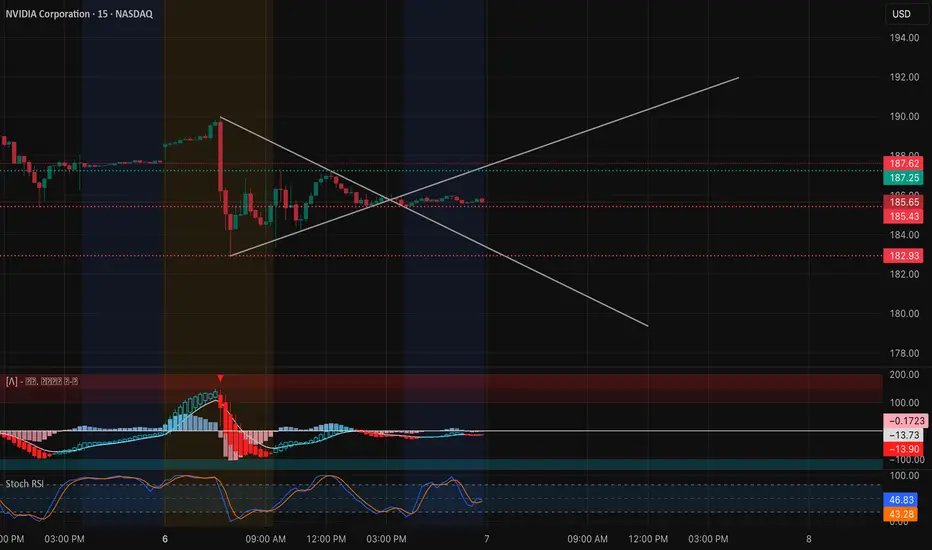
NVDA Oct 7–Coiling Tight for a Breakout! Watch $187.5 Pivot Zone15-Min Chart Analysis (Intraday Trading Setup):
NVDA is forming a symmetrical triangle, compressing between $185–$187.5 after several sessions of choppy consolidation. This coiling pattern reflects equilibrium between buyers and sellers — a setup that typically precedes a strong breakout or breakdown.
Price is currently sitting at $185.65, hugging the triangle’s apex. The MACD is neutral, showing declining momentum but no bearish crossover confirmation yet. Meanwhile, Stoch RSI is resetting mid-range (46.83 / 43.28), suggesting the potential for a new move in either direction once momentum triggers.
Short-term levels to watch:
* Upside breakout zone: $187.25 → $187.62. A break and hold above this level could quickly push NVDA toward $190–$192.50.
* Downside support: $182.93 → $180.50. If price loses $182.93 with volume, it opens room for a retest of the $178 zone where prior liquidity pools exist.
Given the wedge compression, traders should stay patient — the move that follows could be sharp and decisive.
1-Hour GEX Confirmation (Options Sentiment Insight):
GEX levels on the 1-hour chart reinforce the technical setup perfectly:
* Highest positive NETGEX / CALL resistance stands at $192.50, forming a key magnet zone if NVDA breaks out.
* The $185 area aligns with a neutral gamma transition point — a battleground between dealers hedging both directions.
* Strong PUT walls are concentrated around $180–$172.50, creating a solid downside floor.
This gamma structure implies a coiled spring scenario — a decisive break above $187.5 could unleash gamma-driven upside momentum toward $190–$192, while losing $182.9 could accelerate a gamma unwind to $180.
My Thoughts:
NVDA’s price action shows tightening volatility, a sign of energy building before expansion. With low IVR (14.8) and IVx (45.9) — volatility is compressed, making directional breakouts ideal for options traders.
I’m watching $187.50 as the key pivot. A breakout above it could trigger a short-term gamma squeeze toward $192.50, while a failure and rejection could lead to a fade toward $182–$180. This setup offers an attractive risk/reward in either direction — ideal for momentum traders.
Options Outlook (Oct 7–11):
* Bullish setup: Consider 187.5C or 190C (Oct 11 expiry) if price reclaims and holds above $187.5 with volume > average.
* Bearish setup: Consider 182.5P if NVDA fails at $187.5 and breaks below $183 with confirmed MACD divergence.
* Volatility note: With IVR at 14.8, option premiums are cheaper than usual — a good opportunity for directional swing entries.
Conclusion:
NVDA is consolidating tightly at a critical crossroad. The symmetrical triangle plus neutral gamma landscape signals a breakout is near — watch $187.5 for confirmation. Above it, bulls can push toward $190–$192.5; below $183, bears gain control. Stay alert — the next move could define NVDA’s direction for the week.
Disclaimer: This analysis is for educational purposes only and does not constitute financial advice. Always do your own research and manage your risk before trading.
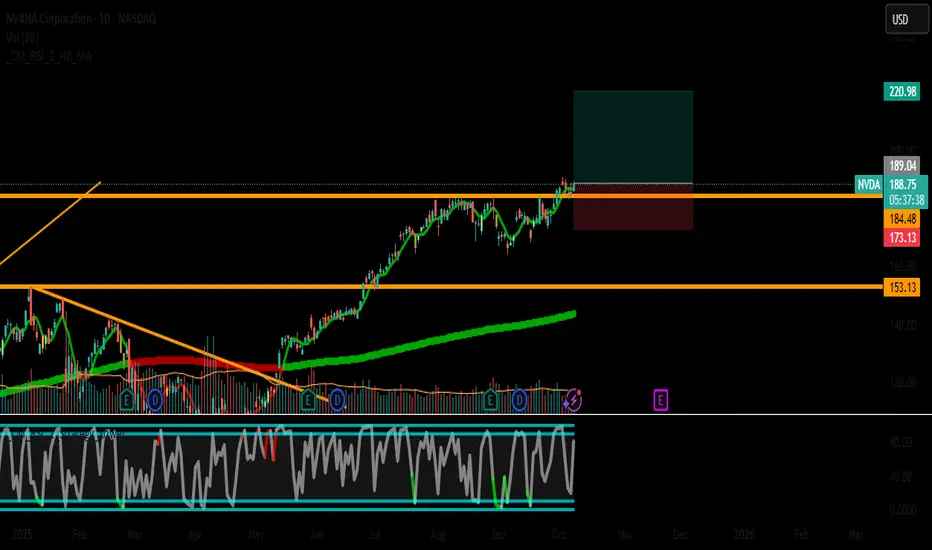
NVDA Long/Investment till mid nov. 2 entries: low probability of orders getting filled/high profit margin.
1. one for higher probability of getting filled. E: 174 SL: 166
2. better profit margin. E: 172 SL: 167
target is $200 - $220
only allowed to hold it till:
1. 15 of November
or
2. 3 of December
why not to hold it till 2026? competition of selling might get higher.
commercials and fund managers will take profit before the bearish seasonality starts.

NVDA SELLIf you have not SELL NVDA, than be prepare to SELL NVDA riding it back down to 93.00 to 77.00 as Profit Targets, Stop Loss will be determine later!
If anyone likes long mumbo jumbo garbage analysis, than this is NOT for you.
Also, if you are afraid of risk, failure, and want only a 100% sure thing, than
run as fast as you can from the market, because the market is NOT a sure thing,
so it is definitely NOT for you.
WARNING: This is just opinions of the market and its only for journaling purpose. This information and any publication here are NOT meant to be, and do NOT constitute, financial, investment, trading, or other types of advice or recommendations. Trading any market instrument is a RISKY business, so do your own due diligence, and trade at your own risk. You can loose all of your money and much more.
