Natural Gas at Key Reversal Zone – Bounce SetupNatural Gas is trading near the ABCD reversal zone.
Weekly RSI is around 40, indicating downside may be limited.
A sharp bounce can be expected from this level.
Expect today’s close above $3.00.
If Sunday’s weather forecast turns colder, it could trigger a gap-up on Monday.

We're going back downExpecting a fall back to support level or below.
That last push up was just an overreaction to a comment of some "wishful thinking" analyst who would like to see a reversal. But the fundamentals remain the same: oversupply and warm weather. It will fall.
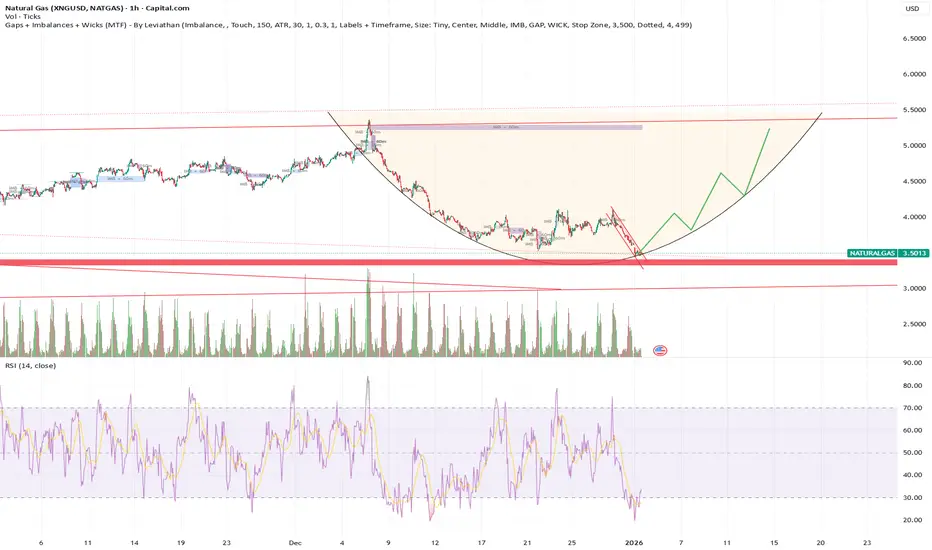
NG Breakout: Global Demand Spikes Above $4.00 Psychological ZoneNatural Gas breaks descending trendline with rising base
Natural Gas has respected a rising support structure while compressing under a descending trendline. The recent candle shows a clean breakout above the trendline with strong bullish momentum and follow through buying.
Price is holding above

Natural Gas – Long-Term ViewNatural Gas is trading near a strong demand zone around 1.50 (major long-term low).
Price has already bounced and is currently hovering near 3.50, showing higher lows and gradual strength.
🔹 Key Levels
• Support: 1.52 – strong historical base
• Current Zone: ~3.49
• Major Resistance / Target: 9.

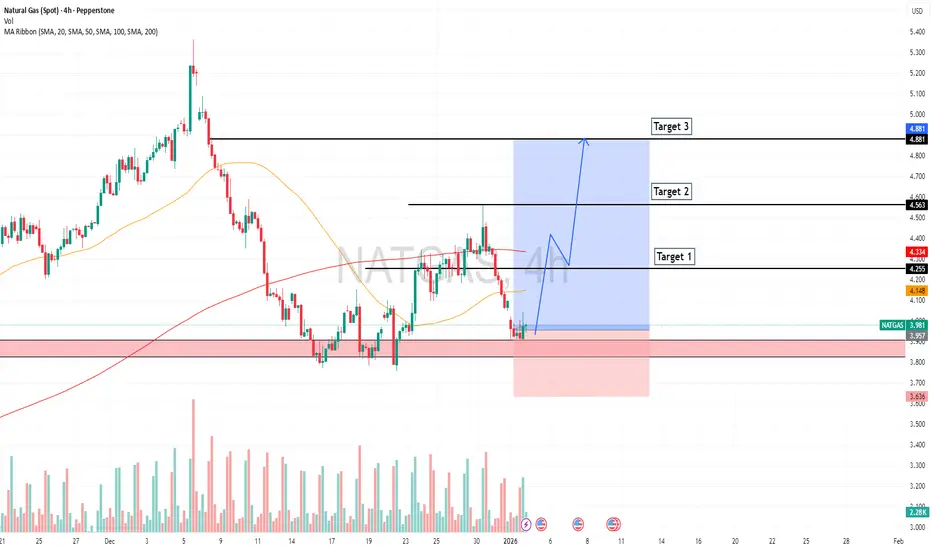
Natural Gas ReversalBullish factors: winter weather demand, stronger-than-expected storage draws, robust LNG exports, tightening supply/demand balance, and positive technical signals.
Bearish or caution factors: possible mild weather, strong production, and inventory levels at or around multi-year averages.
TP1 — 4.

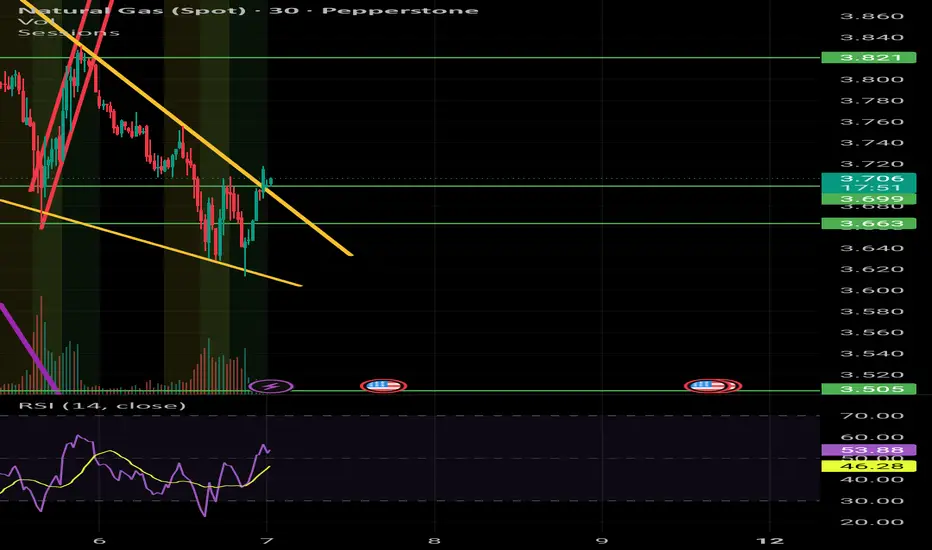
Natural Gas at Key Demand Zone | 1H Structure WatchNatural Gas is trading below a falling trendline, structure remains bearish.
Price is reacting near the 3.28–3.30 demand zone.
Above 3.28 with confirmation:
Possible pullback towards 3.45 → 3.60
Below 3.28 with acceptance:
Downside continuation towards 3.10 → 2.99
No rush.
Let price confirm near

NATTY BACK TO THE TOP! Well, this correction has been fun and I hope you guys were able to make money!
Weather model mafia have had their fun and have been able to flush out the market.
I believe we're going back to the top from this resistance area.
Here's a cup and a path! :D
The Natural Gas Will Jump from a Support LevelHello Traders
In This Chart Natural Gas HOURLY Forex Forecast By FOREX PLANET
today Natural Gas analysis 👆
🟢This Chart includes_ (Natural Gas market update)
🟢What is The Next Opportunity on Natural Gas Market
🟢how to Enter to the Valid Entry With Assurance Profit
This CHART is For Trader's that Want
US NATURAL GAS: STRUCTURAL DIGESTION AFTER A FAILED ADVANCEWeekly structure overview — educational, not predictive
🔹 CONTEXT
After a sharp multi-year decline, US Natural Gas attempted a recovery phase. However, recent price action shows structural hesitation rather than sustained trend development.
🔹 STRUCTURE SNAPSHOT
• Higher-degree trend: Corrective /

Asset AI Will Explode in 2026 (Hint: It's NOT Nvidia)Natural Gas is quietly setting up for the biggest trade of 2026. While everyone is watching tech stocks, a massive Falling Wedge pattern on the daily chart suggests NATGAS is bottoming out and preparing for a +100% rally.
In this video, I break down why the era of "cheap gas" is ending and how AI D

See all ideas
Displays a symbol's price movements over previous years to identify recurring trends.