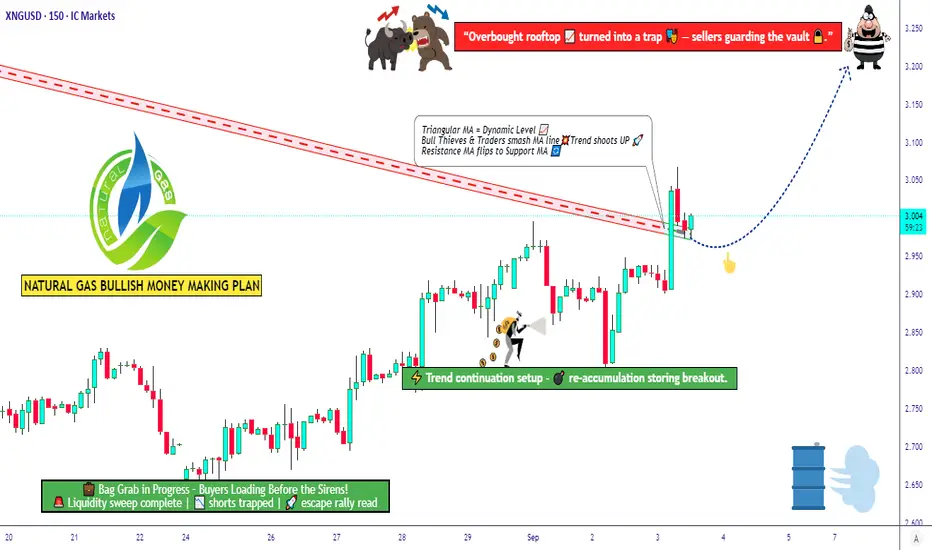
Natural Gas Market Outlook ‖ Bullish Breakout with Risk Control💎 XNG/USD Natural Gas – Thief Trader’s Money Loot Plan (Swing/Scalping) 💎
🎯 Trade Plan (Bullish Setup)
Strategy: Bullish triangular moving average breakout, aligned with Fibonacci 0.382 level.
Entry (Layered Style): Using multiple limit orders (Thief layering strategy). Example entries:
$2.900
$2.950
$3.000
(You may add more layers depending on your risk appetite.)
Stop Loss: $2.800 (Thief SL).
⚠️ Note: Adjust SL based on your own risk tolerance and strategy.
Target Zone: Major seller pressure expected near $3.400 — our escape target set at $3.200.
📌 Reminder: Take profit at your own discretion — you control your loot, not me.
❓ Why This Setup?
✅ Technical Basis: Bullish triangle breakout + Fibonacci 0.382 retracement signals continuation upside.
✅ Layered Entry Advantage: Reduces risk by scaling in across levels, catching volatility without FOMO.
✅ Market Structure: Current consolidation near $2.93 provides a solid base for accumulation.
✅ Sentiment Balance: Both retail & institutional lean bullish, supporting potential breakout momentum.
✅ Macro Tailwinds: Strong LNG export growth and expected winter heating demand underpin the long thesis.
This plan aligns both short-term technicals and long-term fundamentals, creating a high-probability swing/scalping opportunity.
🌟 Natural Gas (XNG/USD) Market Report - September 3, 2025 🌟
📊 Current Price Snapshot
Spot Price: $2.93 per MMBtu (Henry Hub benchmark) 📉
(Holding steady after recent dips, reflecting balanced supply/demand.)
😊 Trader Sentiment Outlook
Retail Traders: 55% Bullish 🟢 | 35% Bearish 🔴 | 10% Neutral ⚪
(Optimism from LNG demand + weather, but some concern on inventories.)
Institutional Traders: 60% Bullish 🟢 | 30% Bearish 🔴 | 10% Neutral ⚪
(Focused on exports & production stability, while cautious on oversupply.)
📌 Overall Mood: Mildly positive — upside potential if weather demand rises.
😨 Fear & Greed Index
Current Level: Neutral (Score ~50/100) ⚖️
Fear factors: Storage 5% above 5-year avg, mild summer demand.
Greed drivers: LNG exports + winter demand expectations.
Market vibe = balanced — neither panic selling nor euphoric buying.
📈 Fundamental & Macro Score
Fundamental Score: 7/10 🟢
Strong LNG shipments (31% growth expected).
Inventories manageable, production +3% YoY.
Key watch: Permian & Haynesville supply shifts.
Macro Score: 8/10 🟢
Rising global energy needs (AI, data centers).
Autumn cooling trend boosts heating demand.
Asia’s growth keeps exports flowing.
🚀 Overall Market Outlook
Bias: Bullish (Long) 🟢📈 — ~60% confidence.
Natural gas could push toward $3.60/MMBtu by late 2025 if balances tighten and exports expand.
Winter could spark extra upside rallies ❄️🔥.
🔗 Related Pairs to Watch
FXOPEN:XNGUSD
NYMEX:NG1!
ICMARKETS:XBRUSD (Brent Crude)
FOREXCOM:USOIL (WTI Crude Oil)
OANDA:XAUUSD (Gold for risk hedge)
TVC:DXY (US Dollar Index – inverse correlation play)
✨ “If you find value in my analysis, a 👍 and 🚀 boost is much appreciated — it helps me share more setups with the community!”
#XNGUSD #NaturalGas #SwingTrading #Scalping #CommodityTrading #EnergyMarkets #Fibonacci #BreakoutStrategy #LayeringStrategy #TradingViewAnalysis #ThiefTrader
NGAS.F trade ideas
XNGUSD, Accumulation to Expansion? Weekly Long Into Winter RiskI’ve initiated a long on Natural Gas from weekly structure. Price has rotated inside this area since ’23 and is now reacting at a confluence of trendline support + prior demand. The plan is to hold into Q4, when seasonality (heating demand + potential hurricane/LNG disruptions) often provides upside tailwinds. Risk is defined on the weekly chart; I’ll manage around swings and let the position work.
Technicals (Weekly)
• Range base reclaimed: Price is bouncing from the same 2023–2024 accumulation zone (roughly 2.5–3.0).
• Multi-touch trendline support: Current candle is reacting at the rising base trendline; wicks show responsive buying.
• Structure targets: First objective is a move back into mid-range supply; extension aims toward the upper band shown on the chart.
Fundamentals Supporting Long Bias
• Seasonality: Q4 typically brings rising Heating Degree Days across the Northern Hemisphere; winter risk premia often get priced ahead of the draw season.
• LNG pull: Ongoing ramp in global LNG demand + incremental U.S. export capacity tends to tighten the domestic balance on cold forecasts or unplanned outages elsewhere.
• Supply discipline: Gas rig counts have lagged after the 2024 price slump; that slower supply response can tighten later-year balances if weather cooperates.
• Weather & Gulf risk: Peak hurricane season can interrupt Gulf production and processing, periodically supporting price.
• Europe draw season: As EU storage transitions from injection to draws, import needs rise, keeping a bid under seaborne gas.
Trade Plan:
• Entry: From weekly support (see chart).
• Management: Trail below fresh higher lows on the daily; take partials at fib/structure levels; let a runner target the upper band if momentum broadens.
What Breaks the Thesis
• A persistently warm Q4, outsized storage overhang into winter, major LNG outages/delays, or a renewed surge in production that swamps demand.
Note: Please remember to adjust this trade idea according to your individual trading conditions, including position size, broker-specific price variations, and any relevant external factors. Every trader’s situation is unique, so it’s crucial to tailor your approach to your own risk tolerance and market environment.
U.S. Natural Gas Face Supply Pressures Amid Global ShiftsU.S. Natural Gas Face Supply Pressures Amid Global Shifts
U.S. natural gas futures climbed above $3 per MMBtu in early September, rebounding from a nine-month low of $2.73 on August 20 as expectations of lower domestic supply gained traction.
Fresh data revealed that Russian LNG exports fell over 6% year-over-year through August, boosting the U.S. share in global LNG trade as Europe and Asia sought alternative sources. This shift has intensified bidding competition for limited U.S. gas supplies, adding upward price pressure.
Storage levels remain tight, with EIA data showing a 3.4% annual decline. On the demand side, ExxonMobil projects global natural gas consumption to increase over 20% in the next 25 years, driven by the transition away from coal.
However, after the Labor Day weekend, U.S. futures slipped 3.5% to $2.893/MMBtu, retreating from Friday’s $3 test. Analysts note that the market is entering the low-demand shoulder season, but a sustained dip in supply could revive bullish momentum, potentially pushing prices above $3.00 later this month.

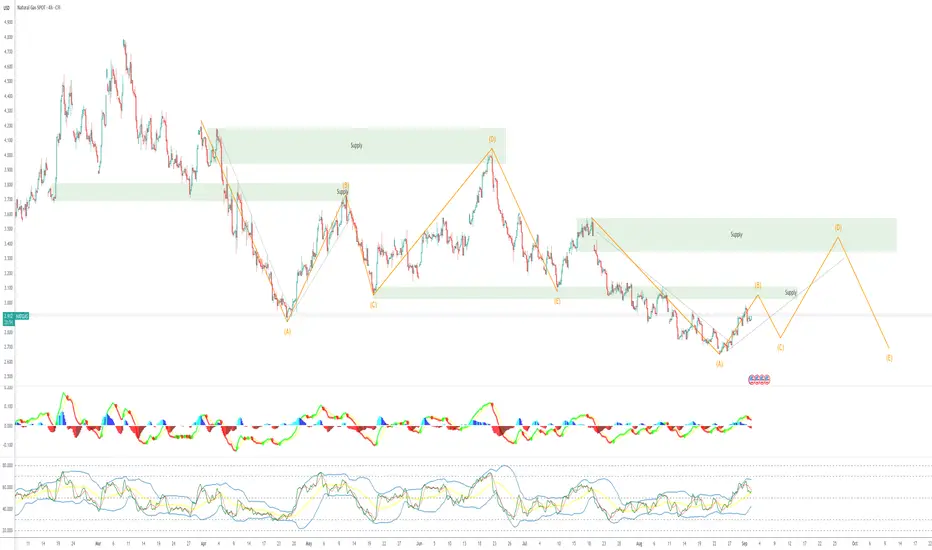
NATGAS Long SetupLong setup, targeting obvious supply and demand zones.
As you can see from this chart analysis, NATGAS is going for the next supply zone.
Long setup on Tue, the day I posted this with tight stop an nice target toward next supply level.
I give it an 80% probability it is going to next supply zone and correcting from there.
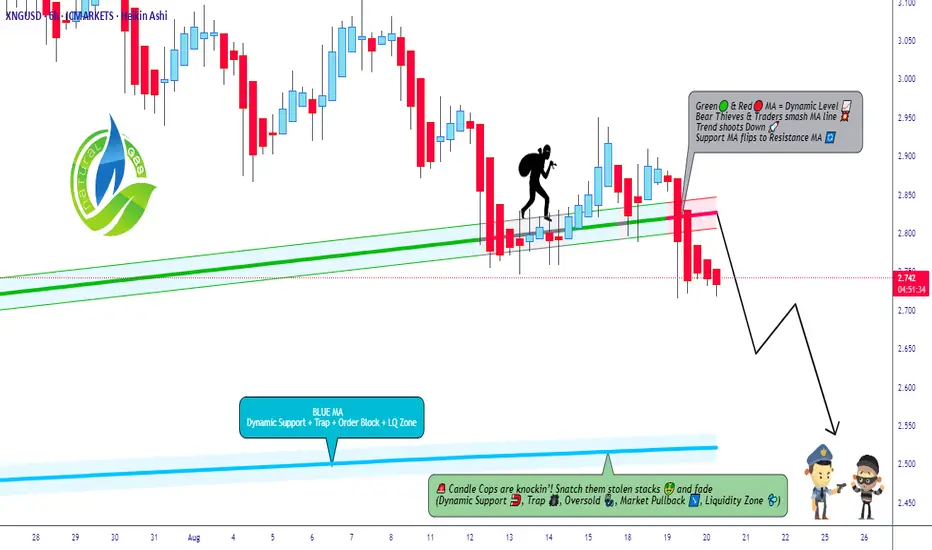
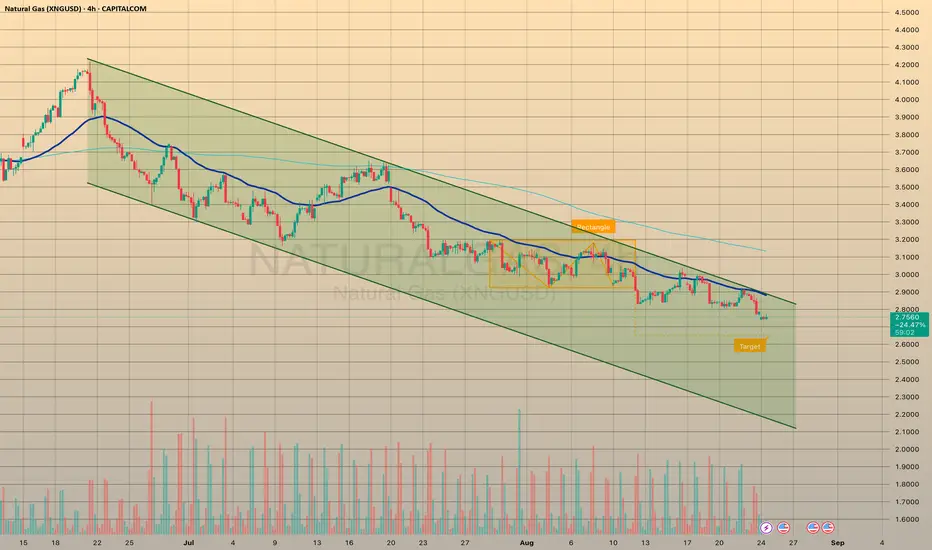
Natural Gas: The Bearish Raid is On! Are You In?🌟 ATTENTION ALL BLACK MARKET TRADERS & NINJA THIEVES! 🌟
(XNG/USD Natural Gas Heist Plan - Bearish Swing/Scalping)
Yo! 🐱👤🤑 The vault doors are creaking open on Natural Gas, and it's time for a BEARISH HEIST! Our intel suggests the big dump is coming. Police ain't around, so let's move! 🚓💨
🦹♂️ THE MASTER HEIST PLAN (BEARISH EDITION)
Asset: XNG/USD (Natural Gas) | Trade Type: Swing / Scalping Heist
Overall Bias: BEARISH 📉👊 (We're stealing on the way DOWN!)
🎯 ENTRY PROTOCOL: THE "LAYER" HEIST
For the OG Thieves who understand patience and precision. We're not chasing; we're setting traps!
🎪 ENTRY: Any price level is a gift! But for the pros, we're setting MULTIPLE SELL LIMIT ORDERS to layer our entry like a true market ninja.
🧨 LAYER 1: 2.740
🧨 LAYER 2: 2.770
🧨 LAYER 3: 2.800
Pro Tip: You can add more layers based on your own capital. More layers, more loot! 💰💰💰
🚨 STOP LOSS (The Getaway Car Engine)
This is where we bail if the cops show up. Don't be a hero.
🛑 THIEF S.L.: @2.950
📢 OG ANNOUNCEMENT: Dear Ladies & Gentleman of the shadow markets, adjust your SL based on your own risk appetite and strategy! Protect your capital! 🛡️
🏁 TARGET (The Escape Route)
The police barricade is set up down below. Our goal is to escape with the stolen money before we hit it!
🎯 T/P 1 (CASH OUT): @2.550 🚗💨
🚧 POLICE BARRICADE: @2.450 (Danger! Avoid this area!)
🔪 SCALPERS, LISTEN UP! 👂
If you're in and out quick, only scalp on the SHORT side. Ride those little downtrends for quick cash. Use a tight trailing stop to protect your mini-loot! 🏃♂️💵
⚠️ HEIST ALERT: NEWS LOCKDOWN 🚫📰
Big news = cops everywhere! It creates chaos and volatility. To avoid getting caught:
AVOID new trades during high-impact news.
USE Trailing Stops to lock in profits on running heists.
STAY STEALTHY. 🐱👤
💣 BOOST THIS IDEA! 💣
It fuels our underground network and helps us find the next perfect heist! Let's drain this market dry together! 🤑🤝❤️🎉
I'll see you in the shadows with the next score. Stay sharp! 🙈🙉🙊
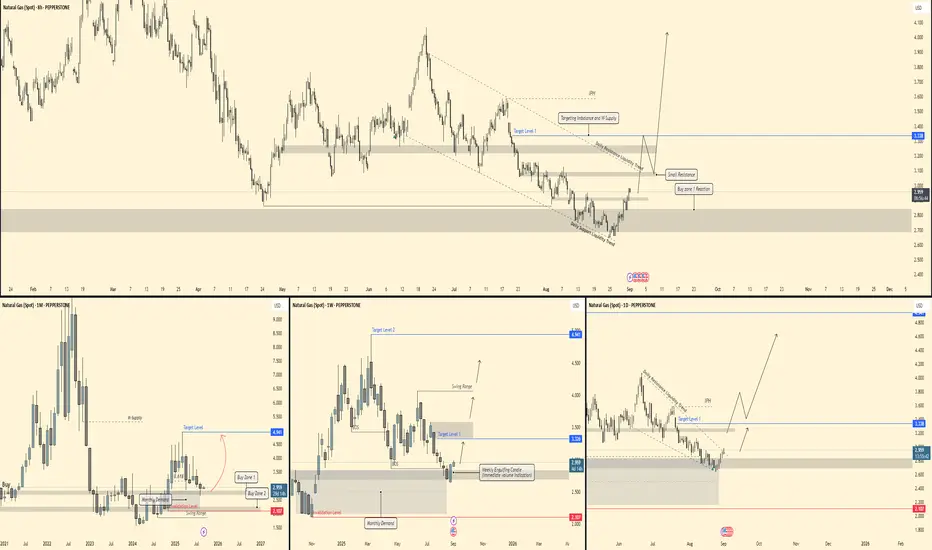
NATGAS - Targets acquired! Bullish Breakout! 📊 NATGAS – Multi-Timeframe Outlook
🔎 Monthly (1M)
Price has respected the monthly demand zone (2.1 – 2.3) with a strong reaction.
Structure still inside a wide swing range, but higher timeframe bias is shifting bullish.
Long-term upside targets sit around 4.9+, aligning with the top of the range and prior supply.
🕰 Weekly (1W)
Clear weekly engulfing candle confirming demand reaction.
Target Level 1: 3.3 – 3.4 zone (short-term imbalance/supply).
Target Level 2: 4.9+, lining up with range highs.
As long as price holds above 2.1 invalidation level, bullish continuation remains intact.
⏱ Daily (1D)
Current push showing strong momentum off support with liquidity trend building.
Immediate upside focus on 3.3+, where first supply/imbalance sits.
Expect retracements into demand zones to be respected as buying opportunities until major resistance levels are tested.
⏳ 8H
Price broke out of a descending channel, retesting the buy zone reaction area (2.8 – 2.9).
Upside liquidity targets at 3.3 in the near-term.
Smaller resistance noted, but structure favors continuation higher toward daily imbalance + supply zones.
🎯 Trade Plan
Bias: Bullish reversal from higher timeframe demand
Entry Zone: 2.8 – 2.9 (buy zone reaction)
Targets: 3.3 (short-term), 4.9 (long-term swing)
Invalidation: Break below 2.1 demand base
Natural Gas is in the Buying DirectionHello Traders
In This Chart NATGAS HOURLY Forex Forecast By FOREX PLANET
today NATGAS analysis 👆
🟢This Chart includes_ (NATGAS market update)
🟢What is The Next Opportunity on NATGAS Market
🟢how to Enter to the Valid Entry With Assurance Profit
This CHART is For Trader's that Want to Improve Their Technical Analysis Skills and Their Trading By Understanding How To Analyze The Market Using Multiple Timeframes and Understanding The Bigger Picture on the Charts
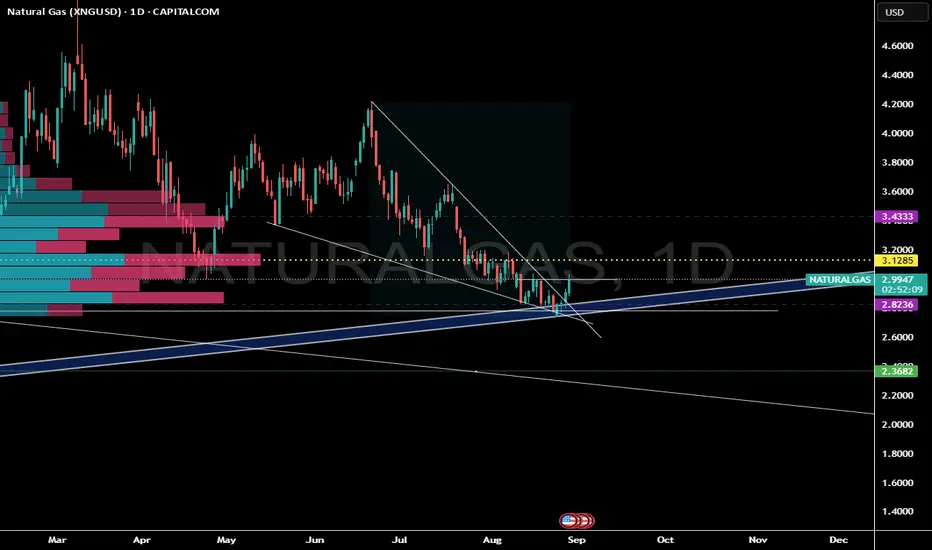
Nat gas impulse waveNat gas after finishing the WXY correction week cicle ends wave 2 correction.
correction final in 62% all movement and also reacting in a pivot level for the months demand zone. Also we close to winter in USA .
Start now the big 3 wave !!!!

NatGas Nears the End of Its DiagonalNatural Gas appears to be in the final stages of a large ending diagonal pattern.
Wave (4) can be complete. However, judging by the supply zones and moving averages, we can expect one more leg up before the final decline begins.

NATGAS LONGPrice has come into an area of support and liquidity has been taken indicating to that the accumulation is indeed in the last phases

Natural Gas ( 30 Min EMA Cross over)I have taken this trade on a 30-minute chart frame. And used stop loss on the 4-hour chart. Because I don't want my trade to close because stop loss was too close.
The key factors that made me to take this trade.
1. The natural gas is bearish on longer daily and weekly trend.
2. i think the small crossover on 30 minute on the down side will help the cause.
3. Only worry here is that how long it pull backs into bullish direction, before it resumes its bearish bias. For that purpose, I have set up the stop loss on 2 hour time frame and above recent highs.
Should know the outcome of this trade next week.

NATURAL GAS: Stunning breakout!Natural Gas has had a wonderful move off the lows.
Breaking out of a falling wedge pattern on inventories.
Inventory report supports higher price. 27B exp build vs 18B actual.
If you have been following our analysis you would have ought to have know to start accumulating into the key weekly gap fill zone.
We have been pounding the table on resource stocks showing relative strength compared to the underlying commodity.
Our members have received several alerts via: AMEX:BOIL , NYSE:EQT NYSE:AR NYSE:RRC and others. We have netted some wonderful profits and it looks like Nat Gas should climb higher after some near term consolidation.
I would like to see Nat gas retest the major volume shelf (POC). That level should be monitored closely.
LNG Week 35:Fill Rate Holds Steady Above Median for Previous 5Y This LNG analysis was prepared by Dr. Igor Isaev in cooperation with Anastasia Volkova, LSE analyst.
Current prices vs. price spread 10 days before expiration by month since 2010
(The top left graph)
Over the past week, the gas price has been downtrending. The NGU25 contract expired 7% lower and the next contract NGV25 is trading 5-7% below the average price 10 days before expiration for all expired contracts over the previous 15 years. NGX25 is trading near the median. The 2026 and 2027 contract prices are virtually unchanged from last week and are trading at or below the upper quantile boundary for almost all months.
Current forward curve vs. 2020-2024
(The top graph in the middle)
The shape of the forward curve is flattening out and resembling closer and closer the curve on the same calendar day of 2023, 2024 annual curves. This is especially noticeable on contracts with delivery 3 years from now and beyond. The divergence on near-term contracts is still large.
Current inventory and forecast for next week compared to 2019-2024
(The top right graph)
For week 34 (Aug 18-24), a +34BCF gain in storage was recorded. Fill rate is holding steady above the median for the previous 5 years. Injection rates remain positive, which removes the risk of shortages due to the imminent start of the pumping season and contributes to downward price pressure.
Weekly HDD+CDD total from current NOAA data and forecast for the next two weeks comparing 1994-2024
(The lower left graph)
In the overall continental cross-section, the past week 35 weather was well below average values observed over the past 30 years. Next week (36) HDD+CDD values are also expected to be well below average, contributing to lower electricity demand for air conditioning to downward price pressure.
Explanation of the chart: candles represent quantiles for 30 years from 1994 to 2024. Red dots 2024, green 2025, blue prediction 2025
Weekly HDD+CDD total from current NOAA data and forecast for the next two weeks compared to 1994-2024 by region
(The lower graph in the middle)
The projections by major regions are consistent with the overall picture: HDD+CDD values are below the average level based on observations over the past 30 years.
Weekly cumulative supply/demand differentials compared to 2014-2024
(The lower right graph)
For the third week in a row, the supply/demand differential held above the upper 10-year range. Production is holding strong, imports from Canada are down, exports to Mexico and LNG exports have recovered, while electricity demand is seasonally down slightly. The latter is additionally impacted by weather and industrial demand patterns and is holding at average levels.

nGas + 15%The fundamental inventory deficit, confirmed by the EIA report (+13 Bcf), is a strong bullish factor.
The COT report also indicates a bullish sentiment among speculators.
Managed Money net = –36,687 - the background is short. However, shorts have been reduced by –17,614, and the net short has decreased by +14,046 WoW, which is a clear sign of short covering. At the same time, longs have decreased slightly (–3,568).
If the price continues to trade near the $2.65 support, this creates a dissonance between powerful fundamental signals and local market behavior. The test of the key support of $2.65 is a good entry point for a long position.
The price is in the descending channel (from July 23). The lower boundary of the channel coincides with the key support of $2.65. The $2.65 - $2.70 zone is a strong zone of liquidity and potential stops.
Entry - Breakout of 2.65 and consolidation above $2.70 or rebound from $2.65 with confirmation. Looking for a false breakout or a confident retest.
News to watch:
1. EIA (28 Aug 14:30 UTC) - Deviation from 5-year and South Central contribution. Repeats of weak injection will boost the chance of a squeeze to 2.88 and 3.00
2. CPC 6–10/8–14 - Whether the warm anomaly will continue (CDD support).
3. LNG feedgas - A return to ≥16.5–17 Bcf/d will return fundamental support.
4. COT (29 Aug ~19:30 UTC) - reduction of net "short" Managed Money = fuel for long squeeze.
Conclusion: the background remains "bearish", but the risk of long squeeze is increased - any bullish event (weak injection of EIA, growth of feedgas, warm weather) can sharply accelerate the upward movement.

BULLISH BUTTERFLYBullish Butterfly with perfect harmonic measurements completing at previous low
Target one - 2.42
target two - 2.92
target three - 3.5
stops just below the low zone
4.5 x 1 = risk to reward
good luck traders
its been awhile, I have returned.

50/50 lolit may hit, it may not. 50/50 . dont trust this tho its just a test. 😂 im not gonna say much except that we are still few hours away from finishing contract rollover so it will be swinging today. this is only for Wednesday the 27th
but in all seriousness we will be going up soon!

U.S. Natural Gas Hits 10-Month Low on Cool Weather OutlookU.S. Natural Gas Hits 10-Month Low on Cool Weather Outlook
U.S. natural gas futures slipped to $2.70/MMBtu, the lowest since November 2024, as cooler weather and weaker late-summer demand eased storage concerns. September NG1! fell 0.1%.
Analysts say strong power demand and limited injections expected earlier won’t materialize. Forecasts show below-normal temperatures for the next two weeks, while LNG exports rose to 15.9 bcfd in August. Lower-48 gas output hit 108.5 bcfd, near record highs.
Despite a smaller-than-expected storage build last week (+13 bcf), ample supply and higher production keep pressure on prices. U.S. LNG exports are projected to grow 10% annually through 2030, even as oil output plateaus.
European gas futures also slipped 1% to €33.5/MWh as Norway’s maintenance impact eased and storage builds continue ahead of winter.

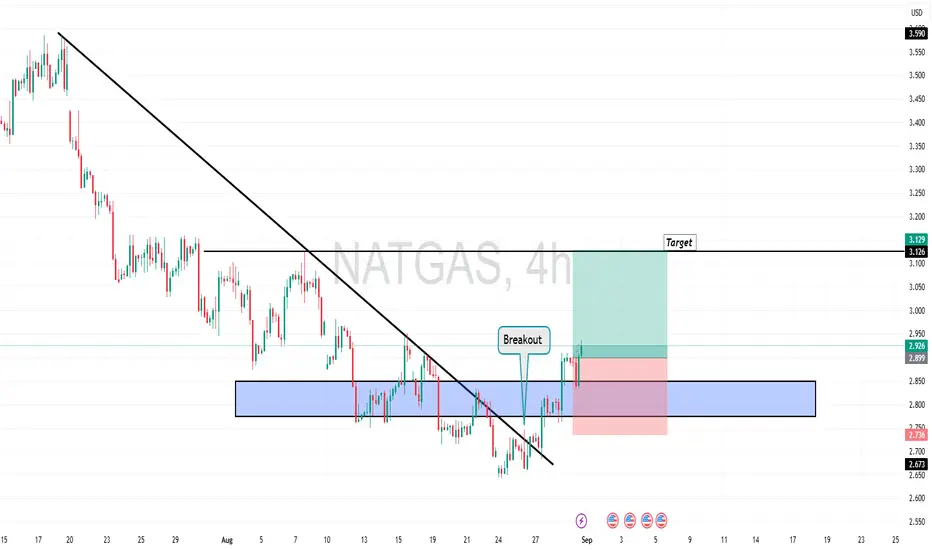
2 Month Descending ChannelSeptember natural gas futures plunged to a nine-month low on August 22, dropping 4.5% amid near-record output, ample storage, and cooler weather reducing demand. Despite a rebound in LNG exports, prices have fallen for five straight weeks, down 24% overall.
Record U.S. production in August averages 108.4 bcfd, while storage remains 6% above normal. Demand, including exports, is expected to ease in coming weeks, with LNG feedgas rising to 16.2 bcfd as plants recover from outages. Hurricane activity in the Atlantic poses no immediate threat to U.S. supply. Analysts expect U.S. LNG exports to grow about 10% annually through 2030.
Natural gas is in the Selling directionHello Traders
In This Chart NATGAS HOURLY Forex Forecast By FOREX PLANET
today NATGAS analysis 👆
🟢This Chart includes_ (NATGAS market update)
🟢What is The Next Opportunity on NATGAS Market
🟢how to Enter to the Valid Entry With Assurance Profit
This CHART is For Trader's that Want to Improve Their Technical Analysis Skills and Their Trading By Understanding How To Analyze The Market Using Multiple Timeframes and Understanding The Bigger Picture on the Charts

Natural Gas: Bullish MomentumNatural gas has shown solid upward momentum, and the market looks ready for further gains. A long entry from the current level seems reasonable.
📝Trading Plan
🟢Entry: current price
🔴Stop: 2.84
🎯Target: 3.00

LNG: Conditions Reached 30Y Median & Moderate Storage IncreaseThis LNG analysis was prepared by Dr. Igor Isaev in cooperation with Anastasia Volkova, LSE analyst.
Current prices vs. price spread 10 days before expiry by month since 2010
Total monthly price decline exceeded 17%. Near-term contracts NGU25, NGV25 are trading 3-5% below the average price 10 days prior to expiration for all expired contracts over the previous 15 years. NGX25 has reached the median. Prices of 2026 and 2027 contracts are also declining and are already trading at or below the upper quantile boundary for almost all months.
Forward curve vs. 2020-2024
The shape of the forward curve flattens out and comes closer and closer to the states of the curve on the same calendar day of the year as the curves of 2023, 2024. This is especially noticeable on contracts with delivery in 3 years and beyond. On contracts closer the divergence is still large.
Current inventory and forecast for next week compared to 2019-2024
For week 33 (Aug 11-17), we expect a +14BCF gain in storage. Fill rates are holding steady above the median for the previous 5 years. Injection rates remain positive, which reduces shortage risks and contributes to downward price pressure.
Weekly HDD+CDD total from current NOAA data and forecast for the next two weeks comparing 1994-2024
In a continental cross-section, the current week 34 weather is holding at the same level as the average values observed over the past 30 years. Next week (35), HDD+CDD values are forecast to be well below average, contributing to lower air conditioning electricity demand and downward price pressure.
Explanation of the chart: in candlesticks quantiles for 30 years from 1994 to 2024. Red dots 2024, green 2025, blue prediction 2025
Weekly HDD+CDD total from current NOAA data and forecast for the next two weeks compared to 1994-2024 by region
Forecasts by major regions are consistent with the overall picture. Temperatures are expected to be slightly above normal in week 34 in the Eastern, Western regions followed by a decrease in week 35. In the PACIFIC region, values remain high. On the contrary, the Atlantic regions are below normal.
Weekly cumulative supply/demand difference compared to 2014-2024
For the past 2 weeks, the supply/demand differential has held well above the upper 10-year range. Despite record production levels, total natural gas consumption also increased due to electricity demand, the industrial sector and LNG exports.
Buy the dip on natural gas For a swing trade Natural gas seems very you know touching the most happening support line and it might bounce back from 2.7 to 3.8 a very good you know you can capture to make money thank you so much for watching it's not investment advice

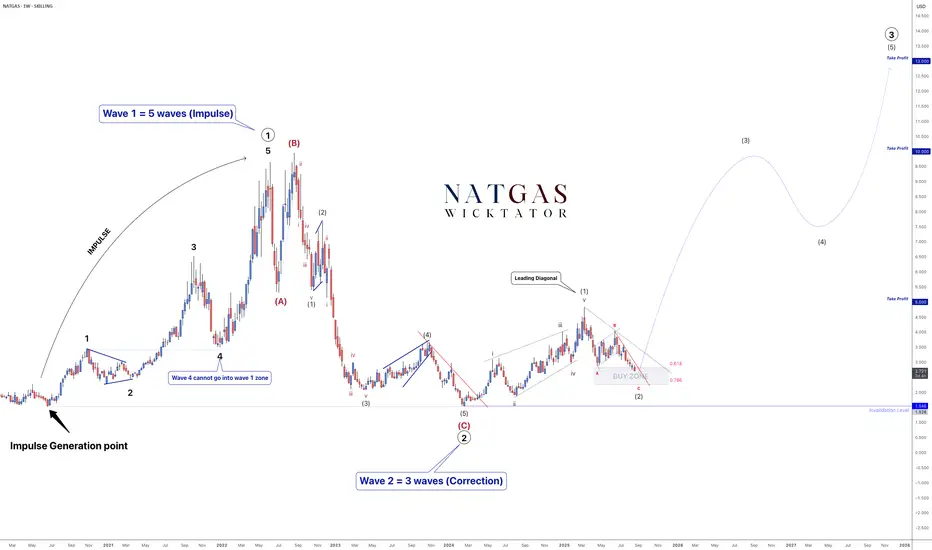
NATGAS - Catch The Impulse!As Wave Traders, our job is to spot corrections and catch the impulse, because that’s where the biggest moves happen.
On NATGAS, we completed Wave 1 with a leading diagonal, and are now finishing Wave 2 (an ABC correction). Once corrections are done, the next phase is Wave 3 - historically the longest and strongest wave in Elliott Wave Theory.
We've almost completed wave 2 and looking for a breakout for wave 3, which is the longest wave.
Trade Idea:
- Watch for break of the red trendline to indicate the start of wave 3
- enter with stops below breakout or below invalidation
- Targets: 5, 10, 13
NATGAS 12H Chart:
We'll be looking to enter on break of the red trendline with stops below breakout.
This setup is a textbook example of how Elliott Wave helps us prepare - not chase - the market.
Goodluck and as always, trade safe!