Natural Gas - Epic Trade SetupNatural Gas is potentially setting up a blow off top move into its Thursday inventory report.
This chart pattern rally is looking very similar to what we saw last Thursday when Nat gas had a 6.6% range decline from the high pivot it made off of inventories.
If we get a blow off top move on Thurs
About Natural Gas (Henry Hub)
Natural Gas (NGAS) is a fossil fuel formed from plants and animals buried underground and exposed to extreme heat and pressure. Natural gas is used domestically for cooking, as a power source, in agriculture, and in industrial manufacturing. Natural gas prices fluctuate constantly depending mainly on production issues, stockpiles, weather conditions, economic growth, crude oil prices, and more recently coal. Natural gas is commonly measured in MMBtu, with 1 MMBTu equaling 1 million BTU (British Thermal Units).

Natural Gas: Buy The Rumor Sell The NewsNatural gas spiked higher in the morning session on a strong inventory report.
Natural Gas inventories came in at 53B vs 66B est.
This report is showing a greater demand likely due to the colder temps.
In the afternoon Natural Gas reversed from the highs and sold off.
Ending the day with a D

Gas prices surge on cold forecastsGas prices surge on cold forecasts
On Oct 7 european natural gas jumped to a six-week high, extending a sharp rally as colder weather forecasts and weaker renewable output boosted heating demand expectations. Temperatures in France and Germany are set to fall about 2°C below seasonal norms from mid
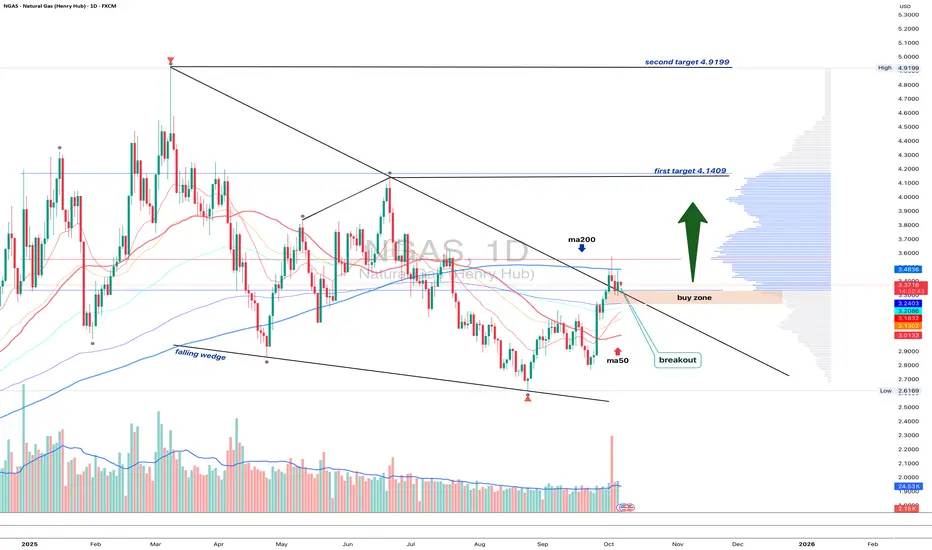
NGAS 1D - bulls waiting for the green lightOn the daily chart, Natural Gas has broken out of a falling wedge, but price remains below the MA200, while EMA still hovers above it - a mixed signal showing short-term hesitation within a longer-term downtrend.
The 3.10–3.20 buy zone remains key - that’s where the retest area aligns with short-te
Natural Gas Price Hits 2.5-Month HighNatural Gas Price Hits 2.5-Month High
As the XNG/USD chart shows today, natural gas prices have risen above $3.600/MMBtu for the first time since mid-July.
According to media reports, the rise in gas prices has been driven by:
→ Weather models forecasting colder conditions, suggesting the heating

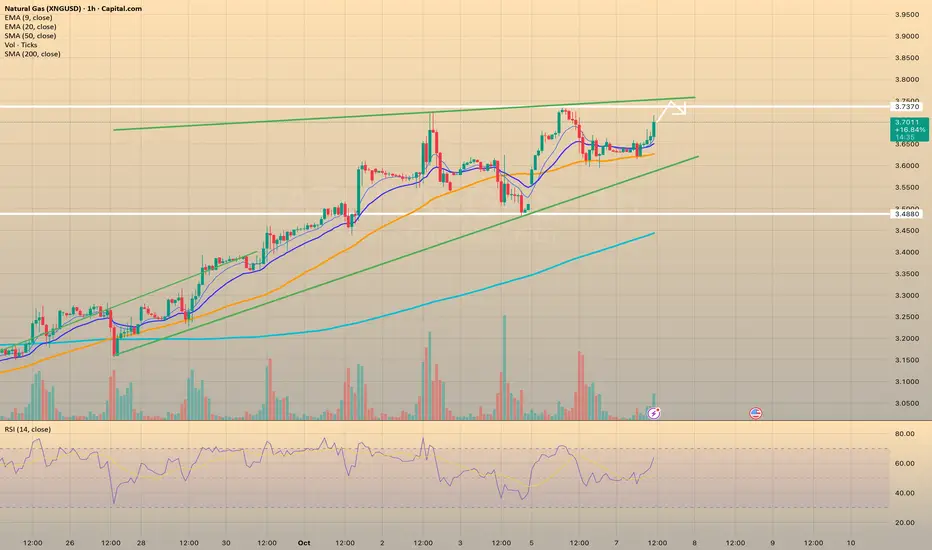
Natgas sell zone reaching🚨 XNG 15-min Chart Update
Max Upside: 3.698
Action: Selling recommended around 3.698
Buying: Not advised at this level
Reason: Price likely to drop from resistance; shorting gives better risk-reward
📌 Trade safe & use proper stop-loss!

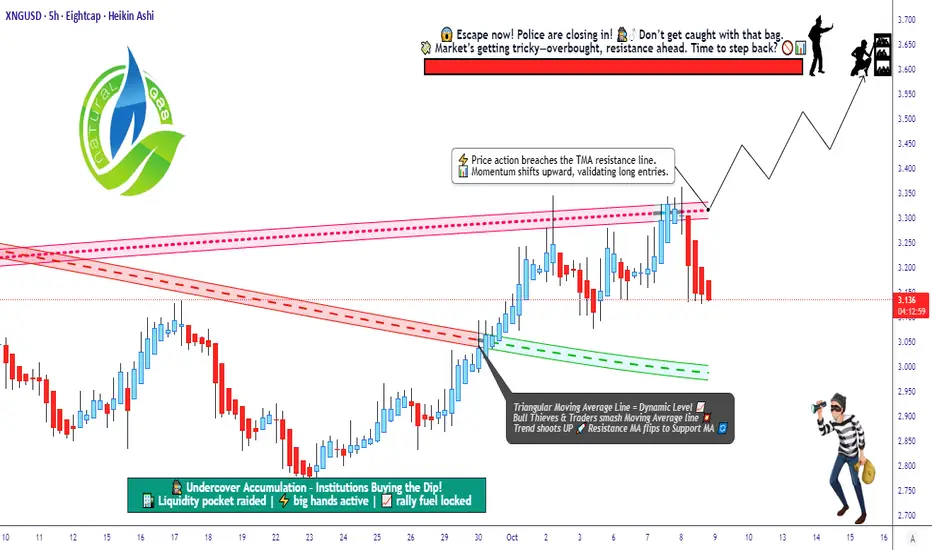
Is This the Start of a Fresh Bull Run in Natural Gas (XNG/USD)?🎯 XNG/USD Natural Gas: The Great Energy Heist! 💰⛽
📊 Market Overview
Natural Gas is setting up for a classic "Ocean's Eleven" style breakout! The 382 Triangular Moving Average has been breached by the bulls, and the trend confirmation is IN. Time to plan our strategic entry into this energy market op
"Natural Gas: Sell the Weather Spike, Eyeing 3.600 Retracement"💡 NATGAS Sell Setup (Swing/Short-term Idea)
Current Zone: 750–800 (upmove driven by short-term weather forecast & low inventory)
Context: Compared to last year’s levels, Natgas is already trading in overbought territory.
View: A retracement is highly probable from this zone.
Target: Expect downs

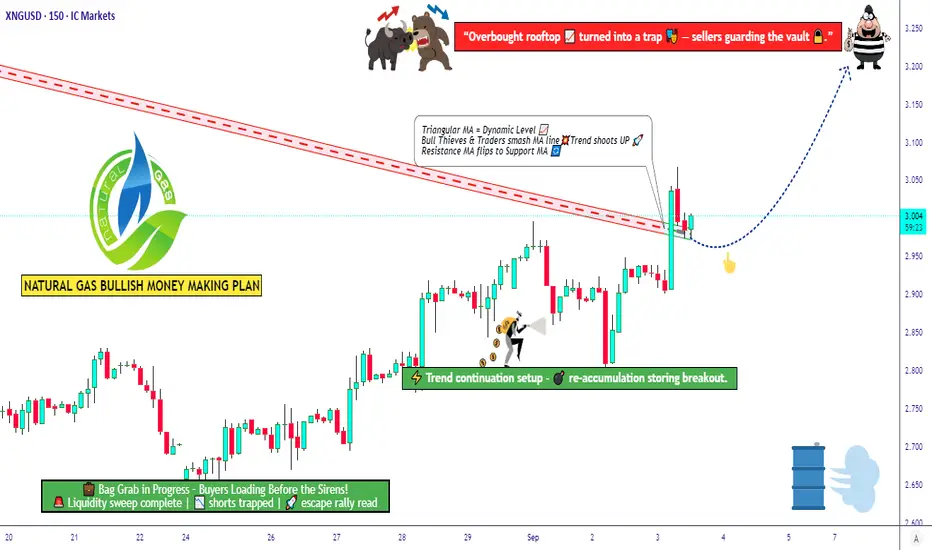
Natural Gas Market Outlook ‖ Bullish Breakout with Risk Control💎 XNG/USD Natural Gas – Thief Trader’s Money Loot Plan (Swing/Scalping) 💎
🎯 Trade Plan (Bullish Setup)
Strategy: Bullish triangular moving average breakout, aligned with Fibonacci 0.382 level.
Entry (Layered Style): Using multiple limit orders (Thief layering strategy). Example entries:
$2.900
$2.95
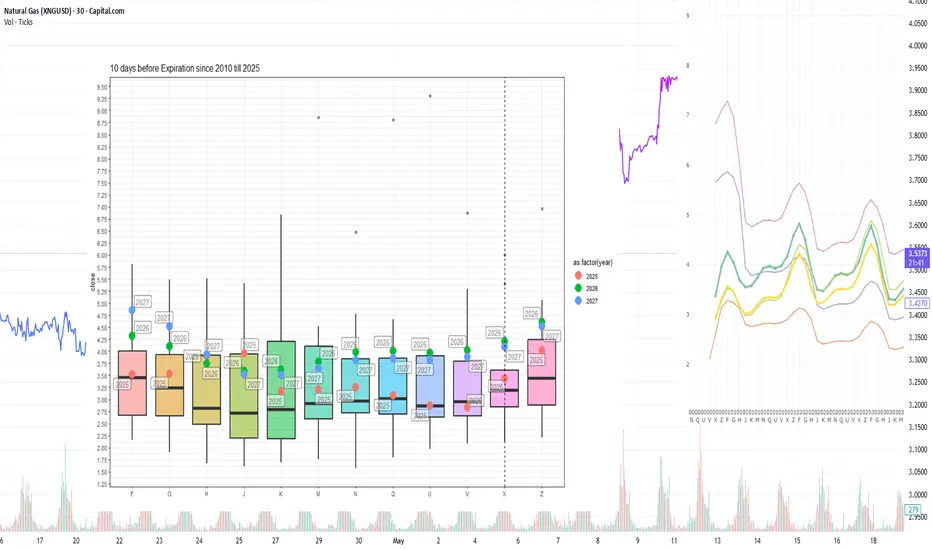
LNG Week 40: 64 BCF Storage Boost Meets Cooling Demand Drop*Due to the platform's features, the charts are arranged in sequence from left to right, from the first to the Eighth chart.
Current prices compared to price dispersion 10 days before expiration by month since 2010
The next NGX25 contract is trading above the 10-day average level before expira
See all ideas
Displays a symbol's price movements over previous years to identify recurring trends.