EME heads up at $800 then 838: Double Golden fibs to make a TOP?EME has been flying high on AI infrastructure spending.
It is about to hit Dual Golden fibs at $800.61 then 838.71
Look for a stall of the uptrend or a retrace from these fibs.
See "Related Publications" for other examples of Golden fibs in action ------>>>>>
Trade ideas

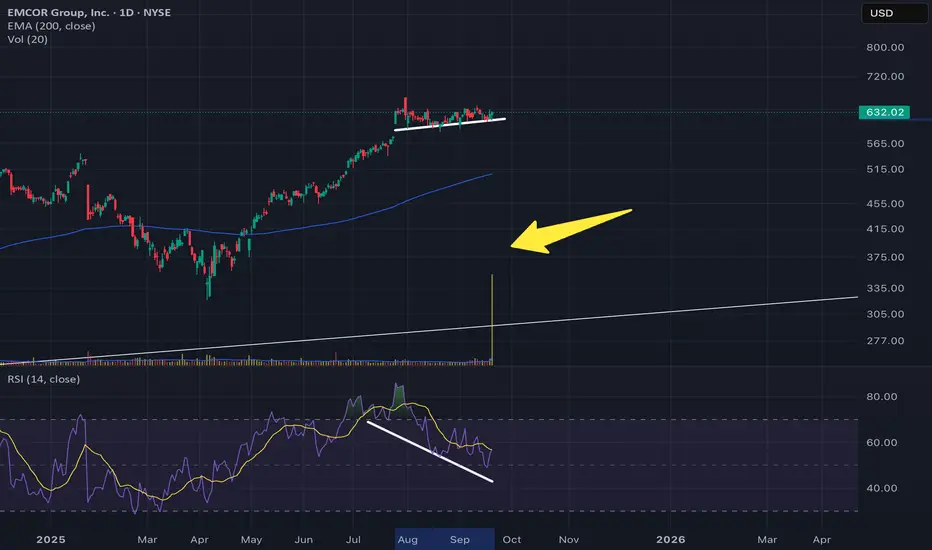
EMCOR (EME) Hidden RSI DivHidden RSI divergence on the daily chart + a HUGE bullish volume spike = volatile move coming (perhaps).
Price has been consolidating for the past 60-ish days, with a growing RSI div on the daily chart. The sudden spike in bullish volume has me wondering if someone/ some people are front-running an imminent breakout.
Will be watching this one to see what happens over the next couple of weeks.
DYOR, NFA
MY WATCHLIST: EMECLS, an IBD50 stock now has a setup signal. Has an excellent risk-to-reward ratio. I'm looking to enter long near the close of the day if the stock can manage to CLOSE above the last candle highs(1). If triggered, I will then place a stop-loss below(2) and a price target above it(3).

SLOW down Bearish mode from last three candlesThe chart is over-extended, overbought, and slowing down. I could see a retrace back into the lower 400s, if not upper 300s, before retests.

✅ STOCK REVIEW: $EME booked +17% profits EME serves as an instructive case for two main reasons. First, entering the position required multiple attempts, with initial purchases on November 27th proving premature, leading to exits on December 21st and January 2nd at minor losses. A successful re-entry was made on January 18th, marked by a orange bubble, with an additional purchase on January 29th. Given the intraday volatility, I was stopped on the add alone on the January 29th.
The second notable aspect of EME was its consistent performance. Instead of rapid spikes, it steadily climbed, yielding a 20% gain over 19 days with minimal retracement. This exemplifies the preferred behavior for our investments, favoring steady growth over volatile surges. A partial sale was executed on February 13th for a 7.90% profit, and the remaining shares were sold on February 23rd for a 17.39% gain, as the stock became overextended.
Post-second purchase, the technical action mostly showed confirmations over violations, highlighting the stock's steady ascent without significant pullbacks. This emphasizes the value of patience and adherence to a stock demonstrating consistent, positive movement, allowing for substantial gains with reduced volatility.

UptrendOn Monday we have left the sideward movement and begun a short term uptrend. Yesterda's rise has been corrected now and we may continue rising now.
