SPOT Inverse Head and ShouldersInverse head and shoulders with a slanted neckline
First target sits at $280
Second target @ $300
Trade ideas

SHORT SPOTLooks like completed correction on upside and now heading down, stop loss should be respected, in the event final correction leg is still on-going.

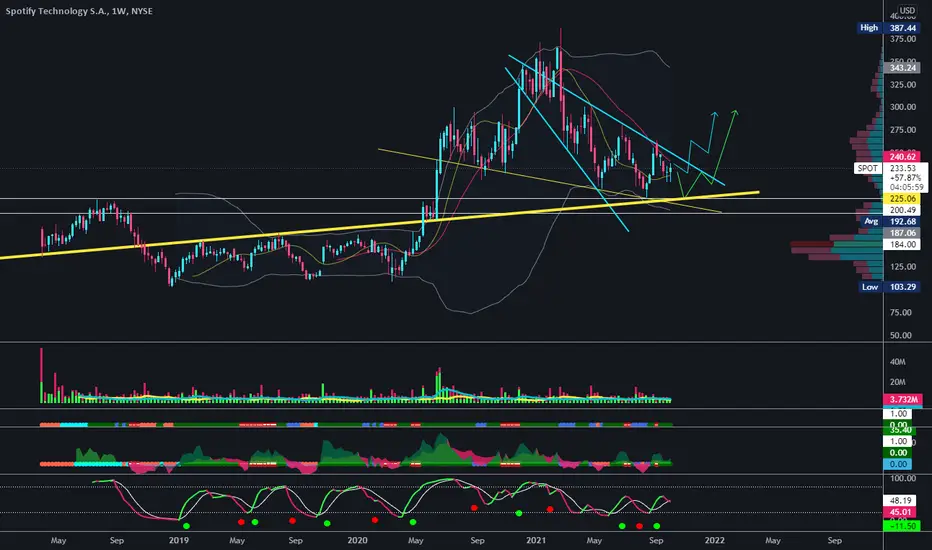
SPOT Weekly chartWith earnings coming on the 27th, look at the triple bottom and stochastic's divergence. I'm interested to see the price action after earnings, it maybe wiser to wait till after earnings.


SPOT - SPOTIFY WEEKLY - DOWN THEN MOON? OR MOVE WITH ER?All,
My two paths I see happening (personally green more likely I think)
Spotify I see as a "wait and see" day by day. ER is 27th and they are almost positive margins. Spotify on flip side has shown to be a flip flop on ER. 2 good / 2 bad etc. Without a doubt $196 if it does go there will be a massive boost and take it out of the pattern almsot gauranteed. I actually hope it dips there because its a very obvious support confluence there that can't be ignored. RSI etc all sort of indicate it isnt done going down, but ER being so close may trade sideways instead and hold these levels.
Either way add alerts in low $200s and watch it via daily next week week and a half.
$SPOT#SPOT
Spotify has been struggle for quite a long time now and many people are pretty bearish on Spotify but when everybody’s bearish what does that mean?
Spotify’s been on a downward spiral since it’s highs back in early February.
When we zoom out and look at the higher timeframe previous resistance is now currently holding as support which could give a good opportunity.
Keep your eyes open around these levels.
MACD sitting below -10
RSI below 50.
Watchlist this.
- Factor Four

SPOTwaiting the market open, using support & ressistance, fib, and gann fan, the chart will follow the trading plan. :)

$spot - Chart requestHere was a request - Spotify. Crazy swings we are seeing
From a massive breakout rally, then into a huge flush, where is this going. Well to me it looks like we are going down for a wave 2 to backtest that breakout. That is a great R/R level to go long. Here we are right between the 61.8 and 76.4 retracement (good zone to find wave 2 support) and we have the 100 extension of our wave Y sitting at 221. The red circle should be where this finds bottom if it goes slightly lower.
If this bull count is correct SPOT could see a huge rally up into the 300's by year end. Market is going to need to play ball most likely though, otherwise this could fail back under the trendline support. Time will tell, but I hope that you bulls get your 300+!

SPOT is going to check demand zoneSPOT is going to check demand zone and RSI oversold zone until November. Target 197$

SPOT short: Retesting neckline of head and shoulders. PT: $173Head and shoulders on monthly chart clearly seen here. Enter on retest or wicks above the neckline. The measured move would be a 55% fib retracement from all time highs. Timeframe: 1-1.5 years.

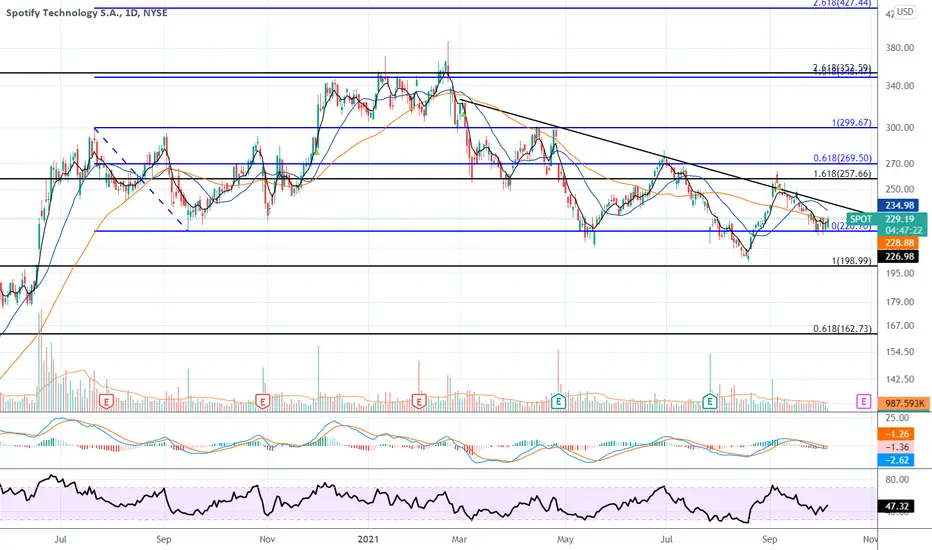
$SPOT TALooking at $SPOT we can see a descending wedge. A bullish pattern however we are just needing to confirm a breakout of trend. With the $AAPL news may be the catalyst it needs. In my personal opinion based off of RSI and TTM squeeze, I believe we will see a cool off of buyers before jumping into another run. All of this will be determined by $SPY. I believe we will see $SPY red/chop until Tuesday(9/14/21) before reversing off of daily trend respecting the ascending wedge. If $SPY runs red and we see a daily close on $SPOT below 245.50 I will play shorts, however, if we see green on $SPY and a hold above 245.50 we see green. A break and hold of 245.50 would be an early entrance a safer entrance for longs would be a break and hold of 255.50.
Would love to hear your opinion on this TA!


SPOT Newbie Analysis [5 Sep 2021]I know a lot of traders are bullish on this, however I can't see the breakout of the downtrend yet.
Any advise?
Wait for price confirmation or enter with a tight stop loss.
- Current price 251.23 is still within the two downtrend Line.
- Current price hit resistance on 150/200 Daily EMA.
- Daily still show strong bullish candle.
I was in a lost trade during the downtrend, and manage to turnaround and sold it at a good profit during the trend reversal. Re-entry and sold it off again on 3 Aug when there is a slight pullback.
Trying to learn to put in more effort in risk management after few lost trades.
Plan
Thinking to enter the trade at suport level between 243.32 - 246.18 with a tight stop loss.
If it goes well, it should go above 277.67, otherwise a bearish double top will form.
Stop Loss
-3
Price Target
- 277.67 (previous high)
This is not financial advice.
Please be kind, I am really new and welcome constructive feedback:)

Spotify - Breaking Out of the Downtrend ChannelSpotify looking to finally break out of the 6-8 month long downtrend channel. Picked some up at $221 price range. May pick up more if we retest the channel lines for support level.
Feel free to give us a follow and shoot us a like for more analysis updates.
Cheers!
Disclaimer:
I do not provide personal investment advice and I am not a qualified licensed investment advisor. I am an amateur investor.
All information found here, including any ideas, opinions, views, predictions, forecasts, commentaries, suggestions, or stock picks, expressed or implied herein, are for informational, entertainment or educational purposes only and should not be construed as personal investment advice. While the information provided is believed to be accurate, it may include errors or inaccuracies. I will not and cannot be held liable for any actions you take as a result of anything you read here.
Conduct your own due diligence, or consult a licensed financial advisor or broker before making any and all investment decisions. Any investments, trades, speculations, or decisions made on the basis of any information found on here, expressed or implied herein, are committed at your own risk, financial or otherwise.
Feel free to give us a follow and shoot us a like for more analysis updates.

SPOT broke past the 30 day MA, whats next?SPOT has been gaining traction lately after being in a downtrend for some time. Bollinger Bands indicating a 247 resistance which matches around with the volume shelf. I could go far as to say SPOT might get to 260s before letting the volume shelf around 245 act as support before the next leg up.

Spotify Analysis 28.08.2021Hello Traders,
welcome to this free and educational analysis.
I am going to explain where I think this asset is going to go over the next days/weeks and where I would look for trading opportunities.
If you have any questions or suggestions which asset I should analyse tomorrow, please leave a comment below.
I would also appreciate, if you would smash that like button and help me to create more free analysis like that.
Thank you for watching and I will see you tomorrow!

$SPOTA lot has happened to Spotify during the last year.
The stock soared over 165% and reached $364 in February. Since then, the stock price has declined by over 40% since.
Spotify continues its global dominance, adding 27 million net subscribers between Q1 2020 and Q1 2021, more than any other single service. However, it lost two points of market share over the period because its percentage growth rate trailed that of its leading competitors. \
Google was the fastest-growing music streaming service in 2020, growing by 60%, with Tencent second at 40%. Amazon continued its steady trajectory, up 27%, while Apple grew by just 12%.
But moving onto the technical side of things.
Spotify is a classic example of previous resistance now acting as support.
Price closed on a hammer on the weekly.
MACD curling w/ the RSI above 50.
Keep this on your watchlist.

spot buy buy after the break at 230.55. macd helps a lot.. stoploss at 199.75. we'll going long on this trade.

Head and ShouldersHead and shoulder tops do not always reach the down targets in a bull market. The inverse head and shoulders performs much better in a bull market, vice versa for a bear market.
SPOT has passed the neckline which would have been former support before that support was breeched.
I drew green dashed lines where I see support, but you may see it elsewhere. When a security is doing this, going down, I watch the support levels and wait for a breech of that level if it occurs, then I set an alert for the next level.
On the bearish side: There was a death cross a while back and the 50 SMA crossed down through the 200 SMA. Price is still under the 50 which many consider bearish. The 4 moving averages I used are all sloping down and opposite of where they need to be. The 20 is on bottom and the 200 is on top.
I do see a large volume bar recently.
Many consider the first warning sign to possibly sell is when price goes under the 50. The second is when a death cross occurs.
Surprisingly, short interest is lower than I thought it would be at around 4% depending on where you look. Possible targets down are in orange down below, but as I mentioned, H&S do not always hit down targets in a bull market.
No recommendation

$SPOT on...SPOT has been on an epic downtrend sitting -45% from it’s all time high but bouncing off it’s original resistance (now support) of $200. With more volume across the option chain than I can remember, taking a small position with any close above $215 (prior support). This trade is bullish near term for a small bounce up toward it’s next resistance level of $240.
