“Palladium Double Bottom Thief Plan – Will $XPDUSD Steal 1350?”📝 TradingView Description (Thief Style, Polished, Stylish, Funny-Pro Vibe)
Asset: XPD/USD “Palladium vs U.S Dollar”
Market Map: Forex Metals – Swing/Day Trade Strategy
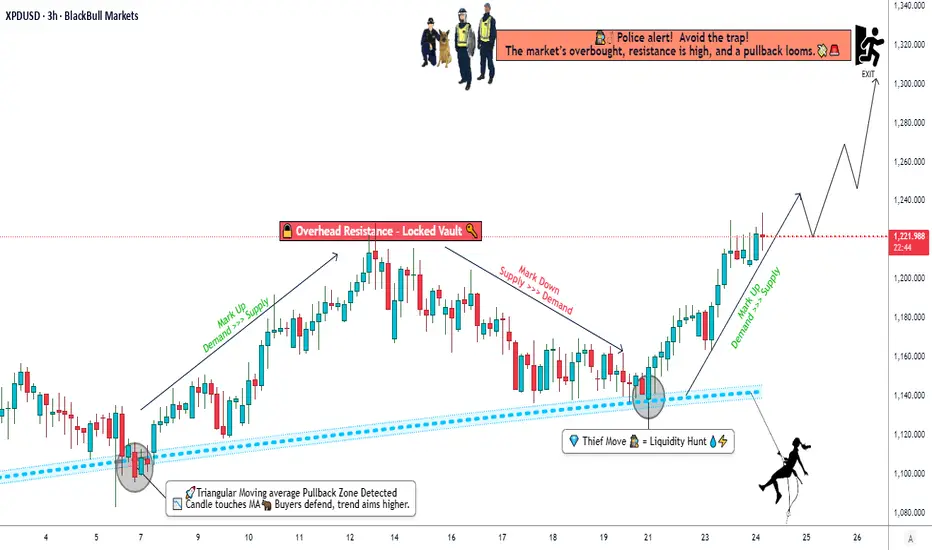
📊 Plan – Thief Strategy in Action
The bullish plan is confirmed with:
✅ Double bottom pullback & retest
✅ Triangular moving average

Palladium (XPDUSD) – Cup & Handle Breakout in Play?Palladium is showing a Cup & Handle pattern on the weekly chart – a strong bullish continuation setup. After a long rounded base (cup), price has pulled back slightly to form the handle, and now it’s testing the neckline zone.
🔑 Key Levels:
📍 Breakout Zone: 1,270 USD
🎯 Target: 1,680 USD (cup dept

XPDUSD Long AnalysisPalladium has shifted from a mid-August downtrend into a choppy recovery and now shows signs of a trending bullish phase on the 4-hour timeframe. Price has cleared short-term resistance around 1,176.87 → 1,246.75 and is currently trading ~1,237 (your chart). The moving averages have flattened then b

Palladium Market Roadmap | Bullish Case vs Overbought Resistance💎 XPD/USD | Palladium vs U.S Dollar – Market Wealth Strategy Map (Swing/Day Trade)
📊 Plan:
Bullish confirmation looks solid here — backed by Triangular Moving Average pullback + retest ✅ and a Double Bottom formation 🥂 which adds strength to buyers’ side.
I’m laying out my Thief Strategy (Layering
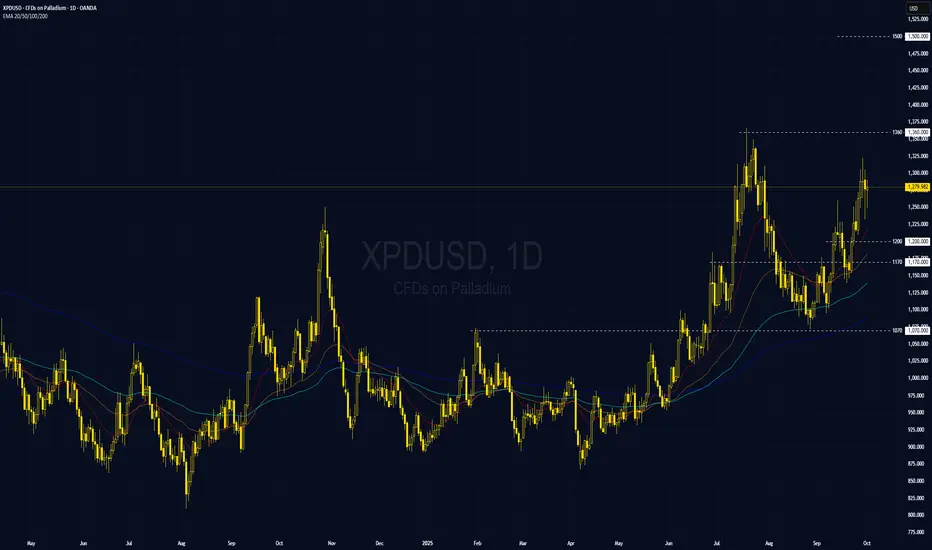
Palladium’s bull run is knocking on a two-year highPalladium’s bull run is knocking on a two-year high.
Technical Analysis XPDUSD rose toward the previous high near 1,360 after forming a series of higher swings, supported by diverging bullish EMAs that suggest stronger bullish momentum.
If XPDUSD breaks above 1,360, it would mark a new two-year

XPDUSD--LONG--Bullish bias
--check monthy,weekly and daily chart as well
--tp and entry levels are as shown on chart

XPDUSD: Strong Confluence + MomentumBias: Long
Trade Type: Reversal
Trend: Range
Area of Value: Yearly Open + Quarter Open + 6 Hit Support
Momentum: 1D MACD Histogram Crossing to High Tide.
Entry: 1,102.37
Exits: Stop Loss @ 1,063.95 ; Take Profit @ 1,217.82
Analysis
Fact 1: XPDUSD is in a Range between 908.50 and 1,245.35 since 2

STRONG BUY | PALLADIUM Strategy: Impulse Correction
Direction: Bullish
Moving Average: Blue above Red
Fib Retracement: 38.2 reached
MACD > 0
Support : Finding additional confluence, as the weekly bounces off a massive support structure
1st Target = 1336
2nd Target = 1449
3rd Target = 1595
Lots: 0.1 (Plan to pyramid

Palladium Faces Bearish SignalA very unfavorable and non-positive candle has formed on the daily chart for the continuation of the upward movement.
In any case, we need to watch the Monday open and price action, but for now everything points to a decline of about 5–6%.
Tomorrow it will become clearer, but for now I’m just noting

See all ideas
Displays a symbol's price movements over previous years to identify recurring trends.