Corn CFD Outlook: Institutional Breakout Setup Explained🌽 CORN VS DOLLAR: BULLISH MOMENTUM CONFIRMED | Swing/Day Trade Opportunity
📊 MARKET OVERVIEW
Asset: CORN Futures (ZCH26) / USD
Current Price: $446.40 (Dec 23, 2025)
Market Status: ✅ Simple Moving Average Breakout Confirmed
Trade Type: Swing / Day Trade
Signal: 🟢 BULLISH SETUP ACTIVE
🎯 TRADE PLAN:

Corn butterfly Been bullish on corn 🌽 for a good while. This is long term harmonic pattern that made me that way. The bottom which recently occurred was marked by three distinct doji type candles. Really believe commodity supercycle is very close. Oil, corn , metals obviously 🙄.

CORN Bulls in Control? Retest Pullback Confirms Trend Bias🌽 CORN Institutional Edge Plan (Swing/Day Trade Setup)
🔍 Market Context
CORN (CFD on US Corn Futures) is showing signs of bullish momentum after testing a key resistance area. Institutional order flow hints at accumulation in the mid-420s region — a potential pullback zone before continuation higher

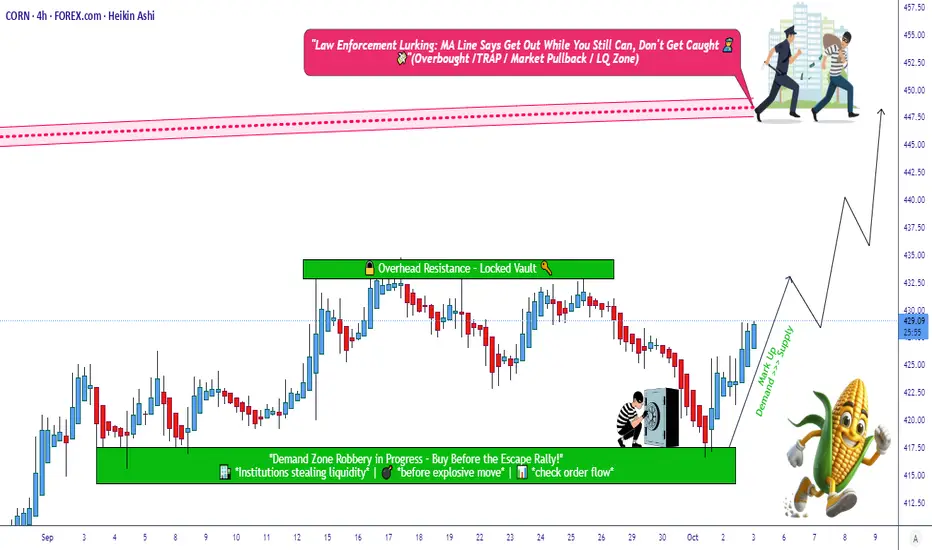
Corn Agro Market Strategy Map – Bullish Path Ahead!🚜🌽 CORN Agro Commodities Wealth Strategy Map (Swing/Day Trade)
📌 Plan: Bullish (Swing + Day Trade Setup)
✅ Market sentiment favors bullish bias in CORN.
🎯 Swing/Day traders can look for upside continuation until resistance zones.
🎯 Entry Plan (Layering Style Method)
🔑 You can enter at any price, b
CORN BULLUsing daily market structure and an H4 pattern, alongside, daily CVD divergence I'm convinced corn breaks up towards 4.5 and beyond. THE BIGGER PICTURE which i will show below shows a rather large bullish bat harmonic. I have been long corn from below 3.8. Jump on don't miss the commodity super sh

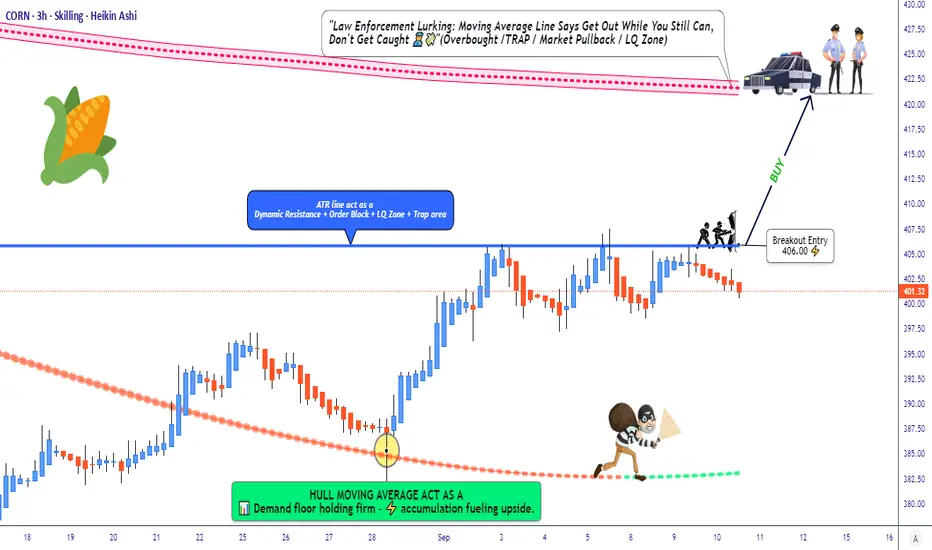
CORN Setup: Is This The Bullish Breakout We've Been Waiting For?🌽 CORN CFD | Money Heist Plan 🎭 (Swing / Day Trade)
🔑 Trading Plan (Thief Style Strategy)
Entry (Breakout Trigger): 📈 406.00 — when candle breaks ATR resistance, bullish plan activates.
Layering Entries (Thief Method):
Buy Limit Layers: 400.0 | 402.0 | 405.0 | 407.0 | 410.0 (flexible — adjust/add m

Corn geometric upsideWith use of long disregarded tools, and, well placedc anchors. Pointers to future price action can be delivered.

CORN - Want some POP? Here it comes...maybe.Corn regained the orange Centerline.
Unfortunately I missed the retest.
But if we are lucky we get it again and then we can pull the trigger to get some nice crunchy Corn.
The Risk-Reward looks nice around the white Centerline.
BRB… off to the kitchen… 🌽🔥

CORN 1H sHORTHead&Shoulder form, expecting it will drop from here after breaking the neck.
Bearish Divergence also spotted

See all ideas
Summarizing what the indicators are suggesting.
Oscillators
Neutral
SellBuy
Strong sellStrong buy
Strong sellSellNeutralBuyStrong buy
Oscillators
Neutral
SellBuy
Strong sellStrong buy
Strong sellSellNeutralBuyStrong buy
Summary
Neutral
SellBuy
Strong sellStrong buy
Strong sellSellNeutralBuyStrong buy
Summary
Neutral
SellBuy
Strong sellStrong buy
Strong sellSellNeutralBuyStrong buy
Summary
Neutral
SellBuy
Strong sellStrong buy
Strong sellSellNeutralBuyStrong buy
Moving Averages
Neutral
SellBuy
Strong sellStrong buy
Strong sellSellNeutralBuyStrong buy
Moving Averages
Neutral
SellBuy
Strong sellStrong buy
Strong sellSellNeutralBuyStrong buy
Displays a symbol's price movements over previous years to identify recurring trends.