OIL: Time To Rise AgainOIL: Time To Rise Again
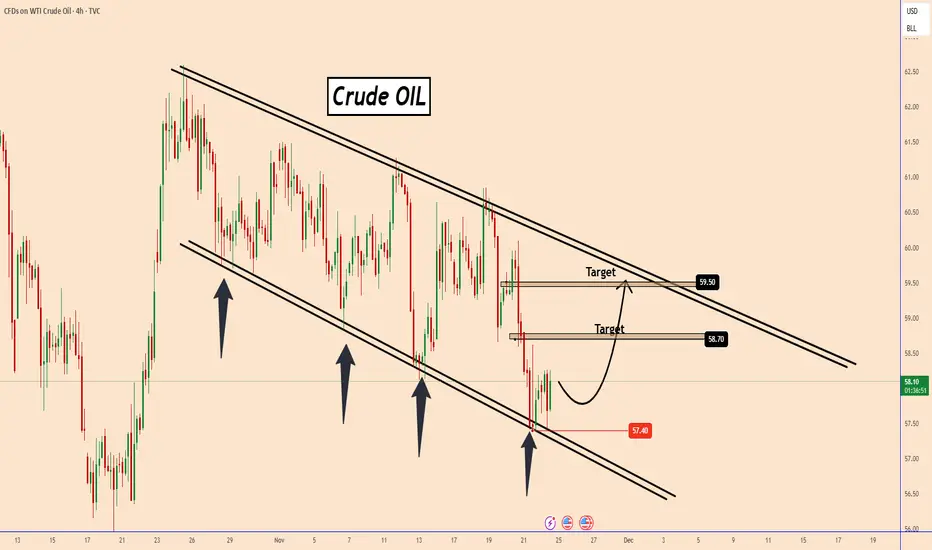
Oil is moving within a "Descending Channel Pattern" which is clear and well defined.
Every time the price tested the lower support of the pattern, the price moved back up and every time Oil tested the upper boundary of the pattern, the price moved back down.
It is more li
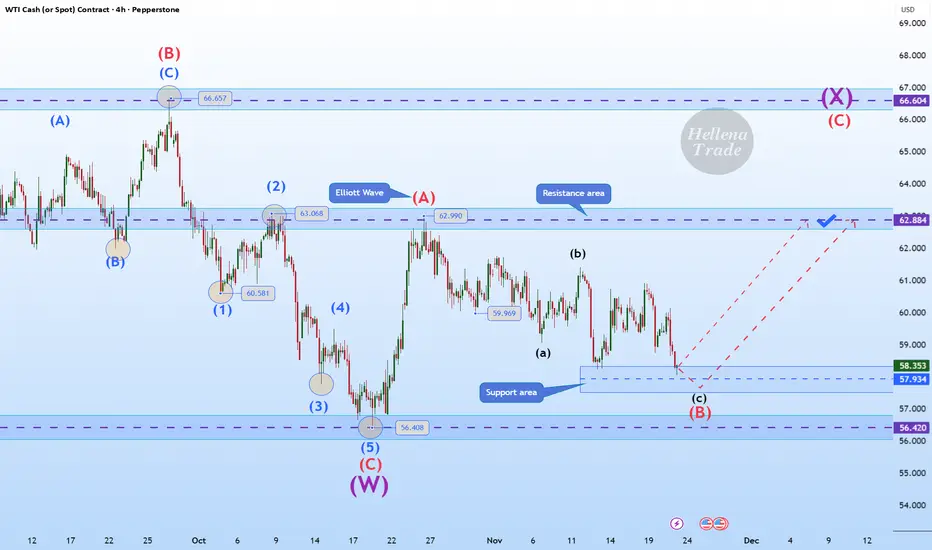
Hellena | Oil (4H): LONG to the area of the maximum of wave “A”.Colleagues, the past forecast has not been canceled, but I see some changes and therefore feel it is necessary to make a fresh forecast.
Apparently, the corrective wave “B” has extended to the area of 57.930. This is quite close to the low of wave “C” at 56.408 and the price should not update it, o
us oilHI GUYS,
UPDATE and CORRECTION on US OIL
we wait for sells Friday morning, a few hours from now,
(MON, TUE) Double bottom buy price is calling for a sell price pattern (FRI, MON) Head shoulder

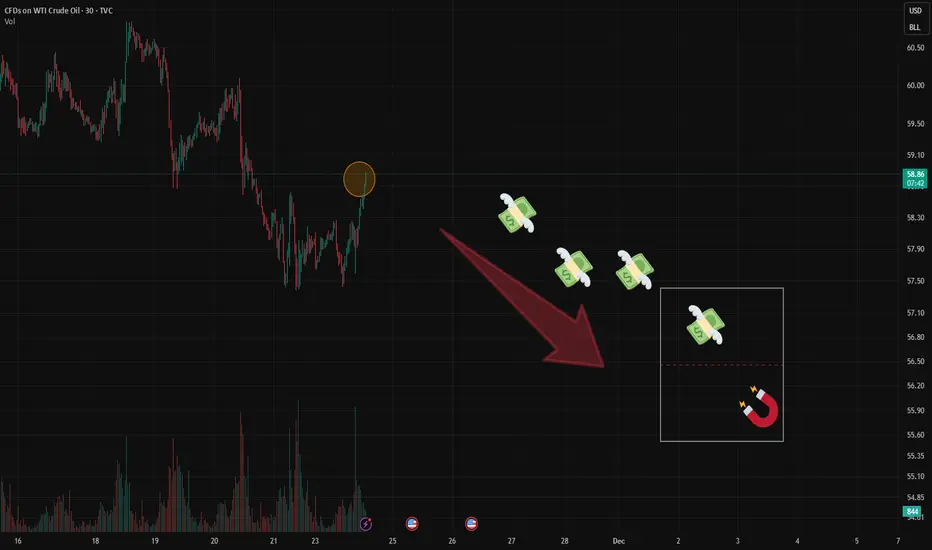
🇺🇸 USOIL – Big Money Steps Back In | Fresh Sell Order BlockUSOIL continues to follow its broader downtrend as Big Money steps back into the market.
After a brief bullish correction, price was rejected sharply and formed a fresh VShark Order Block, supported by strong volume and a clean Imbalance zone.
This reaction reveals clear footprints of large players

Oil Upd:Price at Resistance–But the Real Story Is in OptionFlowRight now, price has reached the upper boundary of the 1σ Expected Range (ER).
A pause or rejection here is possible.
But that’s not the main story.
Bears are getting active in the options market.
First sign: A significant Put Condor has appeared — large enough to stand out.
Target range: $
WTI OIL Short-term relief rebound before a Lower Low?WTI Oil (USOIL) has been trading within a 1-month Channel Down and has just completed its strongest Bearish Leg (-5.91%). All previous three Bearish Legs eventually bottomed and rebounded into the new Bullish Legs towards the Sell Zone consisting of the 4H MA200 (orange trend-line) - 1D MA50 (red tr


Oil – Geopolitical Engine Ready to Fuel a Surge to $100My view: I believe that oil is one of the best investments for the upcoming years. There is a strong bullish potential, with targets up to $100 a barrel, based on geopolitical and fundamental factors
Geopolitical Risk
There is a real risk of conflict between the U.S. (with Trump) and key oil-produc

USOIL : Don't be fooledHello friends
Well, you see that we have a descending channel that has hit the ceiling twice and the ceiling three times.
Well, in the third encounter with the bottom or support, you see that the buyers provided good support for the price and pushed it up and broke our medium-term ceiling. Now, if

USOIL The Target Is UP! BUY!
My dear friends,
USOIL looks like it will make a good move, and here are the details:
The market is trading on 57.97 pivot level.
Bias - Bullish
Technical Indicators: Supper Trend generates a clear long signal while Pivot Point HL is currently determining the overall Bullish trend of the marke

See all ideas
Displays a symbol's price movements over previous years to identify recurring trends.