$ARBK Long + Bitcoin + PivotI have been bullish on Bitcoin for a long time and have posted a ton of charts on here regarding the bilateral trades with Bitcoin miners so this is part of that work.
$ARBK , $BTCM , $MARA are the main longs I am in and building positions right now.. the main reason is these mining companies are currently mining under $5,000 per Bitcoin so even if Bitcoin falls to $9800 which is likely in a capitulation dump (IF)
These 3 miners have strong balance sheets, low cost to capital, and are extremely under valued due to earnings and tradfi not understanding the trade. (exclusion there is Mara... they have not sold any Bitcoin so they have the biggest exposure to a dump)
This long is simple... I believe the fed will pivot before 3.0001% and any higher than that we will see a real crash which will never happen for midterms.
Under the long term moving averages and I am wrong on my timing.. and I will take the L then look for reentry
Argo Blockchain Plc
No trades
Trade ideas

Argo Blockchain UKSun Storm Investment Trading Desk & NexGen Wealth Management Service Present's: SSITD & NexGen Portfolio of the Week Series
Focus: Worldwide
By Sun Storm Investment Research & NexGen Wealth Management Service
A Profit & Solutions Strategy & Research
Trading | Investment | Stocks | ETF | Mutual Funds | Crypto | Bonds | Options | Dividend | Futures |
USA | Canada | UK | Germany | France | Italy | Rest of Europe | Mexico | India
Disclaimer: Sun Storm Investment and NexGen are not registered financial advisors, so please do your own research before trading & investing anything. This is information is for only research purposes not for actual trading & investing decision.
#debadipb #profitsolutions

ARB , Argo Blockchain , Lse , Update Hi all I hope you had a great Christmas with your family and here we are back to the charts! =)
I'd like to share my opinion on Argo and give an update to my ideas.
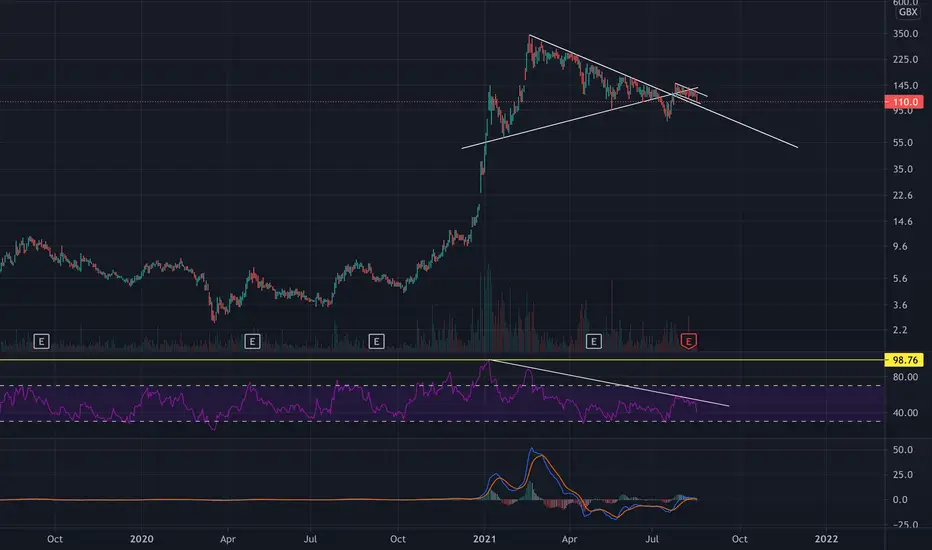
I used here a 4h chart (you can use the weekly and monthly one too) just because I noticed that the share price went down to 70 on the 29th of July and up to 202 on the 22nd of September and with bigger timeframe we cannot see it and this episodes gave me the idea of today.
For more than 6 months the share price has been exchanged between the range (110-150) as per the fixed range volume profile that shows where has been exchanged most. ( as per the yellow triangle)
For this reason I think that the price will definitely come back to the yellow area once find out where is the possible bottom.
It seems that the price is attracted now to the previous support area at 60-75.
I'd wait to open a long position for a swing trade now just because the Cryptomarket and the Stockmarket are both experiencing an uncertain period and I'd wait for confirmations .
If you are IN for long term it's great for some accumulation to average the price down a bit.
( for those that are interested on updates and looking on what Argo is doing , on YouTube Argo Ceo regularly updates videos where He talks about the company and the period in general and answers to questions made by Investors , super interesting check it out)
As per chart to figure out some targets prices I used the Trend-based Fibonacci extension.
Let me know what you think !
Comment are always Welcome.
Cheers.

ARGO blockchain rally off of Bitcoins final leg up?- Argo's 5 year RSI support has been hit three times now and has already begun to reverse suggesting a reversal fairly soon.
- There's a double bottom on it as well which suggests a PT of £2.60.
- Furthermore, declining volume suggests a breakout of this triangle is likely to occur soon.
Wishing you all a great Christmas and a successful start to the new year trading.
See you on the moon
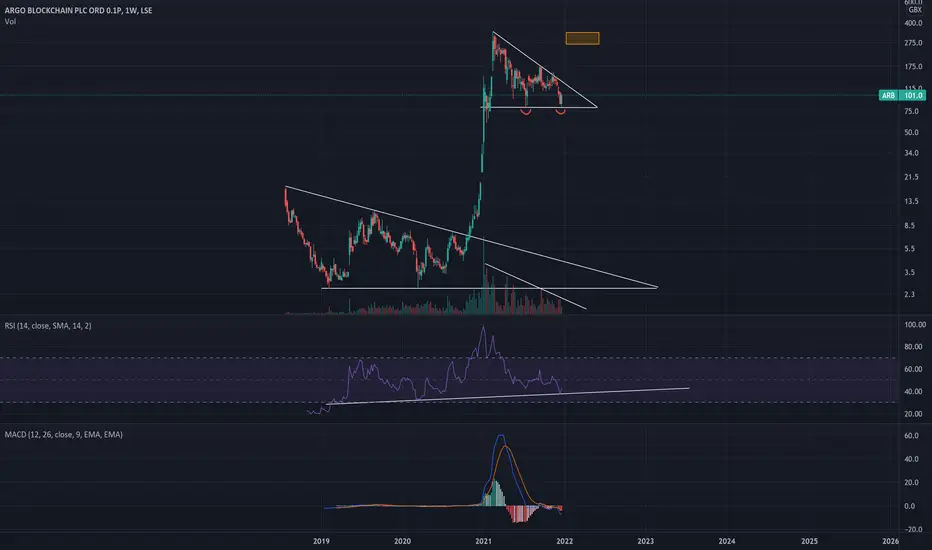
Argo long4.5x in next few months? With btc likely going to 100k this next quarter , will argo follow suit? This triangle suggests a major breakout up or down now its hit support and resistance 3 times each. Declining volume suggests breakout soon

$ARBK Rising Channel and tight PivotI don't normally do trendline pivots but this $ARBK IPO looks interesting.
Its been in a rising channel and:
* OBV pegged at high during recent pullback
* My custom "tightening" indicator (orange background shade), alerting for a possible volatility expansion soon)

ARB argo blockchain LSE , long target In this idea I show you where are the main price targets for a long in Argo .
As previous ideas I've published ( check it out if you did see it before)
It seems we are currently in the accumulation phase of Wyckoff waiting for a push upwards testing the main resistance at 170 .
It's likely possible that the price will touch the others targets I've drawn .
Let's see what will happen in the upcoming weeks .
Let me know in the comments what are you thoughts about it and share with the community your ideas.
( not financial advise just my opinion , make your own research )
Good luck ! =)

ARGO Blockchain , ARB , LSE, WYCKOFF ACCUMULATION BULLISH In my opinion , we are inside the beginning of the phase D of the Wyckoff accumulation,
Waiting for the confirmation whenever there is a breakthrough the main resistances at: £ 1.70 and £ 2.00.
The main Support areas are at: £ 1.25 , £ 1.15 and £ 1.10.
Remember to make always your own research and plan your risk management! =)
Please leave a comment or a like to support me.
Good luck all !
Peace.

Argo Blockchain $ARBLevels still playing out and the plan remains:
positioning for a long entry around 1.40 ~ 1.44 after confirmation of support.
Target 1 continues to be between 1.90 ~ 2.00

ARBKF - Let's See What Happens!If you've been holding since March, like someone I know, you've been pretty upset with ARBKF. It has massively underperformed compared to other miners. The IPO didn't help the price much either.
We finally broke our descending channel(green), and then found support at $1.47(red). We will retest $2.30/$2.40 so long as bitcoin keeps trucking along. We may have found an upwards support line (blue), that'll be tested with time. We are also finally above our 20 and 50 day moving average. Hopefully our 20 day crosses our 50 day soon, that's pretty bullish!
I have no major thoughts on this, I just wanted ARBKF to have some love in the Trading View Ideas section.

ARBK might attempt a new highArgo Blockchain has an interesting set up in my opinion, it might be forming a 1-2-1*-2* (*lesser degree) looking for a 3th wave that could take us to 21,49$ , for that scenario to play out it doesn't have to lose 16,50$ (previous low).

ARB LSE time to go !!It's nearly time for Argo Blockchain to make a move . Following the latest net profit and youtube update by The CEO and checking the graphs we are nearly done with the accumulation phase and get ready for an upwards move.
Let me know in the comment what you think ! =)

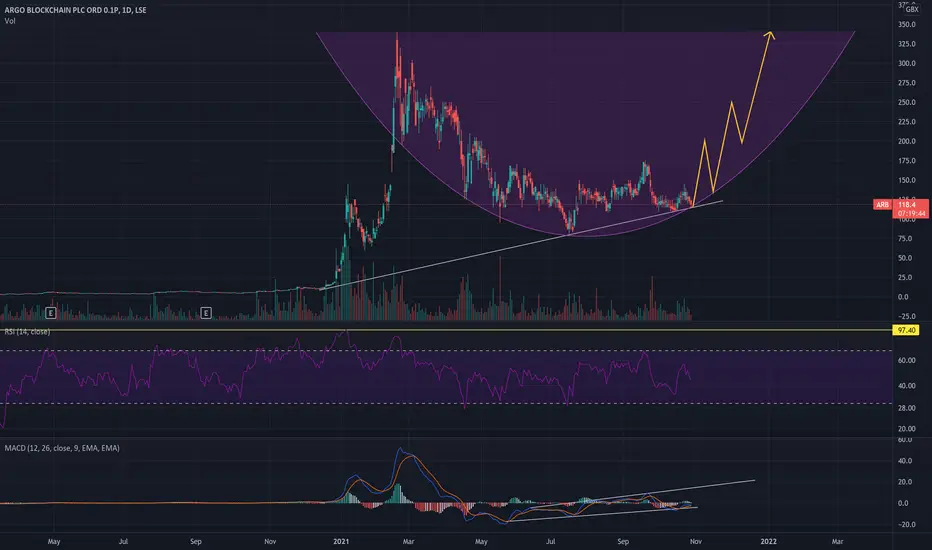
Argo longBowl chart suggesting 300+ by start of 2022.
This ties in with a lot of crypto charts suggesting crypto will peak around new year
Argo Blockchain $ARBRanging atm.
Long Entry: wait for 1.40 confirmation of support
Target 1: Between 1.90 - 2.00 which is also a Fibonacci relevant level


$ARBK and $ARBKF trade setup( levels are taken from $ARBKF chart)
Hi Fellow traders, here i share my trade setup on Argo Blockchain.
So argo recently had an IPO on the NASDAQ. their shares were sold as $ARBK.
As ARBK represents 10 $ARBKF shares, we can easily do the math and use the ARBKF chart as our ARBK chart.
Here i will share the TA i did on ARBKF and i will add the ARBK chart with those levels to make things easier.
So, as shows on the chart, we broke out of a descending wedge with a bullish breakout. This is why im assuming our broadening wedge will be Bullish. But as we always have to keep in mind it can turn bearish, we also add those levels and targets.
So, after the bullish breakout we now are in a "Ascending Broadening Wedge" if we breakout bearish now, our 70% target of C-D price would be 0.9.
if we indeed still have to complete our ABCDE elliot wave pattern, im taking the 0.382 Fib level as target.
After that we have 3 options, (1) straight throught the roof (unlikely) (2) Backtest of last Resistance as Support before breakout (3) Back to Bottom of the pattern + Bearish breakout.
Bullish breakout takes us to 40 / 4 ish levels and a Bearish breakout AFTER a wave E to 4.9 / 0.49 level as a 70% from elliot wave D-E.
All levels ive shown are Backtested Proven resistance/support levels, and are backed up by fibonacci levels and pattern target levels.
My trade setup:
ive been buying in the 15 - 16$ are so we take our entry as 16$ ( 1.5 -1.6 in ARBKF )
Entry : 16 / 1.6
Target 1: 19.7 / 1.97
Target 2: 23.8 / 2.38
Target 3: 28.5 / 2.85
Target 4: 39.5 / 3.95
Target 5: 41.5 / 4.15
Stoploss / Short Entry : 14.40 / 1.44
Not financial advice, Trade safe Wanderers

$ARBKF and $ARBK trade setupHi Fellow traders, here i share my trade setup on Argo Blockchain.
So argo recently had an IPO on the NASDAQ. their shares were sold as $ARBK.
As ARBK represents 10 $ARBKF shares, we can easily do the math and use the ARBKF chart as our ARBK chart.
Here i will share the TA i did on ARBKF and i will add the ARBK chart with those levels to make things easier.
So, as shows on the chart, we broke out of a descending wedge with a bullish breakout. This is why im assuming our broadening wedge will be Bullish. But as we always have to keep in mind it can turn bearish, we also add those levels and targets.
So, after the bullish breakout we now are in a "Ascending Broadening Wedge" if we breakout bearish now, our 70% target of C-D price would be 0.9.
if we indeed still have to complete our ABCDE elliot wave pattern, im taking the 0.382 Fib level as target.
After that we have 3 options, (1) straight throught the roof (unlikely) (2) Backtest of last Resistance as Support before breakout (3) Back to Bottom of the pattern + Bearish breakout.
Bullish breakout takes us to 40 / 4 ish levels and a Bearish breakout AFTER a wave E to 4.9 / 0.49 level as a 70% from elliot wave D-E.
All levels ive shown are Backtested Proven resistance/support levels, and are backed up by fibonacci levels and pattern target levels.
My trade setup:
ive been buying in the 15 - 16$ are so we take our entry as 16$ ( 1.5 -1.6 in ARBKF )
Entry : 16 / 1.6
Target 1: 19.7 / 1.97
Target 2: 23.8 / 2.38
Target 3: 28.5 / 2.85
Target 4: 39.5 / 3.95
Target 5: 41.5 / 4.15
Stoploss / Short Entry : 14.40 / 1.44
Not financial advice, Trade safe Wanderers

good risk reward here$ARB is at a very big support area here, I think its safe to say we can see a test of 147 in the near future! i wouldn't set any target much higher than that though, this looks like a slow mover. good luck ! :)

$ARBK is giving a GREAT IPO LONG opportunity todayIPO intraday trading strategy idea
The share price is rising and gonna continue this trend today.
The demand for shares of the company still looks higher than the supply.
These and other conditions can cause a rise in the share price today.
So I opened a long position from $15,76;
stop-loss — $14,26;
take-profit — $20,26/MOC price.
Do not view this idea as a recommendation for trading or investing. It is published only to introduce my own vision.
Always do your own analysis before making deals. When you use any materials, do not rely on blind trust.
You should remember that isolated deals do not give systematic profit, so trade/invest using a developed strategy.
If you like my content, you can subscribe to the news and receive my fresh ideas.

ARBKF - Cryotp OTC long set upNo investment advice!
I do this only for practicing.
Most info on the Chart.
Keep in mind the Movement will be linked to the Cryptomarket

Argo LongArgo blockchain is the most efficient bitcoin miner in the world with revenue growing fast. This TA shows that argo has broken out of its downwards trend since mid feb and is now maintaining its ground using it as support - this is inevitably a bullish flag which will breakout soon.
$ARB $BTCUSD Comparison Lowering expectations for ARB. Seems that this level for ARB is correct when $46k BTC. Historically ARB has traded here when BTC was at $46k, with one time being much higher. Would suggest that BTC reaching previous ATH would put ARB at around £2, not reaching historical highs. Of course other factors could trigger a better return on ARB from here.

ARGO - Coming in HOTCrypto looking to fly again.. Argo looking like massive bull flag under way.. Currently hovering between 20 and 50 Day EMA Looking for golden cross any day..
EOY TP $5.00-$6.50.. Let's GO!
