Baidu -the awakening of the Chinese giantBaidu (BIDU) has been moving within a descending channel, and the price is now testing the lower boundary of a key demand zone. On the monthly chart, the stock is attempting to hold above the 115–120 range, which could signal the beginning of a mid-term reversal. The upside potential extends toward 163, 205, and 357, where major supply zones and the upper border of the long-term channel are located.
Baidu remains a leader in China’s AI and internet search industries. The company continues to invest heavily in autonomous driving and cloud technologies, reinforcing its long-term position. With the yuan weakening and expectations of a softer monetary stance from Beijing, the tech sector gains additional tailwinds.
The stock is consolidating near key support, and a breakout above the range may trigger a new bullish phase. Investors should watch the 115–120 zone as a potential launch point for growth. Volatility may stay elevated, so risk management remains essential.
Trade ideas

BIDU - Road to recovery=======
Volume
=======
- decreasing
==========
Price Action
==========
- Broken out of 4 year downtrend
=================
Technical Indicators
=================
- Ichimoku
>>> price above cloud
>>> Green kumo contracting slightly
>>> Tenken - Above clouds
>>> Kijun - Above clouds
>>> Chiku - Above clouds & pointing up slightly
=========
Oscillators
=========
- MACD turning bullish
- DMI turning bullish
- StochRSI, turning bullish, crossed and entered band
=========
Conclusion
=========
- short to long term breakout swing
- price may reverse at current level, to enter spot or wait for pullback at entry 2.
- Entry and exits depends on your time horizon and risk management.
=========
Positions
=========
Entry 1 - $127
Entry 2 - $112
Stop - $100
Exit 1 - $138
Exit 2 - $179
Exit 3 - $210
Exit 4 - $245
Exit 5 - $290

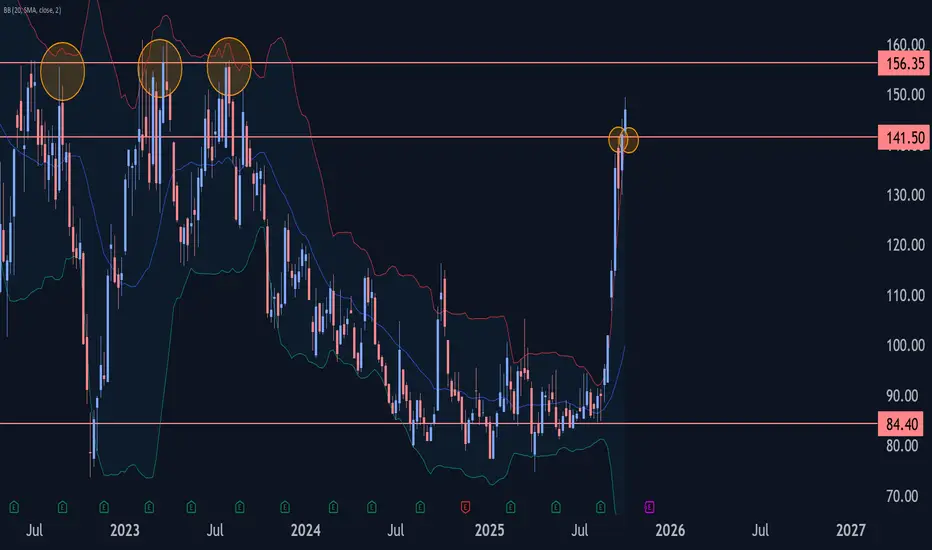
Baidu Wave Analysis – 6 October 2025
- Baidu rising inside weekly impulse wave C
- Likely to rise to resistance level 156.35
Baidu recently reversed up from the key support level 141.50 (former monthly high from September, acting as the support after it was broken).
The upward reversal from the support level 141.50 continues the active weekly impulse wave C of the ABC correction (2) from April.
Given the strength of the active impulse wave C, Baidu can be expected to rise to the next resistance level 156.35 (former powerful resistance from 2023).
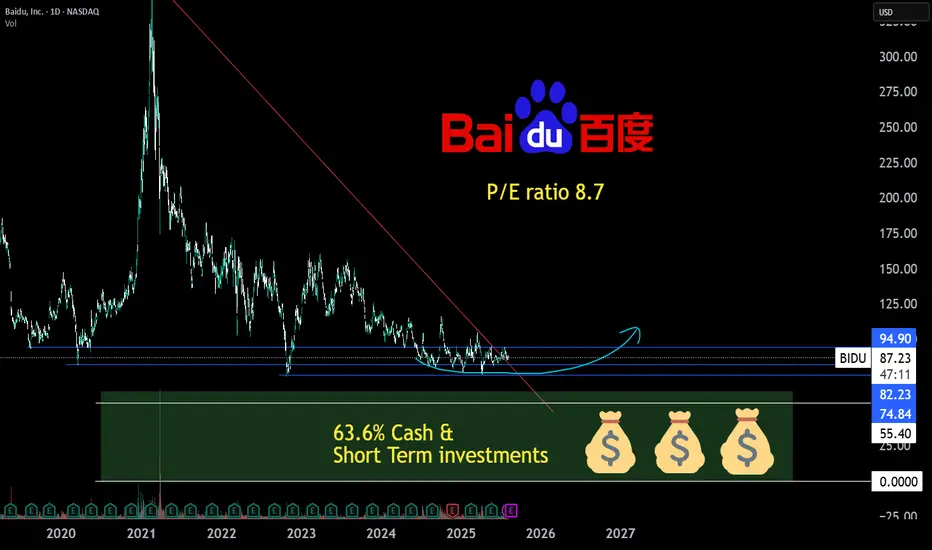
BAIDU 63.6% cash & short term inv., P/E 8.7,possible rotation TABaidu largest search engine in china but way less monopoly in china, there is also bing.
Baidu invests heavily in AI and autonomous driving by apollo go.
China economy is in deleveraging and seems to start growing again.
China devlation problems comapnies sitting on cash.
Baidu advertisment income will come back if the chinese economy improves.
BIDU Long TradeSeems good here, buying at market on Monday but prefer lower to flat price
SL at 81
TP at 116.73
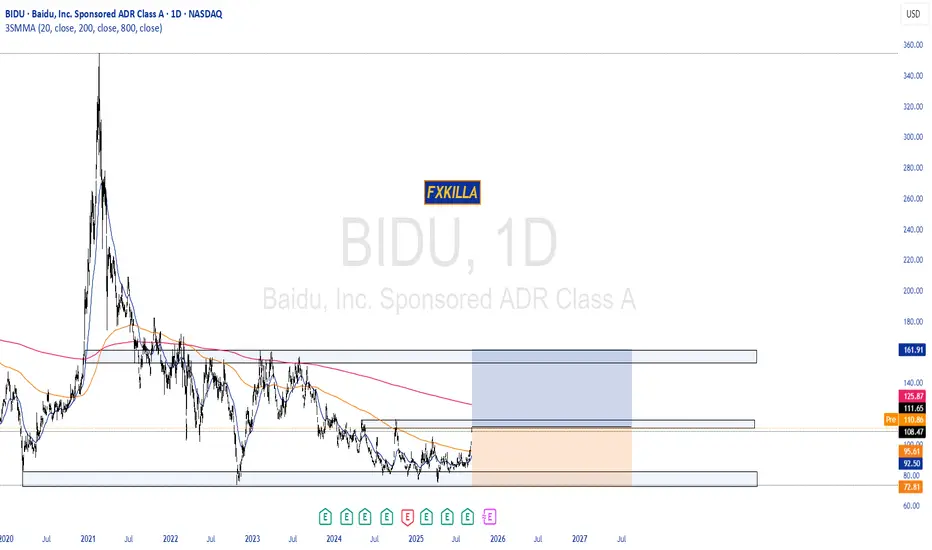
BAIDU HIGH PROBABILITY SETUP SOON!!!🚨 BIDU HIGH PROBABILITY BUY SETUP 🚨
* Here We Can See Clearly The Next Potential Move For BIDU Coming Hours/Days.
* Keep Your Eyes Close On Your Trading Positions.
* Happy PIP Hunting Traders.
FXKILLA.
BIDU 1D: triangle breakoutBIDU 1D: triangle breakout + real-world AI deployment boosts bulls
Baidu (BIDU) breaks out of a triangle within a falling channel on the daily chart, with solid volume, reclaim of the 50MA, and approach to the 200MA. $90.09 flips into support. Targets stretch to $105.47 / $113.68 / $124.06 (Fibo levels).
Fundamentally, Car Inc just launched a robo-car rental service powered by Baidu’s Apollo unit. Fully autonomous, bookable for 4 hours to 7 days — this is not future tech, it’s live now. With a $32.6B market cap and low P/E (~12), BIDU looks positioned for revaluation if sentiment shifts.
Tactical setup: entry by market or retest of $90, stop below $82.
When the robot drives customers - you just drive the trade.

BIDU Daily Outlook – Smart Money Play in Motion🔹 Key Observations:
Clear Break of Structure (BOS) to the upside, signaling bullish intent.
Volume spikes confirm institutional activity around recent lows.
Fib extension targets align with supply zones at $95.23 – $105.19.
If $105 breaks, the liquidity pocket toward $115.73 opens up.
🔹 Levels to Watch:
Support: $81.11 / $74.46
First resistance: $95.23
Major supply: $102.95 – $105.19
Expansion target: $115.73
🔹 Gameplan:
Accumulation between $82–90 offers favorable risk-reward.
Watch for rejection/absorption at $95–105 zone.
If price clears $105 with strength → next leg likely toward $115+.
⚠️ Risks: Macro uncertainty in Chinese equities, global tech sector volatility, and earnings in late Q4.
✅ Bias: Bullish continuation setup in progress.
#BIDU #SmartMoneyConcepts #Stocks #TechnicalAnalysis #TradingView

Baidu | BIDU | Long at $82.50Baidu NASDAQ:BIDU - the Google of China. This one is being ignored by AI investors, and may be an opportunity. Maybe... nothing is certain (especially with the "risks" of Chinese investments).
P/E = 9x
Debt/Equity = 0.27x
Price/Sales = 1.55x
Price/Book = 0.80x
Price/Cash flow = 7.59x
Thus, at $82.50, NASDAQ:BIDU is in a personal buy zone.
Targets:
$109.00
$125.00
$150.00

BIDU - LongI wanna say we are seeing a rotation into Chinese stocks, but not really sure. Looking at BIDU and BABA on the weekly, they looked primed. I am currently in this trade, but it looks to have some promising upside.

$BIDU Summary Analysis & OutlookSummary Analysis & Outlook
Summary Analysis & Outlook
Factor Insight
Trend Upward short- and long-term trend.
Momentum Mixed signals: MACD positive, RSI neutral, low ADX suggests trend not strong yet.
Support zones $87–90 area acts as crucial base.
Resistance zones Key near-term resistance at $97–98, with a longer-term hurdle at ~$111.
Potential upside Your $103–105 target falls within consensus (~10–17% upside).
Analyst sentiment Broadly “Moderate Buy” to “Strong Buy.”

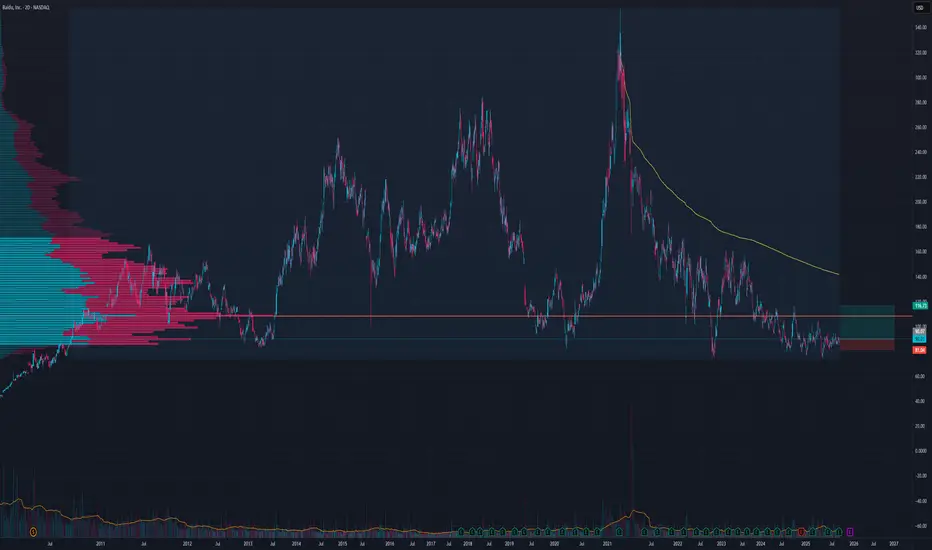
Baidu (BIDU) Long-Term Technical Outlook📊 Baidu (BIDU) Long-Term Technical Outlook
BIDU is testing a critical demand zone between $74 – $82, holding firm after years of consistent decline.
🔹 Price Action:
The long-term downtrend (red trendline) from the 2021 peak is being challenged.
Current monthly candles show compression near historical support levels.
Buyers defending this zone since 2015 indicate institutional interest.
🔹 Key Levels:
Support: $74.46 – $81.11
Resistance: $100, $120, $144 (if reversal confirms)
Long-term upside targets stretch toward $260+, but confirmation requires sustained breakout above $100.
🔹 Outlook:
As long as BIDU holds above $74, risk/reward favors accumulation.
Breakout from the downtrend line could trigger a multi-year reversal.
Failure to hold support risks retest of lower uncharted levels.
⚠️ Earnings, China tech policy, and U.S.–China trade developments remain key macro risks.
✅ Watchlist Setup:
Entry zone: $74–90
Breakout trigger: Above $100 with volume
Stop-loss (long-term investors): Below $70
📌 This is a long-term play with asymmetric upside if structural reversal unfolds.
#BIDU #Stocks #TradingView #TechnicalAnalysis #ValuePlay #ChinaTech

$biduyieahhh
awesome risk vs reward.
This is a monthly time frame.
A mix of gann, elliot, noodle soup etc. Take the Gann with a grain of salt as I am new to this.
Elliot a bit weird. Wave 2 seems to have halted right at .78 fib and looks ready to start wave 3 of wave 3. MACD and RSI curving. MACD not above 0 but I ain't waiting for that as the train may leave the station before so just like the previous rally from 2020.
$200 incoming.

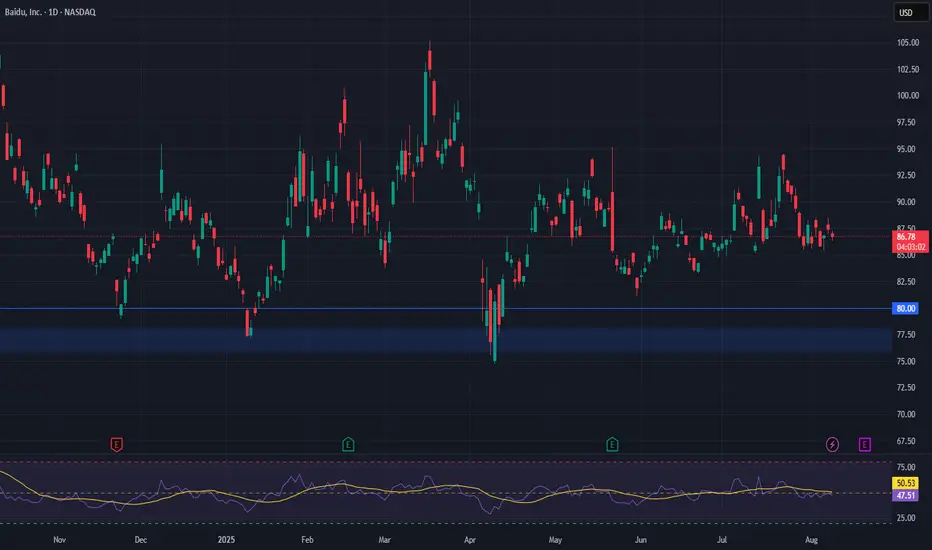
Baidu Wave Analysis – 21 August 2025- Baidu reversed from the support area
- Likely to rise to resistance level 93.20
Baidu recently reversed from the support area between the support level 84.40 (which is the lower border of the sideways price range inside which the price has been trading from April) and the lower daily Bollinger Band.
The upward reversal from the support level 84.40 stopped the earlier impulse waves iii and 3.
Baidu can be expected to rise to the next resistance level 93.20, which is the upper border of the active sideways price range.

BIDUBIDU
I have been buying at this level 87 88.00
It seems to be a good accumulation zone and price has been tightening up.
This could suggest a strong move one way or another is on the horizon.
I'm biased to the Chinese stocks. so that's just my opinion.
To each their own.
:)

Baidu (BIDU) –AI Upgrades + Open-Source Strategy Powering GrowthCompany Snapshot:
Baidu NASDAQ:BIDU is cementing its position as a top AI platform leader in China, combining core search dominance with cutting-edge AI innovations and strategic open-source moves.
Key Catalysts:
Next-Gen AI Infrastructure ⚙️
Major Qianfan platform upgrades and PaddlePaddle 3.0 launch streamline model training & deployment for China’s AI developer ecosystem.
Reduces barriers to AI adoption, expanding the company’s developer base and ecosystem stickiness.
Open-Source Breakthrough 📂
ERNIE language models released under Apache 2.0 license—mirroring successful U.S. big-tech strategies.
Aims to accelerate adoption, attract global partnerships, and enhance monetization over the long term.
Rising User Engagement 📱
724M MAUs (+7% YoY) on Baidu’s mobile app.
AI-generated content now on 35% of search pages (up from 22% in January), increasing ad monetization potential.
Investment Outlook:
Bullish Entry Zone: Above $76.00–$78.00
Upside Target: $160.00–$165.00, fueled by AI leadership, developer adoption, and rising engagement metrics.
📈 Baidu’s combination of AI innovation, open-source strategy, and a massive user base creates a strong runway for both near-term revenue growth and long-term platform dominance.
#BIDU #AI #PaddlePaddle #ERNIE #OpenSource #ChinaTech #Search #CloudComputing #ArtificialIntelligence #BigData #DigitalTransformation #TechStocks
Time to Buy BAIDU -- July 18 BAIDU is getting ready for launch, buy on breaking the red trend line(crossing 95$). Robo taxi and the investments made in past few years will start yielding. Technically it had MACD crossover in longer timeframes.
should return 100% in next 1-2 years

BIDU //The yellow line is our support point. Let's wait for the 22 exponential average to cut upwards to the 50 exponential average.

Baidu #BullishLike many other Chinese stocks, NASDAQ:BIDU is undervalued, and the chart looks tired of being bearish and ready to turn bullish. It's one of my largest positions.

Baidu Accelerates Robotaxi Expansion and Opens the European DoorBy Ion Jauregui – Analyst at ActivTrades
Baidu (NASDAQ: BIDU), the Chinese tech giant, is doubling down on autonomous vehicles through Apollo Go, its robotaxi platform. According to industry sources, the company is planning to expand into Europe, with Switzerland and Turkey as its first potential stops. Although Swiss Post has denied any official collaboration, Baidu has made clear its intention to open a Swiss office before the end of the year. This move could trigger a domino effect across Europe’s autonomous mobility ecosystem. Baidu not only leads the robotaxi market in China, but is also developing a globally scalable model. Europe, with its increasingly strict regulations on smart mobility and sustainability, could provide fertile ground to accelerate its deployment.
This is an opportunity that Uber Technologies (NYSE: UBER) has already sensed. The U.S.-based company has signed strategic agreements with Asian firms such as WeRide, Pony.ai, and Momenta, aiming to roll out its own fleet of electric robotaxis in both Europe and the Middle East. At the same time, it is launching a new low-cost service in the U.S. called “Route Share,” a shared ride option that runs along the busiest routes every 20 minutes at half the price of UberX.
The race to control the cities of the future isn’t limited to Uber and Baidu. Tesla (NASDAQ: TSLA) continues refining its Full Self-Driving (FSD) system, while Waymo, Google’s (Alphabet, NASDAQ: GOOGL) autonomous vehicle division, already operates driverless robotaxis in several U.S. cities and also has its eyes on Europe. The message is clear: the autonomous driving war has begun, and the battlefield is global. While distrust toward Chinese suppliers grows in Washington—evidenced by Hesai (NASDAQ: HSAI) being added to the U.S. blacklist—Europe is opening new paths for companies like Uber, Bolt, or Free Now to either collaborate or compete with tech giants such as Baidu, Tesla, or Google in the development of urban autonomous fleets.
Baidu in Numbers
As of now, Baidu has not yet released its Q1 2025 financial results. The company is scheduled to announce them on May 21, 2025. However, according to available estimates, Baidu is expected to report a net income of approximately CNY 206.52 billion for fiscal year 2025, which would mark a significant 791.24% increase compared to the CNY 23.17 billion recorded in 2024. In terms of revenue, Baidu is projected to reach around CNY 139.78 billion in 2025, up from CNY 133.13 billion the previous year. These figures reflect a notable improvement in the company’s profitability, likely driven by its focus on emerging technologies such as artificial intelligence and autonomous vehicles.
For more detailed and updated information, it is recommended to consult Baidu’s official investor relations site after May 21, 2025, when the Q1 results will be published.
Technical Analysis
Since reaching its peak of $160.88 in 2023, Baidu’s stock has undergone a correction, dropping to a low of $73.58 in 2022, amid the onset of the U.S. tariff war. Currently, after the suspension of tariffs, the stock has rebounded to the $90 range, which corresponds to its current point of control, as trading volume has been concentrated around this price level. It is likely that, following the upcoming earnings report, the stock may surpass the $92.61 mark, which aligns with the 61.8% Fibonacci retracement level. However, to confirm a solid trend reversal, we would need to see a sustained upward crossover in moving averages—which has not yet occurred. So far, only a bullish crossover of the 50-day and 100-day moving averages was observed in Wednesday’s session. Investors should monitor whether this upward movement continues toward the secondary target of $96 during this summer quarter.
Why Does This Matter to Investors?
Baidu’s expansion into Europe could not only reshape the urban mobility landscape but also spark investment opportunities in software, hardware, LIDAR sensors, cybersecurity, and connected services. For companies like Uber, it also presents a chance to strengthen their leadership while reducing reliance on human drivers.
Europe is looking ahead, and in that future, robotaxis are not science fiction—they’re strategy.
*******************************************************************************************
The information provided does not constitute investment research. The material has not been prepared in accordance with the legal requirements designed to promote the independence of investment research and such should be considered a marketing communication.
All information has been prepared by ActivTrades ("AT"). The information does not contain a record of AT's prices, or an offer of or solicitation for a transaction in any financial instrument. No representation or warranty is given as to the accuracy or completeness of this information.
Any material provided does not have regard to the specific investment objective and financial situation of any person who may receive it. Past performance is not reliable indicator of future performance. AT provides an execution-only service. Consequently, any person acting on the information provided does so at their own risk.

BIDU close watchAs of the latest update, here’s a snapshot of Baidu Inc. (BIDU) stock:
Current Price: $86.86 (as of May 11, 2025, 10:26 AM EDT)
After-Hours Price: $87.29
Day Range: $86.68 – $87.75
52-Week Range: $74.71 – $116.25
Market Cap: $29.86 billion
P/E Ratio: 9.66
Dividend Yield: 0% 1
Analyst Outlook:
Consensus Rating: Hold
Analyst Breakdown: 12 Hold, 7 Buy, 0 Sell (out of 19 analysts)
Average Price Target: $110.83
Forecasted Upside: ~27.84% from the current price 2

$bidu smash or crashNASDAQ:BIDU continues to get bought up at this demand zone that has held for 12 years between $85-$73. One of the most beautiful charts Ive seen on an individual name in a long time. Not the most exciting name around but $70 cash per share on hand and a PE of 9 with as solid of a defined R/R as you can find. I think Trump's delistment threats are just fluff and could serve as a great buying oppurtunity if you're into Chinese stocks. Let me know your thoughts

Baidu Wave Analysis – 11 April 2025
- Baidu reversed from support zone
- Likely to rise to resistance level 90.00.
Baidu recently reversed from the support zone between the major long-term support level 78.60 (which has been reversing the price from the end of 2022) and the lower weekly Bollinger Band.
The upward reversal from this support level 78.60 is likely to form the weekly Japanese candlesticks reversal pattern Hammer (strong buy signal for Baidu).
Given the strength of the support level 78.60 and the clear bullish divergence on the weekly Stochastic indicator, Baidu can be expected to rise to the next resistance level 90.00.
