Bearish potential detected for CAREntry conditions:
(i) lower share price for ASX:CAR along with swing of DMI indicator towards bearishness and RSI downwards, and
(ii) observing market reaction around the share price of $36.14 (open of 13th May).
Depending on risk tolerance, the stop loss for the trade would be:
(i) above the pot
0.94 USD
178.42 M USD
766.70 M USD
About CAR Group Limited
Sector
Industry
CEO
William Elliott
Website
Headquarters
Richmond
Founded
1996
ISIN
US14575D1072
FIGI
BBG002MYFYT4
CAR Group Ltd. engages in the operation of online automotive, motorcycle and marine classifieds business. It provides car buying and selling services in Australia. It also provides online advertising solutions to media agencies and its clients, dealers, industry organizations and many other businesses. The firm operates through following segments: Online Advertising; Data, Research and Services; Investments; North America; Latin America; and Asia. The Online Advertising Services segment comprises of classified, display advertising services and finance commission. The Data and Research and Services segment offers software, analysis, research and reporting, valuation services, website development and hosting as well as photography services. The Investments segment includes online retail and wholesale tyre sales and inspection services. The North America segment includes online vehicle classifieds, display advertising services and automotive data services in United States of America and Canada. The Latin America segment includes online automotive classifieds and media advertising services in Brazil and Chile. The Asia segment provides online automotive classifieds, media advertising services and automotive data services in South Korea, Malaysia, China, Thailand and Indonesia. The company was founded by Gregory Paul Roebuck and Walter J. Pisciotta on June 18, 1996 and is headquartered in Richmond, Australia.
Related stocks

Potential outside week and bearish potential for CAREntry conditions:
(i) lower share price for ASX:CAR below the level of the potential outside week noted on 28th March (i.e.: $32.16).
Stop loss for the trade would be:
(i) above the swing high of 26th March (i.e.: above $34.05), should the trade activate.

CAR trend follow longCAR in weekly uptrend, had a nice break of tight daily wedge, looking for a pullback entry and trend follow

CAR retest + trend followCAR in a weekly uptrend.
Recent BO off earnings and pulling back. Looking for a retest of either the BO range or PoC and continuation.

Sympathetic Trade: Where there's smoke, there's fire !Where one stock in an industry goes up its competitor or similar companies in other markets might also go up. This can be described as a phenomenon of "sympathetic trading" or "sympathy moves" . In the stock market, a sympathy move is when the stock price of one company moves in tandem with the s

CAR.ASX | LONG ASSUMPTIONCAR.ASX up to 1+SD (Take profit line) of the current mean (golden line). Could see price reject or accept profit target unclear how the price will react to this level hence my take profit. May re-enter long if the break of TP+12pts or vice versa.

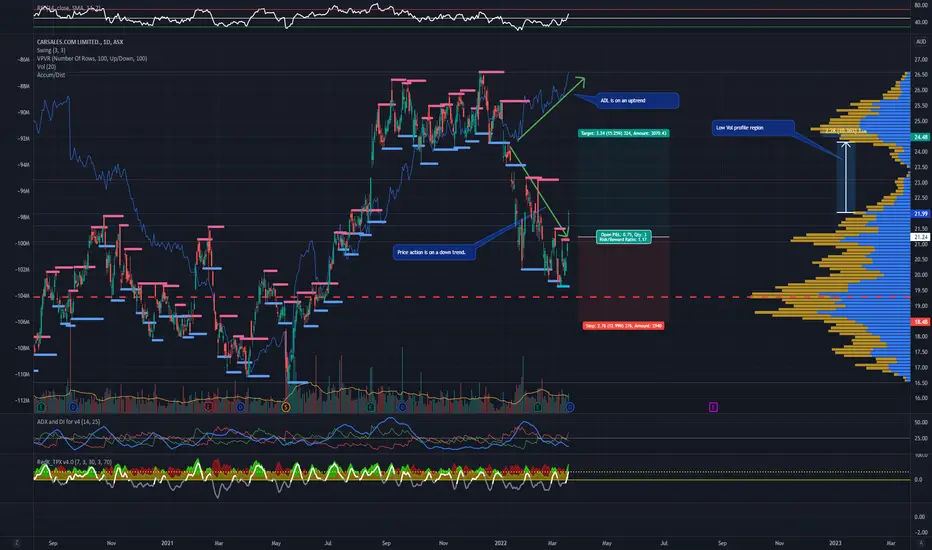
CAR - Bullish Accumulation Distribution (ADL) divergence tradeADL trend is up while price action is trending down - bullish divergence.
Price today at 21.99 took out the pivot point (resistance) at 21.51. Closed higher than previous day on above average volume. It did form a doji and going ex div tomorrow so could potentially pullback.
It is also in a low vol
CAR @ 6 OCT 2021Text me if you have any questions/comments for me.
-----
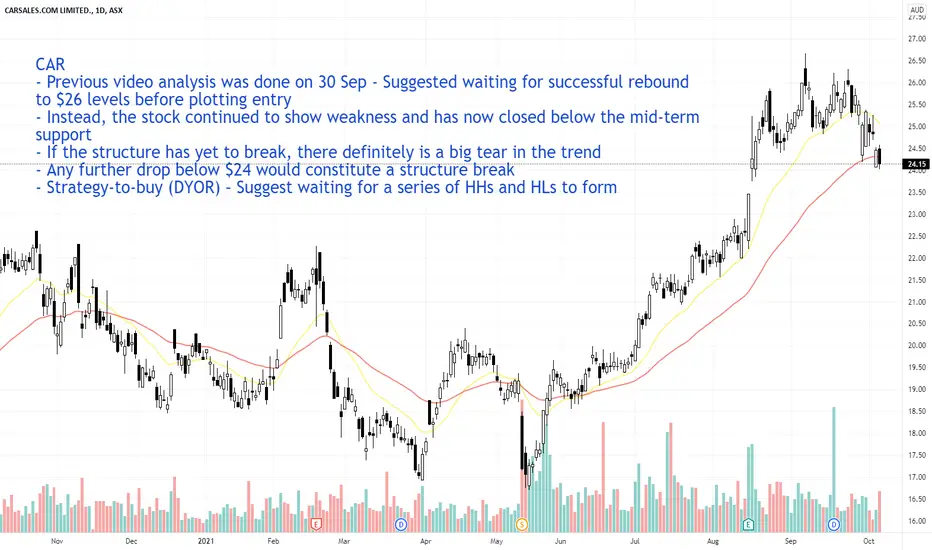
CAR
- Previous video analysis was done on 30 Sep - Suggested waiting for successful rebound to $26 levels before plotting entry
- Instead, the stock continued to show weakness and has now closed below the mid-term support
- If the structure
CAR @ 17 SEP 2021Text me if you have any questions/comments for me.
-----
CAR
- Previous analysis was done on 13 Sep - Suggested waiting for successful rebound at 25.75 levels before plotting entry
- Today’s price action with above average volume looks good
- If you missed the previously suggested entry, current

CAR @ 6 SEP 2021CAR
- Previous analysis was done on 1 Sep - Suggested waiting for a successful rebound and entry around 26 levels
- Today’s price action is good albeit slightly below the daily average volume
- Created new all-time high
- R is borderline 10%
- Strategy-to-buy (DYOR) – Suggest entry at current levels

See all ideas
Summarizing what the indicators are suggesting.
Oscillators
Neutral
SellBuy
Strong sellStrong buy
Strong sellSellNeutralBuyStrong buy
Oscillators
Neutral
SellBuy
Strong sellStrong buy
Strong sellSellNeutralBuyStrong buy
Summary
Neutral
SellBuy
Strong sellStrong buy
Strong sellSellNeutralBuyStrong buy
Summary
Neutral
SellBuy
Strong sellStrong buy
Strong sellSellNeutralBuyStrong buy
Summary
Neutral
SellBuy
Strong sellStrong buy
Strong sellSellNeutralBuyStrong buy
Moving Averages
Neutral
SellBuy
Strong sellStrong buy
Strong sellSellNeutralBuyStrong buy
Moving Averages
Neutral
SellBuy
Strong sellStrong buy
Strong sellSellNeutralBuyStrong buy
Displays a symbol's price movements over previous years to identify recurring trends.