FCEL Full History ChartHere's a monthly plot of FCEL stock price. Yes, those numbers are real, it's ridiculously high because of the number of reverse splits that they've done.
If you want to play short term movement, it's a fun stock. I've done it both long and short. It is NOT a stock you want to hold long term. They lose money. When revenue go up, they lose even more money, but the stock goes up and they can dilute the stock to raise money so they can keep the running for another 30 years, lol.
Same goes for PLUG, BLDP, and other fuel cell stocks. They can't sell their product at a high enough price to cover their costs.
Trade ideas

FCEL UpdateInteresting how these fuel cell companies get pumped every now and then, it's like a meme stock sector, lol. We'll probably see another spike up before the eventual decline. I've seen it a hundred times now, lol.
This company survives through reverse splits and dilution. Take a look at the 20 year chart before thinking this is a long term investment. It's NEVER made any money, and neither have any of the other fuel cell companies.

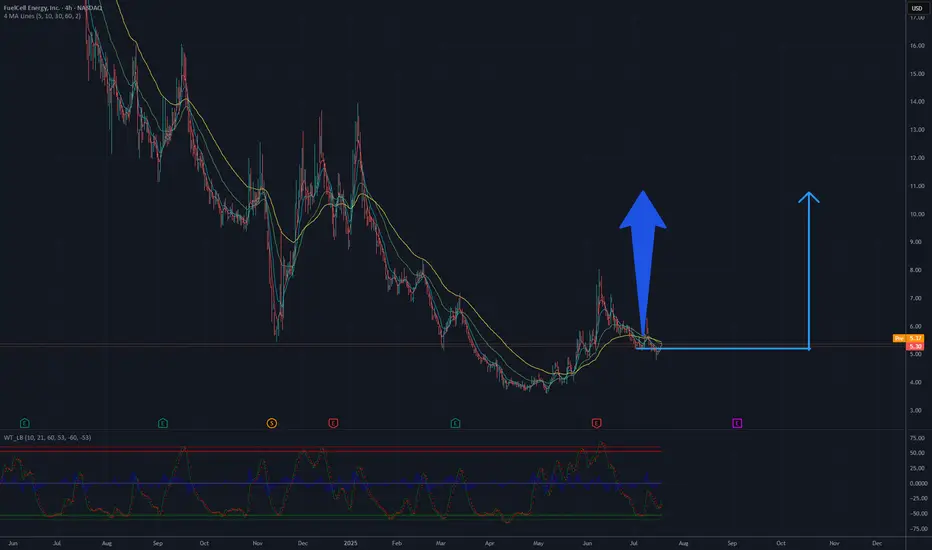
FCEL still relevant! 100% profit ! Potential TP: 11 USDTwo moving averages are visible (likely a short-term and a long-term one). The short-term one (yellow) crossed the long-term one (green) from below around May/June, which is typically a buy signal (golden cross). Currently, both moving averages show an upward trend, and the price is above them, confirming a positive sentiment. As of today, July 21, 2025, the current price remains relevant to this analysis.
Indicators at the Bottom of the Chart (likely oscillators): These indicators (though difficult to definitively identify without a legend, they resemble a momentum oscillator, perhaps MACD or similar) show buy signals and a clear upward trend after a period of overselling. The signal lines (green and red) also indicate growth.
Rises and Corrections: After a strong decline, the current rise appears to be a correction, but the momentum suggests potential for further upward movement.
Potential Resistance Levels: Around 7-8 USD, earlier levels are visible that could act as resistance.
Potential TP 11 USD
FCEL - Double bottom clos to confirmationNASDAQ:FCEL is looking at a strong potential break to the upside and likely to see mid-term recovery (3-6mths). as bullish double bottom reversal is close to being in play. Upside play has been strong since 5th Sep 25 onwards. With the strong parabolic play, we are looking at a break above the neckline resistance at US$8.07. Target is looking at 14.16 and 19.32. Long-term-target is at 43.59. 6.83 could be a strong support to accumulate if theres a minor correction. 5.31 is a good major support.

KOREAN AIDaily weekly both look great, need to break this trend and get 7$ maybe a break out and retest of trend line to cool off the 4hr rsi or a plan ol rejection but the way small names are getting sent right makes me believe this is a decent possibility. Holding shares and a few 5 and 10 calls.

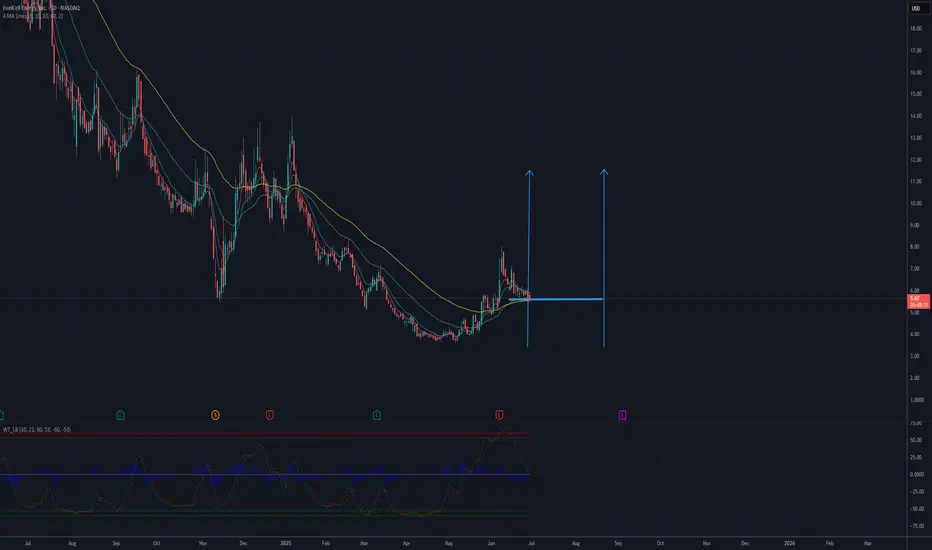
FCEL will back? 11 USD till September? Two moving averages are visible (likely a short-term and a long-term one). The short-term one (yellow) crossed the long-term one (green) from below around May/June, which is typically a buy signal (golden cross). Currently, both moving averages show an upward trend, and the price is above them, confirming a positive sentiment.
ndicators at the Bottom of the Chart (likely oscillators): These indicators (though difficult to definitively identify without a legend, they resemble a momentum oscillator, perhaps MACD or similar) show buy signals and a clear upward trend after a period of overselling. The signal lines (green and red) also indicate growth.
Rises and Corrections: After a strong decline, the current rise appears to be a correction, but the momentum suggests potential for further upward movement.
Potential Resistance Levels: Around 7-8 USD, earlier levels are visible that could act as resistance.
Potential TP 11 USD
FCEL (LOG)Now that I have seen Log is more beneficial at assessing the long term routes of charts, I have applied it to FCEL
BOOM
Not financial advice

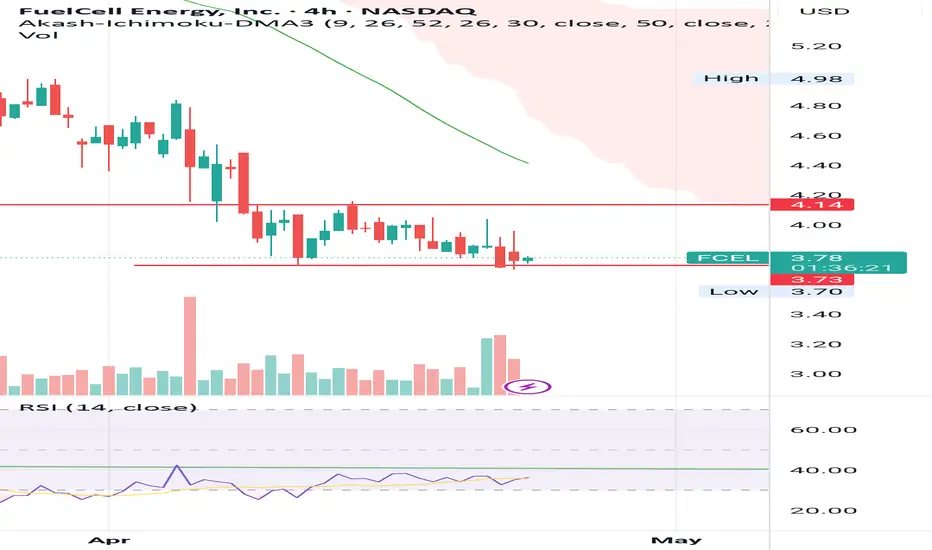
FCEL FuelCell Energy Options Ahead of EarningsAnalyzing the options chain and the chart patterns of FCEL FuelCell Energy prior to the earnings report this week,
I would consider purchasing the 5usd strike price Calls with
an expiration date of 2025-7-3,
for a premium of approximately $1.10.
If these options prove to be profitable prior to the earnings release, I would sell at least half of them.

Trade Setup Summary – Long Bias!🟢
Ticker: FCEL
Timeframe: 30-min chart
Current Price: $5.48
% Change: +39.09%
🔍 Technical Highlights
Price is breaking out of a wedge-like pattern, signaling bullish strength.
Breakout confirmation is marked at the yellow circle.
Volume is strong, indicating trader interest and momentum.
🎯 Trade Plan
Entry Zone: $5.48 (current breakout area)
Stop-Loss (SL): $5.08 (below wedge support zone)
Target 1 (TP1): $6.04 (red resistance line)
Target 2 (TP2): $6.70 (major resistance – green zone)
✅ Trade Bias
Bullish above $5.08
Neutral zone: $5.08 to $4.85
Bearish below $4.85

The cleanest if clean double bottoms incomingDouble bottoms everywhere but I especially like this on the monthly where the previous candle closed above the red support and the green current candle looks like it will close above it as well.
AMAZING! Just a shame at the pain many endured from this stock... ruthless world
Not financial advice


FCEL - 6 years later *spongebob*POTENTIAL DOUBLE BOTTOM
New low so potential bullish divergence
Not financial advice
Very long term hold imho

FCEL UpdateRemember this garbage? LOL, it reverse split at least a couple of times, so peak COVID price is much higher.
With Trump in office, probably gonna go bankrupt.

FCEL bullish divergence at double bottomI wonder what the earnings will show 👀
Make or break point for FCEL. I own some.
Not financial advice.

FCEL at the lowsImho fuel cell is a good gamble right now for a small investment
The new nasdaq rules suggest it is in their interest to keep the SP going up. This alongside the partnerships and products they sell - looks very good for the future.
Long term hold. Has potential to base here for a year or two ...
Not financial advice

Reversal needed on Day and breakout needed on HourlyOn the daily chart FCEL price is resting on the bottom of a bullish FVG and on top of a supply zone in the bottom of an upward parallel channel, there is a chance there might be a price reversal due to price position in the parallel channel and in the FVG, but the trader must be cautious of consolidation and fake outs and bearish break outs.
Turning our attention to the hourly, we see price in a descending triangle making lower lows and lower highs if we get a bullish break out or a break out that leads to a change of character/and BOS to an uptrend that may encourage the trader to go long however on the hourly if we get a breakout to the downside with a continuation of lower lows and lower highs that may encourage the trader to go short, as usual the trader must be wary of fake outs and consolidations on both timeframes. Please be so kind to review both charts for key levels.

FCEL BULLISHPlease take a look to FCEL, it have been a good performance during the last months, and its trending not seems to be stopped, the next first stop could be at $18 USD

Splits and pumpsHi guys, Tom Demark isn’t flashing any green yet, but we do have a reversal candle at the bottom of the bull fib channel. If the next candle can close above, then we can get a monthly entry point on a green 2 over a green 1. Look what happened after the last split.

FCELOn shorter timeframe FCEL has re-entered the bull fib, and broken through a short-term overhead. It’s a bit of headroom until the next resistance, so let’s see.

FCEL caught between a rock and a hard placeHi y’all,
It’s very ugly for FCEL bagholders like myself, and no attempt should be made to excuse this atrocity, but…volume is a good indicator, and volume has picked up last few days. Also, the price has seen aggressive price discovery as it bangs into some “kissing fibs”. Let’s hope this kissing escalate into a technical breakout on volume that the short interests cannot stop.

FuelCell Energy - Long-Target 58$Hello!
Head and Shoulders Reversal Pattern - target $ 58
I wish you good luck in making your own decisions, see you!
