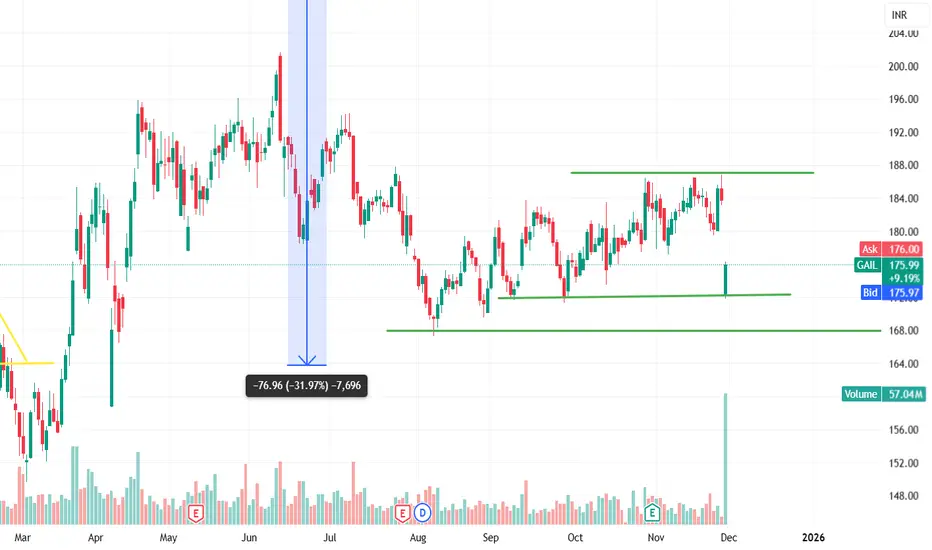
GAIL: Breakout Setup Destroyed by News — A Classic Chart vs. NewGAIL was right at the edge of a clean breakout above ₹187.50.
Chart structure tight tha — higher lows, shrinking volatility, and buyers consistently defending dips. Everything suggested an upside move was coming.
But one news headline changed the entire narrative.
PNGRB approved a much lower pipel
Next report date
—
Report period
—
EPS estimate
—
Revenue estimate
—
1.16 USD
1.47 B USD
16.79 B USD
About GAIL (India) Limited
Sector
Industry
CEO
Sandeep Kumar Gupta
Website
Headquarters
New Delhi
Founded
1984
ISIN
US36268T2069
FIGI
BBG000B9ZBY7
GAIL (India) Ltd. engages in the exploration, production, processing, transmission, distribution, and marketing of natural gas. It operates through the following business segments: Transmission services, Natural Gas Trading or Marketing, Petrochemicals, LPG and Other Liquid Hydrocarbons, and Other. The Transmission services segment includes natural gas and LPG. The Natural Gas Trading or Marketing segment supplies of natural gas include fuel to power plants, feedstock for gas-based fertilizer plants, LPG extraction, and city gas distribution. The Petrochemicals segment manufactures and markets polymers polypropylene, linear low-density polyethylene, and high-density polyethylene from natural gas. The LPG and Other Liquid Hydrocarbons segment sells gas processing unit products such as LPG, propane, pentane, naphtha, and by-products of polymer plant. The Other segment is involved in GAIL TEL, exploration and production, city gas, and power generation. The company was founded in August 1984 and is headquartered in New Delhi, India.
Related stocks
GAIL✅ GAIL – Clear & Concise Summary
Trend & Zones
Trend is UP across HTF–MTF–ITF → strong bullish alignment.
Demand zone: 156–159 (price taking support here).
Gann uptrend level: 181 (above this, momentum strengthens).
Trade Plan
Entry: 161
Stop Loss: 156
Risk: ₹6 per share
Targets:
• T1: 211
•

GAILHi,
Price has been break resistance area so possiblity that it will be moves upper side let see what happens next
This idea is for Educational purpose and paper trading only. Please consult your financial advisor before investing or making any position. Facts or Data given above may be slightly

GAIL Analysis 20-Sep-2025LTP: 181
Supports: 150/83
Resistances: 203/247
As long as the above supports hold, we will see 200 first.
Further,
Normal target: 200-227
251
Ultimate target: 272-300
Extensions: 344-389, 525

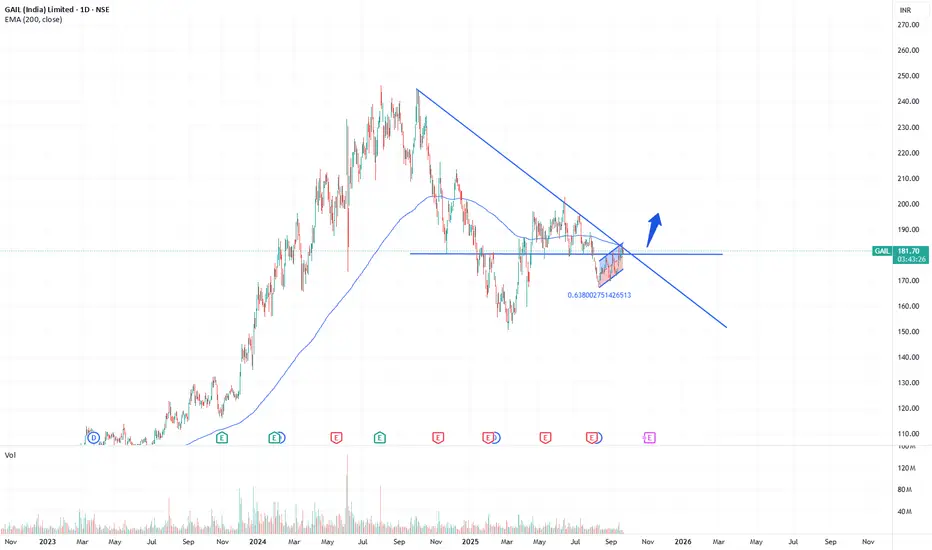
GAIL – Watching Trendline TestTrendline Break: Price is currently testing the long-term descending trendline near 182–185. Watching whether it sustains above this zone or reacts lower. This will be the first sign of buyers regaining control.
Channel Formation: Price is moving inside a rising channel. A move outside this chan
GAIL SellGAIL seems to take take resistance at channel top. Sell GAIL @CMP (181.50) with an SL of 184 and target of 175.

Energy Giant on Fire – GAIL Ready for TakeoffThis is the 4-hour timeframe chart of GAIL India Limited.
The stock is currently trading within a well-defined parallel channel and is positioned near its support zone at 165–171.
If this support level sustains, we may witness higher prices in GAIL, with potential targets in the 185–190 range.
Th

Gail Swing Trade Setup 📊 Price Action & Trend Analysis
Analyzing market trends using price action, key support/resistance levels, and candlestick patterns to identify high-probability trade setups.
Always follow the trend and manage risk wisely!
Price Action Analysis Interprets Market Movements Using Patterns And Trend

Gail India: (15 min)Gail India: (15 min)
Getting set for a breakout.
Add to watchlist and wait.
Note: The most important thing for a trader is, to believe what you see! Not to believe what you like to see!

GAIL at Best Support zone !! There are two chart of Gail on Daily timeframe.
On the first chart Gail is moving in well defined parallel channel with support near at 178-180 zone.
Daily RSI is also taking support and bouncing back, indicating a revival in short-term momentum and strengthening the overall bullish setup.
On the

See all ideas
Summarizing what the indicators are suggesting.
Neutral
SellBuy
Strong sellStrong buy
Strong sellSellNeutralBuyStrong buy
Neutral
SellBuy
Strong sellStrong buy
Strong sellSellNeutralBuyStrong buy
Neutral
SellBuy
Strong sellStrong buy
Strong sellSellNeutralBuyStrong buy
An aggregate view of professional's ratings.
Neutral
SellBuy
Strong sellStrong buy
Strong sellSellNeutralBuyStrong buy
Neutral
SellBuy
Strong sellStrong buy
Strong sellSellNeutralBuyStrong buy
Neutral
SellBuy
Strong sellStrong buy
Strong sellSellNeutralBuyStrong buy
Displays a symbol's price movements over previous years to identify recurring trends.