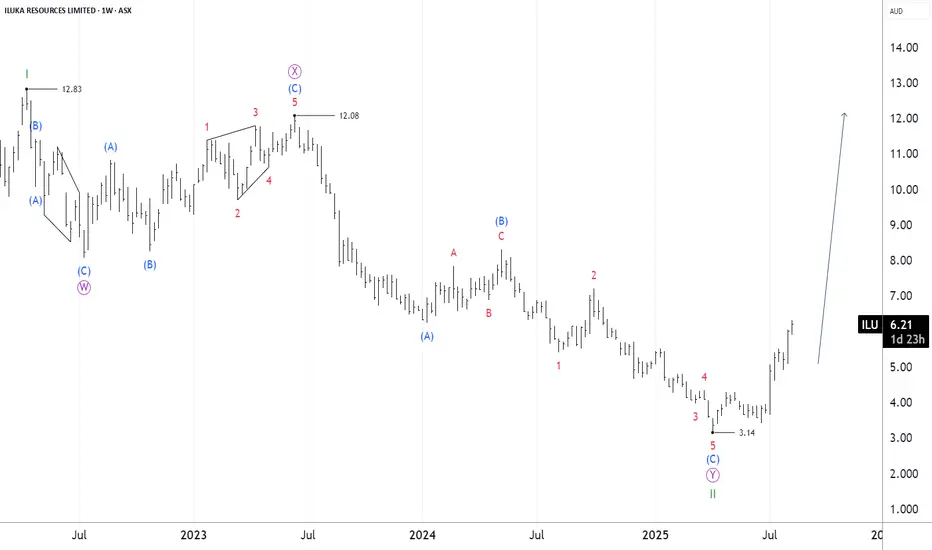
ASX:ILU - 13 AUG, 2025 - ELLIOTT WAVE ANALYSISConclusion: Wave III-green could be moving higher.
Key takeaways: Wave II-green ended as a Double Zigzag at 3.14. Wave III-green then moved higher, targeting the nearest target at 12.83. While price must remain above 3.14 to keep this bullish view valid.
©By Hua Chi Cuong (Shane), CEWA-M | Certifi
1.44 USD
152.57 M USD
771.93 M USD
About Iluka Resources Limited
Sector
Industry
CEO
Thomas O’Leary
Website
Headquarters
Perth
Founded
1954
ISIN
US4523631046
FIGI
BBG000K06376
Iluka Resources Ltd. engages in the exploration, development, mining, processing, marketing, and rehabilitation of mineral sands products. It operates through the following segments: Jacinth-Ambrosia/Mid West (JA/MW), Cataby/South West (C/SW), Rare Earths (RE), and United States/Murray Basin (US/MB). The JA/MW segment deals with mining operations at Jacinth-Ambrosia located in South Australia, and associated processing operations at the Narngulu mineral separation plant in mid-west Western Australia. The C/SW segment represents mining activities at Cataby and processing of ilmenite at Synthetic Rutile Kilns 1 and 2, located in Western Australia. The RE segment refers to the Eneabba Rare Earths Refinery, which is currently being constructed in Western Australia and associated feasibility studies alongside Phase 1 and 2 of the Eneabba development, and the Group's investment in Northern Minerals Limited. The US/MB segment focuses on rehabilitation obligations in Florida and Virginia, and certain idle assets located in Australia. The company was founded on July 24, 1954 and is headquartered in Perth, Australia.
Related stocks
ILU @ 17 SEP 2021Text me if you have any questions/comments for me.
-----
ILU
- Previous analysis was done on 14 Sep - Suggested half entry at 10.40 levels (to manage risk) or wait for a retracement and successful rebound
- Since then, the stock has dropped more than 9% to rest at the mid-term support
- As mention

ILU @ 14 SEP 2021ILU
- Previous analysis was done on 13 Sep - Suggested entry around 10.25 levels if missed out on previously suggested entry levels of 9.90
- Today’s price action is quite far from the short-term support
- Even though there still is a borderline 10% risk setup for entry, it is recommended to manage

ILU @ 13 SEP 2021ILU
- Previous analysis was done on 9 Sep - Suggested entry around 9.90 levels
- Since then, the stock has rebounded off the short-term support and created a new all-time high today
- If you missed out the previously suggested entry, current price levels still present some buying opportunities
- R i

GO LONG ILUKA I have been watching Iluka for a while and i got it at 8.85 previously and it's been going well.
It reached a high on July 30 and has been retracing and today (Aug 6) it is sitting on a support line (previously the top on June 30.
Watch the volume where i have circled. Very good volume coming in

Iluka ResourcesBusiness profile:
Iluka Resources Limited engages in the exploration, project development, mining, processing, marketing, and rehabilitation of mineral sands. The company operates through Jacinth-Ambrosia/Mid West, Cataby/South West, Sierra Rutile, Mining Area C, and United States/Murray Basin segme

ILU.ASX_Breakout and Retrace Trade_LongENTRY: 7.75
SL: 7.30
TP1: 8.50
TP2: 9.20
- ADX>20
- RSI>50 and >70
- Daily RS +ve
- Daily FFI +ve
- Daily MACD +ve
- Weekly RS +ve
- Weekly FFI +ve
- Weekly MACD +veA
- Breakout with good volume on 29 Apr 2021
- Retraced with lower volume

ILU gaps up on good volume. Recent director buys.Iluka gapped up today on good volume after some recent direct buying in March at a higher level around $7.40. This was a good 7% bounce from lows around $7. Mineral sands continues to play a big part in construction and infrastructure building, and no doubt producers will continue to be in demand in

Turtle Soup buy / momentum pinball
The intraday action shows a false break lower ( big tail ) and new low didn't last very long;
Double signal buy for few days hold or more....


See all ideas
Summarizing what the indicators are suggesting.
Oscillators
Neutral
SellBuy
Strong sellStrong buy
Strong sellSellNeutralBuyStrong buy
Oscillators
Neutral
SellBuy
Strong sellStrong buy
Strong sellSellNeutralBuyStrong buy
Summary
Neutral
SellBuy
Strong sellStrong buy
Strong sellSellNeutralBuyStrong buy
Summary
Neutral
SellBuy
Strong sellStrong buy
Strong sellSellNeutralBuyStrong buy
Summary
Neutral
SellBuy
Strong sellStrong buy
Strong sellSellNeutralBuyStrong buy
Moving Averages
Neutral
SellBuy
Strong sellStrong buy
Strong sellSellNeutralBuyStrong buy
Moving Averages
Neutral
SellBuy
Strong sellStrong buy
Strong sellSellNeutralBuyStrong buy
Displays a symbol's price movements over previous years to identify recurring trends.