L&T – BOX BREAKOUT → RETEST → RESUMING UPSIDE🏗️ L&T – BOX BREAKOUT → RETEST → RESUMING UPSIDE
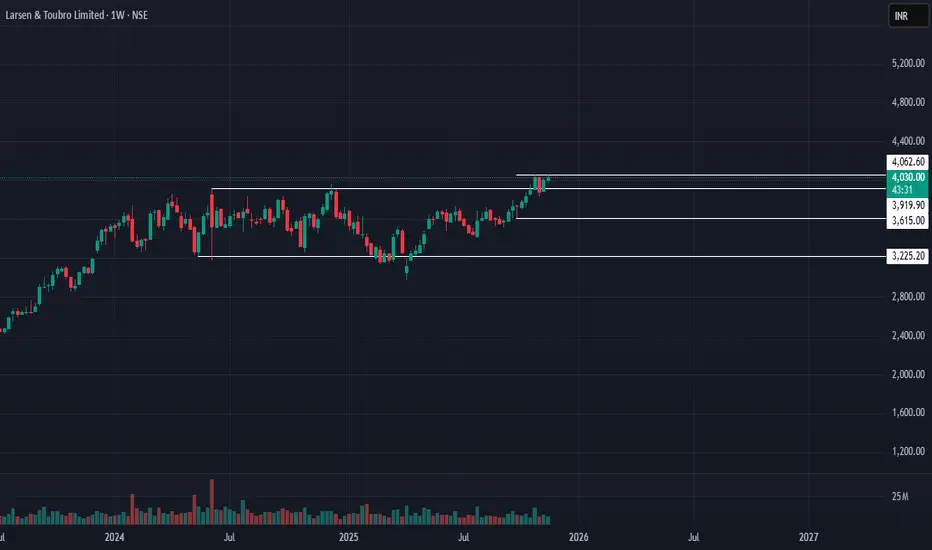
LT gave a box breakout 4 weeks ago, followed by a clean retest, and now the stock is showing strength again — indicating continuation of the uptrend.
📊 Technical Structure:
• Box range breakout confirmed
• Retest successfully completed
• Higher-low structure intact
• Momentum building for fresh upside
📈 Trade Plan:
• CMP: ₹4030
• Stop Loss: ₹3840
• Targets:
• T1: ₹4100
• T2: ₹4300
• T3: ₹4655 (positional target)
⚠️ Clarification:
This is an independent analysis based purely on technical & market study.
📝 Important:
Not responsible for any profit or loss. No fees are charged — purely educational.
📉 Disclaimer: Not SEBI-registered. Please do your own research.
Trade ideas
L&T - Cup and Handle Formation Near Breakout ZoneChart Structure:
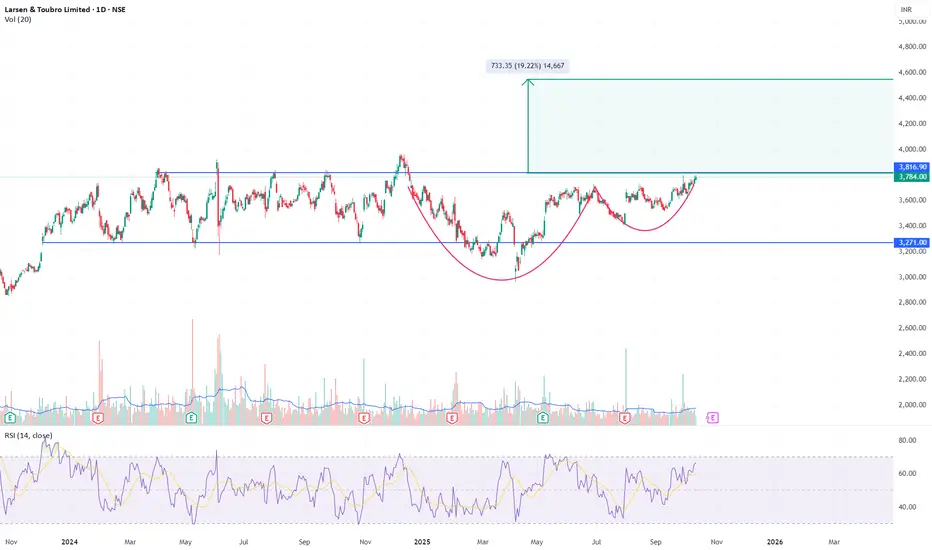
Larsen & Toubro is forming a textbook Cup and Handle pattern that’s now testing its neckline around ₹3,780–₹3,800. The base extends nearly 10 months, creating a strong accumulation structure with a shallow handle - ideal for a breakout continuation.
Technical Highlights:
Cup Base: ₹2,950–₹3,000
Neckline: ₹3,780–₹3,800 (currently being tested)
Handle: Tight consolidation with declining volume, now showing early expansion
RSI: Rising towards 70, confirming strengthening momentum
Volume: Reaccumulation behavior - lighter on corrections, heavier on upswings
Trade Setup:
Breakout Confirmation: Close above ₹3,820 with strong volume
Target: ₹4,500–₹4,550 (≈19% upside from breakout)
Stop-Loss: ₹3,600 (below handle low)
Technical Verdict:
A sustained move above ₹3,820 would mark a major bullish continuation, potentially initiating a new leg in L&T’s long-term uptrend. Pattern reliability is high given the depth, duration, and structure of the base.
Disclaimer:
This analysis is for educational and informational purposes only and does not constitute investment advice or a recommendation to buy or sell any security. Markets involve risk, and past performance does not guarantee future results. Conduct your own due diligence or consult a qualified financial advisor before making investment decisions.
LT Stock having Price squeeze pattern.LT Stock is having a price squeeze pattern refering to the previous year high and low. Probablility of moving higher is high.
LT Weekly Breakout In this stock we clearly see the Channel pattern is formed and Ready for Breakout , Wait for candle Close in 1D with good volume , then we can see very good move up to 15% nearly .
As now nifty is given Breakout from 1D Channel pattern and in Market Breadth 1D has given breakout and in weekly market Breadth it is near the Resistance , if we see good volume close in this week we can expect Market will be Bullish for next 2-3 Months .
Follow for more Swing Ideas Like This .
Don't buy LandT at this levels2000 level is good level to buy. At this current price it is overvalued.

most volume area clearedin this stock it have already cleared most volume area with a big jump ,and it is doing retest , it can be bullish from here

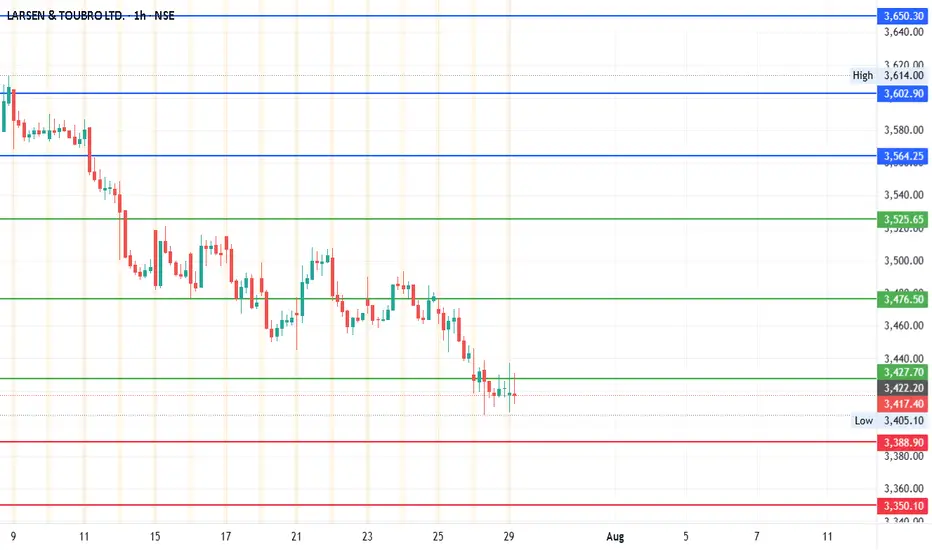
#LT - Pivot Point is 3476.50Date: 29-07-2025
#LT Current Price: 3418
Pivot Point: 3476.50 Support: 3427.67 Resistance: 3525.64
#LT Upside Targets:
Target 1: 3564.27
Target 2: 3602.90
Target 3: 3650.30
Target 4: 3697.70
#LT Downside Targets:
Target 1: 3388.88
Target 2: 3350.10
Target 3: 3302.70
Target 4: 3255.30
#TradingView #Stocks #Equities #StockMarket #Investing #Trading #Nifty
#TechnicalAnalysis #StockCharts #Finance #LT
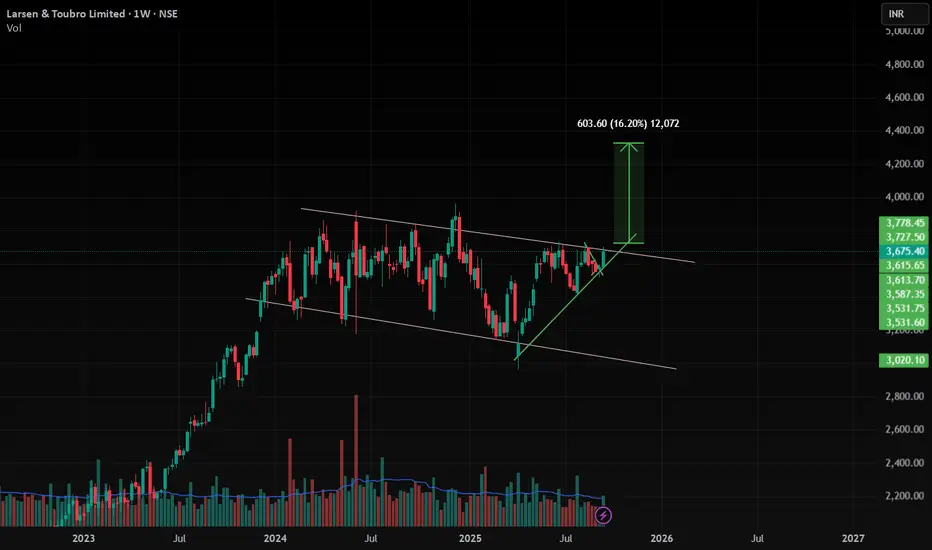
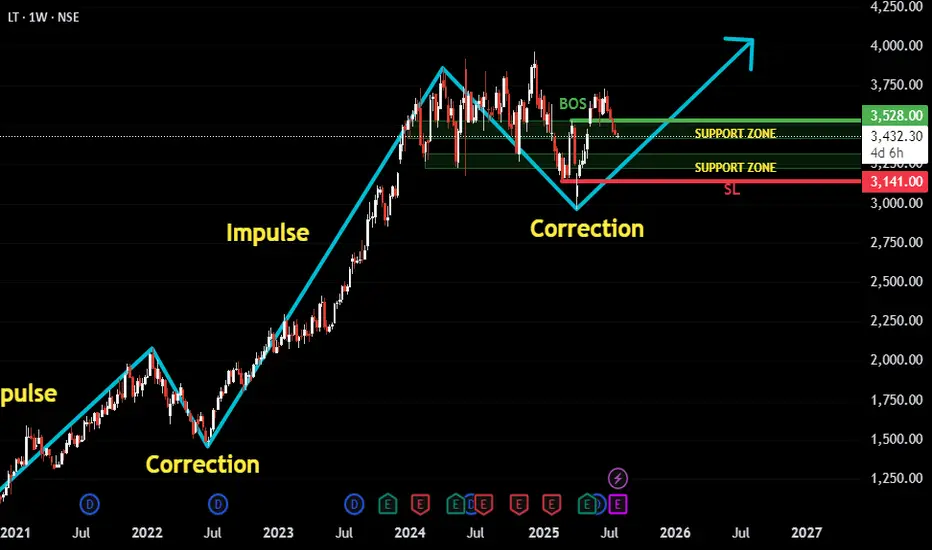
LT Following Classic Impulse-Correction Rhythm.This is a trend-following setup on LT (Larsen & Toubro) where we’ve observed a clear repeating pattern of Impulse → Correction → Impulse. The recent price action suggests that the latest correction has matured, and the structure now hints at a potential next impulse wave beginning.
Here’s the thought process behind the setup:
✅ The stock has been trending upward in a clean impulse-correction rhythm.
🕒 We waited patiently for the correction phase to develop fully and mature.
🔄 A Break of Structure occurred, signaling potential trend continuation.
🔁 Retest on support zones further strengthens the bullish case.
🧭 Support zones are drawn from the Daily chart for precision, though this post is based on the Weekly timeframe for broader trend visibility.
🛡️ Stop-loss can be maintained near ₹3141, just below key support.
🎯 Target is based on a 1:2 Risk-to-Reward setup, aligning with disciplined trading strategy.
Overall, this is a classic example of waiting for confirmation after correction before re-entering in the direction of the dominant trend.
As always, risk management is key. Watch how price behaves around the recent structure and support zones for validation.
My pick L&T short position Target 3335 to 3302market down position
everything mention about in my chart
enter current market price 3468
Traget 1-3335
Target 2-3302
I am not sebi register
just technical idea only

LARSEN AND TOUBRO -SHORTLT potential short as hitting a resistance area....sellers are getting charged...bulls being dumped

LT will move upside nowLT is now in momentum after liquidity sweep, so soon it will touch our targets within one month lets see , how it behaves

LT possible to touch 2850 for 15 to 17% correctionLT has shown Head & Shoulder pattern formation, it there is a breakdown then it has possibility to have following targets;
3260 / 3100 / 2930 / 2850

LT is ready to touch 3742 in coming weekLT is ready to touch our level 3742 and much more above soon, but after zigzag, but within week this target will achieve, lets see

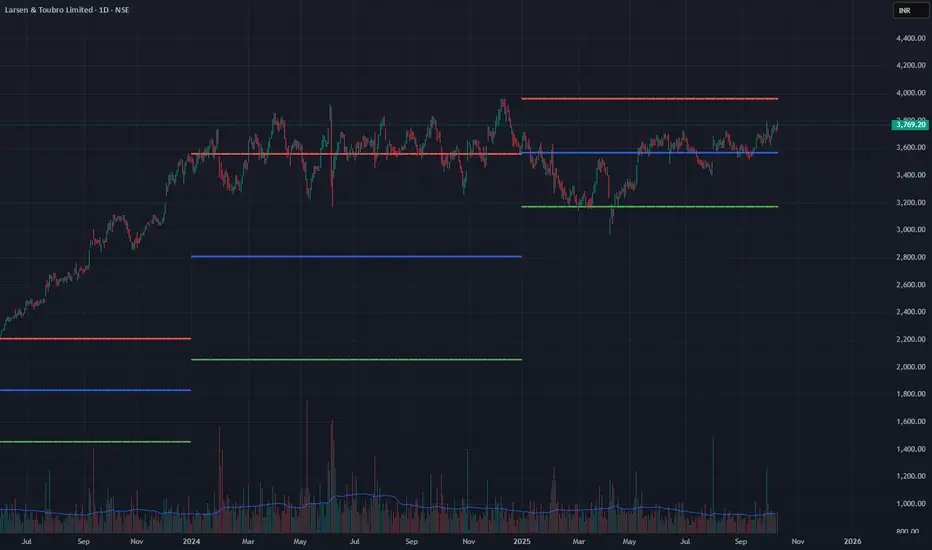
#LARSEN AND TOUBRO SUPPLY ZONEExplore key supply zones for Larsen and Toubro (L&T) with detailed technical analysis. These zones act as potential resistance levels where price reversals or pullbacks are likely, providing strategic entry and exit points for traders. Perfect for swing trading, breakout strategies, and risk management.

Larsen & Toubro Ltd. | Strong Support Zone & RSI Breakout AlertLarsen & Toubro Ltd. | Strong Support Zone & RSI Breakout Alert 🚀
Price is testing a strong demand zone, showing signs of reversal. RSI is approaching the 52 resistance level—if it breaks above, momentum could shift bullish! 📈
A good risk-reward setup for buyers if the support holds. Watching for confirmation! 🔍
Disclaimer:
This is not financial advice. Please do your own research or consult with a financial advisor before making any investment decisions. Investments in stocks can be risky and may result in loss of capital.

#LT Supply ZoneA LT Supply Zone (Long-Term Supply Zone) in trading refers to a significant price level on a chart where sellers have previously overwhelmed buyers, leading to a strong downward price movement. These zones are identified by areas where price has made a sharp drop after a period of consolidation, indicating a concentration of selling pressure. Traders often watch these zones for potential reversals or breakouts, as they can act as key resistance levels in the future. The concept is commonly used in supply and demand trading strategies.

LT | LONG REVERSAL | SWINGLT is showing signs of Reversal on the Hourly chart from the lows.
While this is not a trend change, hence long position needs to be built up only on a short term basis.
Target expected within a week or two - 3400.
Overall long term trend still remains bearish with scope of further correction.

LT | Buy L&T Future with small SL with Small TargetDisclaimer:
This is not financial advice. Please do your own research or consult with a financial advisor before making any investment decisions. Investments in stocks can be risky and may result in loss of capital.

L&T (Larsen & Toubro) – Critical Support Test! **⚠️ L&T (Larsen & Toubro) – Critical Support Test! 🚨**
🔍 **Range-Bound, But For How Long?**
L&T has been stuck inside a **broad consolidation zone** between **₹3,237 (support)** and **₹3,887 (resistance)** for months. Now, price action is testing the lower boundary – a **break below this could trigger a sharp fall!**
📉 **Why This Support is Crucial?**
✅ **Multiple Tests of ₹3,237 – Buyers Holding, But Pressure Building**
✅ **Trading Below 44-SMA (₹3,865) – Bearish Bias Growing**
✅ **Breakdown Below ₹3,237 Could Lead to ₹3,000 or Lower**
📊 **Key Levels to Watch:**
🔹 **Resistance:** ₹3,865 - ₹3,887 (Upper Box Limit)
🔹 **Support:** ₹3,237 (Lower Box Limit) – Break Could Accelerate Selling
💡 **Trading Plan:**
🔻 **Failure to Hold ₹3,237 → Bearish Breakdown**
🔻 **Reversal with Strong Bounce → Possible Move Back to ₹3,600+**
🔻 **Watch Volume & Price Action for Confirmation**
⚠ **BIG MOVE COMING – Will Support Hold or Break?** 🔥👀

Larsen & Toubro (L&T) - Potential Breakout?
The chart shows L&T consolidating within a descending trendline. A break above this trendline could signal a bullish breakout.
Key Levels:
Resistance: Trendline, 3,490
Support: 3,400
Stop Loss: Hourly Close below 3,367
Potential Targets:
First Target: 3,673 - 3,709
Second Target: 3,845
Disclaimer: This is for educational purposes only and not financial advice.
What are your thoughts on L&T?
#L&T #LarsenAndToubro #NSE #StockMarket #Trading #TechnicalAnalysis #Breakout
Please note: This analysis is based on the provided chart and current market conditions. Market dynamics can change rapidly, so it's crucial to conduct your own due diligence and risk management before making any trading decisions.

L&T 2 targets 1 month time frame Lets Develop with Growth Financial Performance
Revenue Growth: For FY 2023-24, L&T reported a revenue of ₹1,85,000 crore, marking a 15% year-over-year increase.
Profitability: The company achieved an EBITDA of ₹25,000 crore (+18% YoY) and a net profit of ₹12,500 crore (+20% YoY), with an operating margin of 13.5%.
Return on Equity (RoE): L&T's RoE stands at 16.8%, indicating efficient capital utilization.
Valuation Metrics: L&T trades at a P/E ratio of 22x (FY25E), which is below its historical average, suggesting potential for price appreciation.
Trade Setup and Exit Strategy
Current Market Position
Current Market Price: ₹3,440 (as of January 29, 2025)
Target Price: ₹4,100 (19% upside potential)
Trade Setup
Entry Point: If not already invested, consider entering at or below the current market price of ₹3,440, given the potential upside and strong fundamentals.
Stop-Loss: Set a stop-loss at around ₹3,200 to limit downside risk, considering the bear case scenario outlined in the report.
Exit Strategy
Target Exit: Aim to exit at or near the target price of ₹4,100 by the end of February, assuming the stock reaches this level.
Monitoring: Regularly monitor market conditions, company announcements, and sector developments that could impact L&T's stock price.
Adjustments: Be prepared to adjust the exit strategy based on market volatility, macroeconomic factors, or significant news affecting L&T or the broader market.

L&T on the runLarsen & Toubro Limited (L&T) is a prominent Indian multinational engaged in technology, engineering, construction, manufacturing, and financial services. As of January 10, 2025, its stock price on the National Stock Exchange of India (NSE: LT) was ₹3,536.15, with a 52-week range between ₹3,175.05 and ₹3,963.50.
In recent trading sessions, L&T's stock has exhibited mixed performance. On January 15, 2025, the stock rose by 1.03% to ₹3,501.15, outperforming the BSE SENSEX Index, which increased by 0.29% to 76,724.08. However, it remained below its 52-week high of ₹3,963.00, set on December 10, 2024
Profitability:
1) Revenue Growth: In the fiscal year ending March 31, 2024, L&T reported consolidated revenues of ₹221,113 crore, marking a 21% year-over-year increase.
2) Net Profit: The company achieved a consolidated profit after tax (PAT) of ₹13,059 crore for the same period, reflecting a 25% growth compared to the previous year.
3) EBITDA Margins: L&T's EBITDA margins vary across its business segments. For instance, the Energy Projects segment reported an EBITDA margin of 10.0% for the year ended March 31, 2024, an improvement from 9.1% in the previous year.
L&T INDIA | LARSEN & TOUBRO
Financial Health:
1)Order Inflow: The company secured orders worth ₹302,812 crore during the year ended March 31, 2024, registering a robust year-over-year growth of 31%.
2)Debt Levels: As of March 31, 2024, L&T's total debt stood at ₹1,05,000 crore, with a debt-to-equity ratio of 1.5, indicating a moderate level of leverage.
3) Credit Rating: Fitch Ratings has acknowledged L&T's steady margins, supported by adequate risk management and diversification into stable sectors.
Recent Developments:
In October 2024, L&T reported a 5% rise in its second-quarter profit, reaching ₹33.95 billion, driven by the faster execution of previously commissioned projects.
The company maintained its full-year order growth forecast, reflecting confidence in its business outlook.
Overall, L&T demonstrates strong profitability and maintains a healthy financial position, supported by consistent revenue growth, effective cost management, and a robust order book. However, it's essential to consider market dynamics and sector-specific challenges when evaluating the company's future performance.

LT | LARSEN & TOUBRO LTD.Disclaimer:
This is not financial advice. Please do your own research or consult with a financial advisor before making any investment decisions. Investments in stocks can be risky and may result in loss of capital.
