Strategic Reaccumulation Zone – NXT’s Next Move Is CriticalNXT is at a pivotal level and shouldn’t be overlooked. Price has rallied strongly off a clean April hammer, which aligned with:
Yearly S1 pivot
Macro 50% level (projected from ATL to ATH)
High volume confirmation
This confluence marked a powerful reversal. Price has now reached the 50% resistance zone from the ATH and April low. What happens next will likely define the longer-term trajectory.
Scenario Modeling
Scenario 1 – Most Bullish
Price breaks and holds above $14.48
Reaccumulation above this level
Sets up a challenge of ATH and potential price discovery
Scenario 2 – Strategic Pullback
Missed the April low? This offers a second chance.
Pullback to the Yearly S1 pivot (dynamic tool—watch where the local top forms)
A higher low here = ideal entry with strong R:R
Scenario 3 – EQ Demand Zone Entry
Price dips into the EQ zone of the April wick
Bullish candle off this level = high-quality entry
Converges with macro 50% ATL–ATH projection
will take much longer for price to challenge ATHs
Scenario 4 – Breakdown Risk
April low breaks
Downside targets: $6.96 and $5.78
Takeaway: This is a step-by-step reaccumulation watch. Let price reveal intent—each scenario offers a unique R:R profile. Stay nimble, stay strategic. I will update the chart when price settles
*please note, arrows are not time analysis
NXDCF trade ideas

NEXTDC.ASX - Bullish Swing on Ascending ChannelA swing trade with a good Risk to Return ratio.
AI and Datacenters currently triggering positive fundamentals sentiments.

Overall Bullish on NXT ASX Currently in PubllBack phase overall im Bullish on NXT. i mainly trade forex using IMB'S on timeframes such as monthly weekly daily 4h and 1H. but nxt we need to look at longer term time frames like 12months, 6 months and 3 months. and i potentially see we are pulling back to the break of the 6month and 12month
once we tap these areas of interest we go down even lower to see a shift in market structure and Order flow. i dont really see price going lower then $12.53. we have just over 3 months left until a new 6 month candle is created which is when we could possibly see bullishness kick in again


NXT on ASX nice backtest breakout.For teh pensoion fund! Looks niiiice :) backtyesting bullflag. As long as you're appy with NYSEW adn teh FEDpipeline of free money

(ASX: NXT) 7 Month trend reversalG'day lads, before I get into the TA I'm gonna let everyone know, that my ability to read financial information is quite lackluster. I'm not going to mention it at all, because I don't want to embarrass myself, now before I get an angry virgin abusing me in the comments, I'll say one thing. Use this theory alongside your financial analysis.
Anyway, NXT has had a beautiful down trend 3 peaks, 3 reversals. I've been trying to find where it would breakout, and when I used the fib I saw there was going to be a possible reversal on the 50% line. I assumed this, due to the fact that the last low was between the 78% & 61%, once price broke resistance, and had a small rally, I knew this was a bull trap, and set the buy zone between $10.88 and $9.74. I set $10.61. There was another small rally, touching resistance on the downtrend. The pullback hit another buy order I placed just above the buy zone, because I wasn't sure if the top of the buy zone would act as support.
I saw that there was a line of resistance forming along the 61% line, and decided to make a call on my small tradingview group chat, once the resistance was broken, I knew that a breakout of the downtrend was imminent, I believe it was 2 or 3 days later that we saw the price close on the resistance, with a wick above. I called that the following day we would possibly see resistance at the previous high, which we didn't end up meeting.
As you can see in the image above, I have drawn a dashed red line representing our first level of resistance we'll have to beat on our way up. We will see a rejection at the resistance, brining us down and testing the support that will be the downtrend. from there we will rally above the resistance @ $12.06, having a small reversal, using the high as support, and continue our run to the next possible buy zone.
This zone sits between $13.25 - $12.36. Price will consolidate in this region, before we push to $15.
Summary, because people complain when I don't make one. Price will hit $15 by late October. How? Read the text.


Candlestick Prediction Next DC for August 13My prediction for nextdc share price movement based on my understanding of candle movements.


NXT to Retest ATHTech Is strong at the moment across most indices, we have a bullish flag formation here with nice consolidation above the $9.40 resistance area, building strength for a move up to all time high of $10.35 and then perhaps higher.

NXT.ASX: price and volume breakoutNXT share prices break out to the upside with supporting volume in today's session 14/1/2018. NXT share prices could continue to its next target at 6.65/6.70 if it remains above 6.50 support.

Potential breakout for NXTNXT appears to be testing ~$6.80, if it retests and breaks through, this level may convert to a support to promote an upward trend towards the next resistance ~$7.50. This is based on the oscillated motion from ~10th of September to 24th of December. The bullish candle on the 24th of December is not extremely strong as it has a large top wick, so it may be a false sign in which case a breakout of the ~$5.68 support may be possible, leading to a downtrend.
**This is not financial advice, and is only my opinion. Trade at your own risk.**


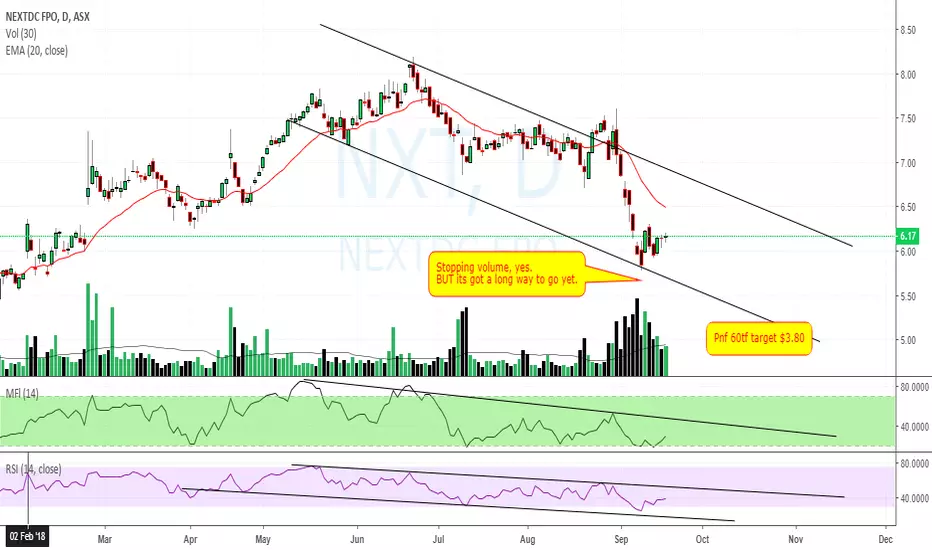

NXT.ASXShare prices have broken out to the upside with supporting volume. This could be a long opportunity here if prices hold above 6.96 with continues supporting volume.

NextDC GAP Filled, Ready to Run?Up over 100% in 12 months, running a strong trend.
Gap recently filled. On wards and upwards.
Stopploss set below the gap.
